

This is my blog. I can’t stand scammers. I try to keep my distance from anybody caught up in the crypto scam. I trade Forex. I know how to make money with currencies. I share my findings, my knowledge for free.


You could possibly learn something here, at the Ocean Club.


My name is Norman, Lou Norman.
I’ve been in this business for fifteen years.
You still don’t smoke?
I need a drink.
And maybe you’ll join me.
…


…
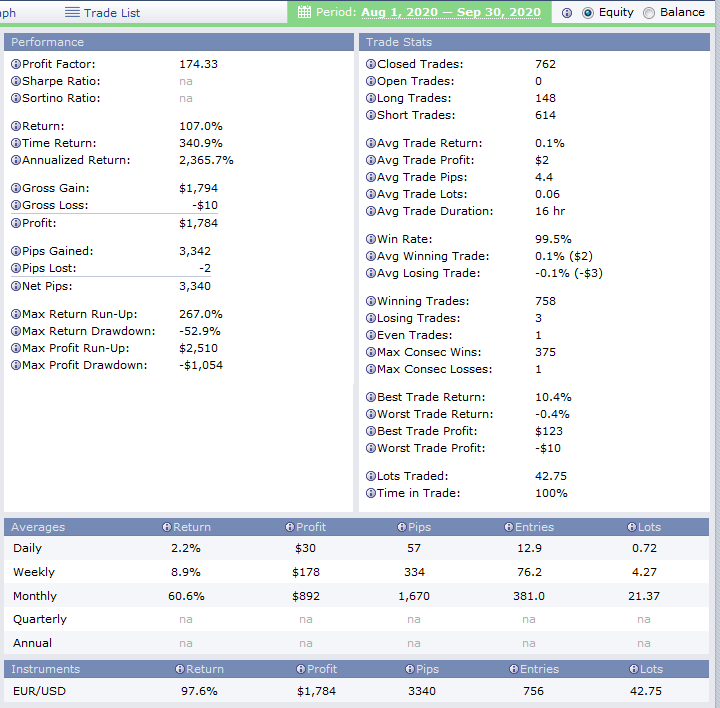
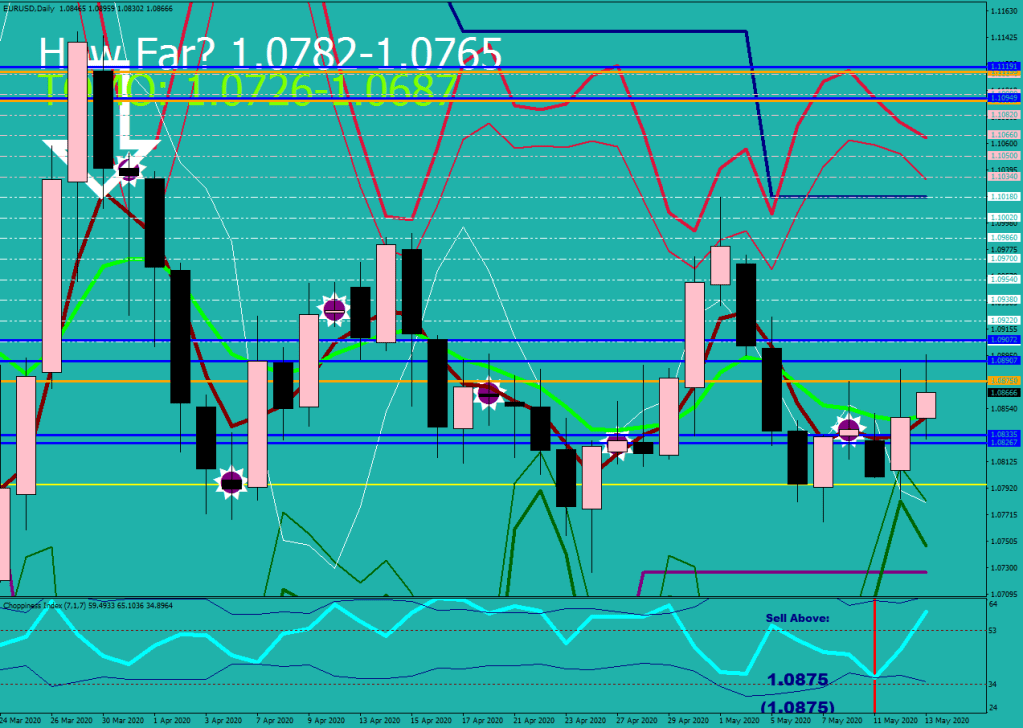
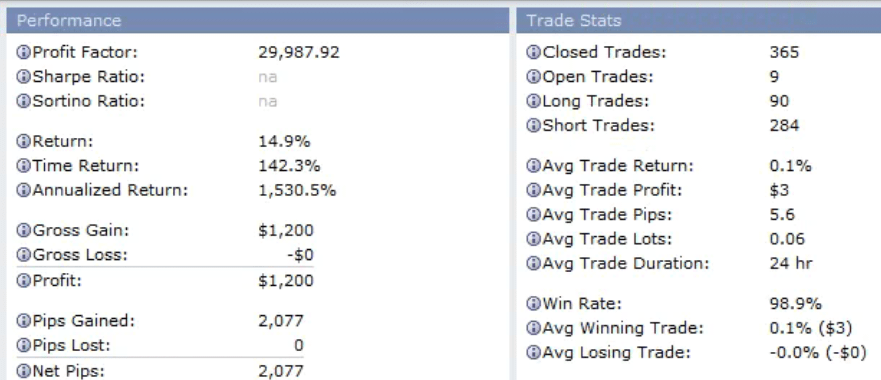
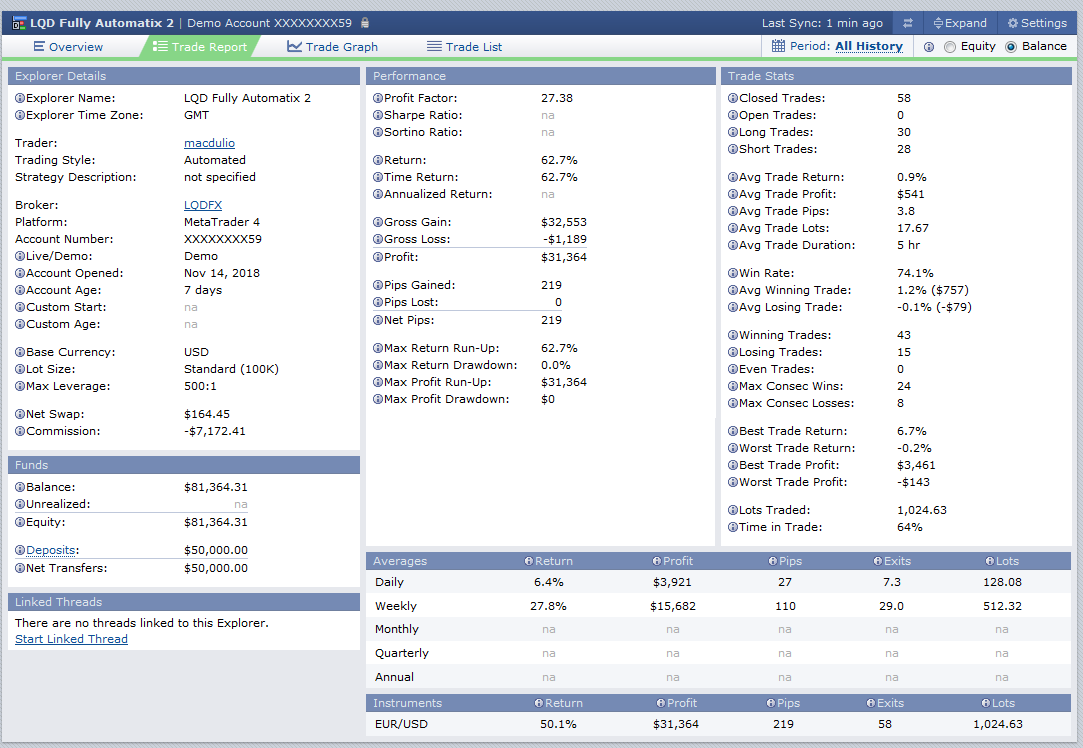
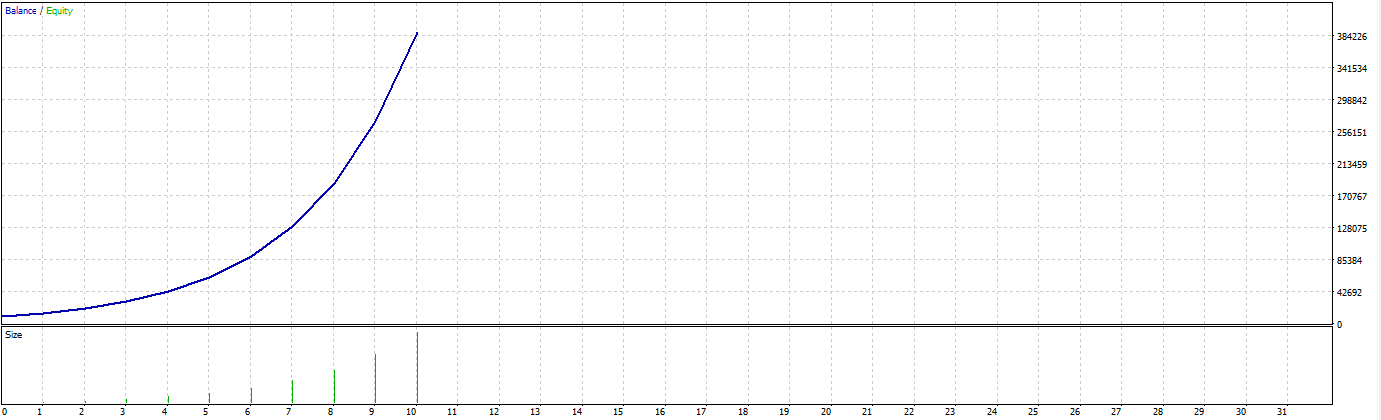
You’ll find a much larger profit factor tagging 30k further down this page


…
A quote from my blog entry, “No Drive Moratorium”
…

…
“Cash is trash” – Ray Dalio
“Ray Dalio talks trash & has a bridge to sell you” – Macdulio
I don’t have a trading courses for sale, for I’m not a scammer.
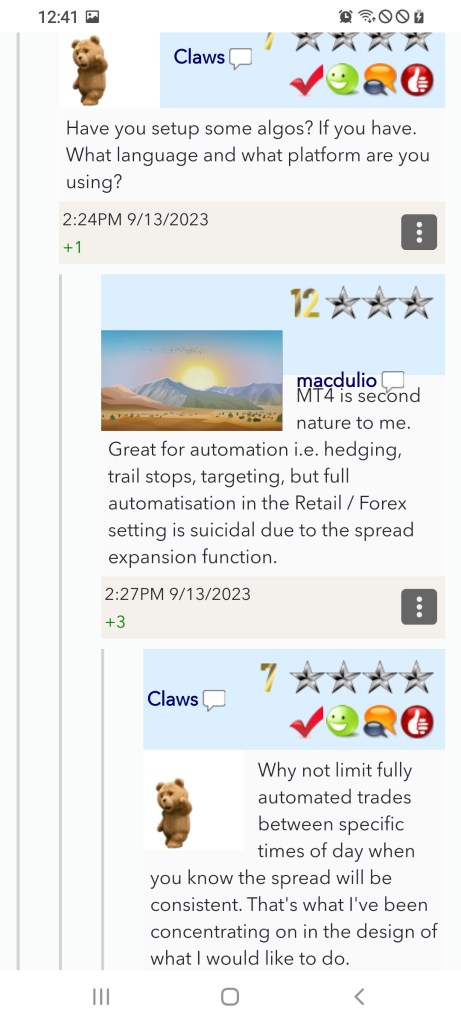
I don’t have any automated trading routines to sell, for I do not believe in fully automatised solutions.
I would self describe myself as a systematic trader who engages in coming up with working market models and automatises certain trading functions.
…
My learning is a tedious, slow process with draw down hells in the name of research and testing my on theses. I.e.:

…
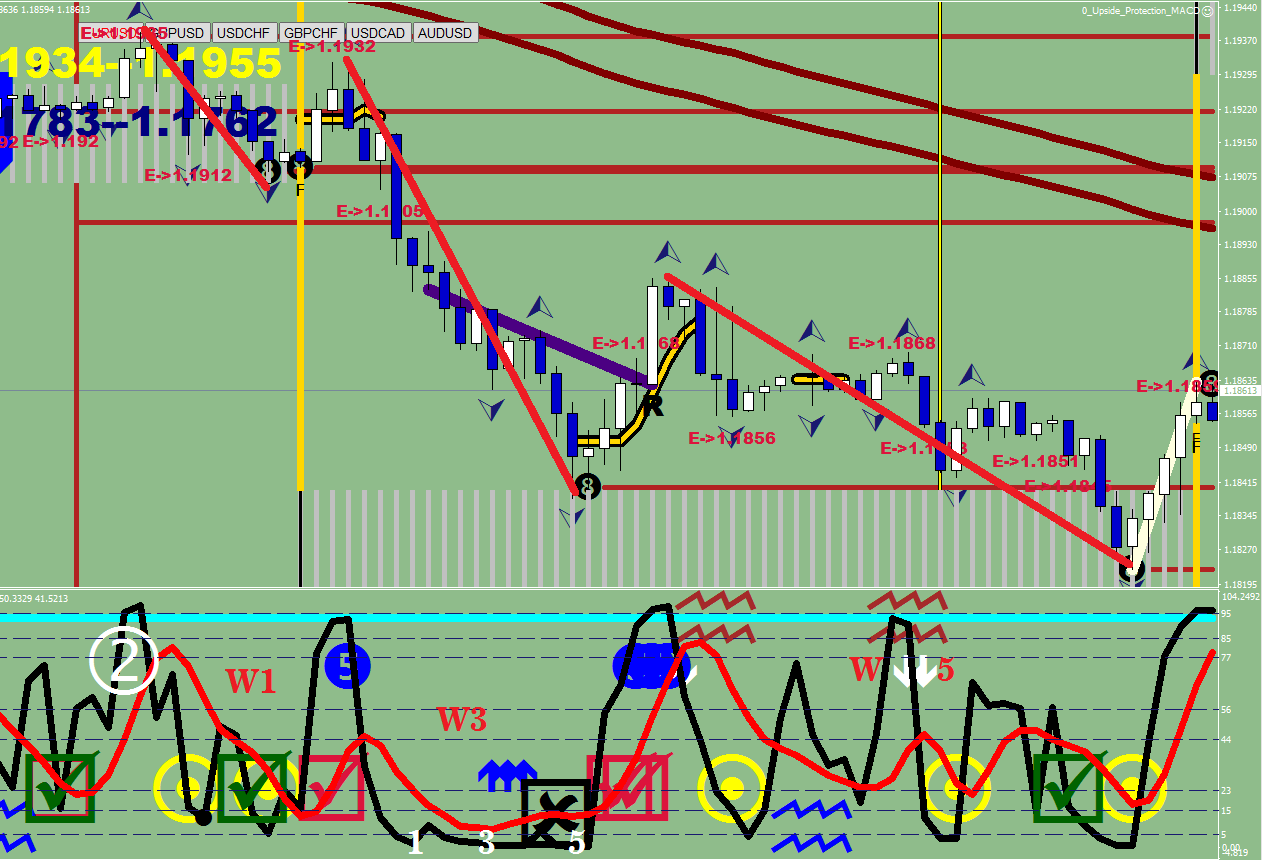
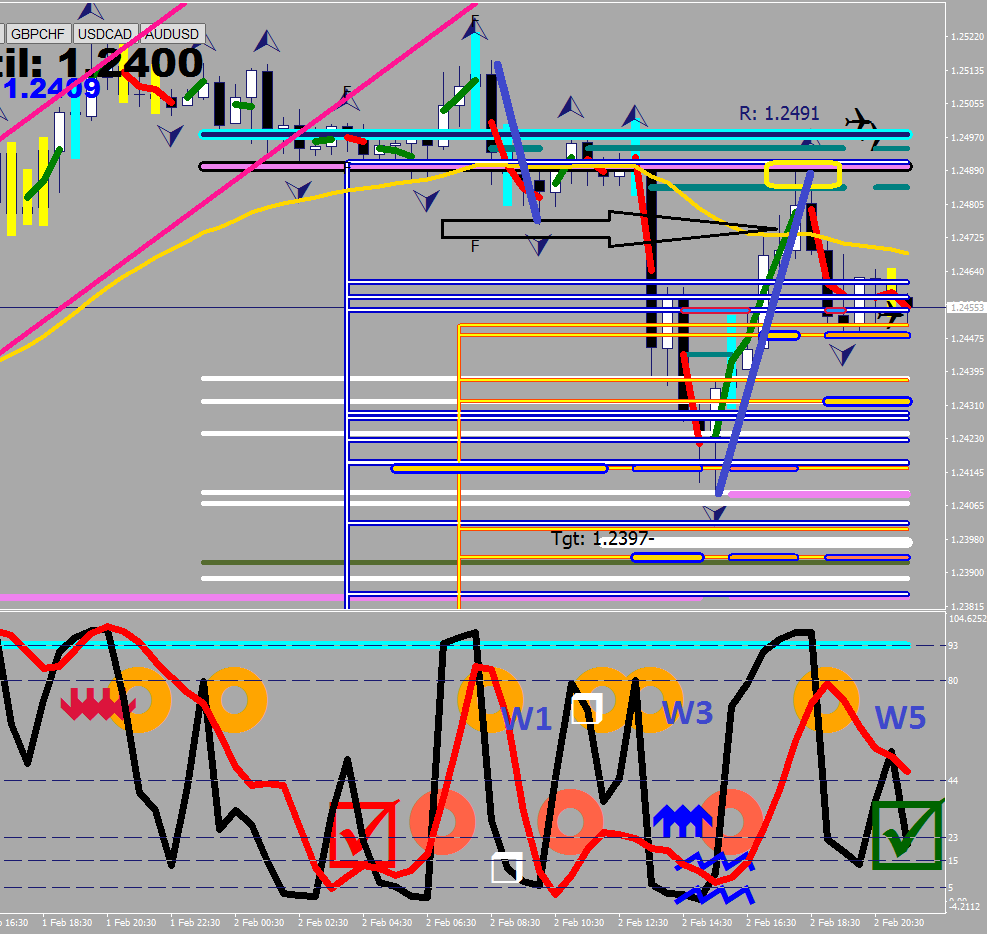
Wave 3 – Institutions Buy
Wave 5 – The Retail Buys
When someone is offering you a holy grail, a one size fits all, a you can trade any instrument with this “knowledge” run as fast as you can.
I don’t know how to trade everything… I can help you by showing edges in one single currency pair. This pair I can survive with, with this pair I am going to thrive… and perhaps you could too.
Ask yourself the question: Do I want to be the jack of all trades or get paid well for being highly specialized?
What could be had from me / this blog in exchange for supporting my works with a donation of your choice?
I have EAs available which are (over)Hedgers, Trail Stops, Croppers, Target Adjusters.
Hedge Me / Half Hedge Me Below Equity – to avoid overnight account wipe outs.
2-Hour Protective Stop Loss – you decide on the number of seconds after you would like a break-even 1-2 pips gains locked in case the head wind would rise again.
Crop Longs Above RSI and Crop Shorts Below RSI – you choose the RSI print to take profits at.
Trail Stop Only LT – different “stop loss codes” prompt different kind of trailings or constant target adjustments to the current location of an EMA.

…
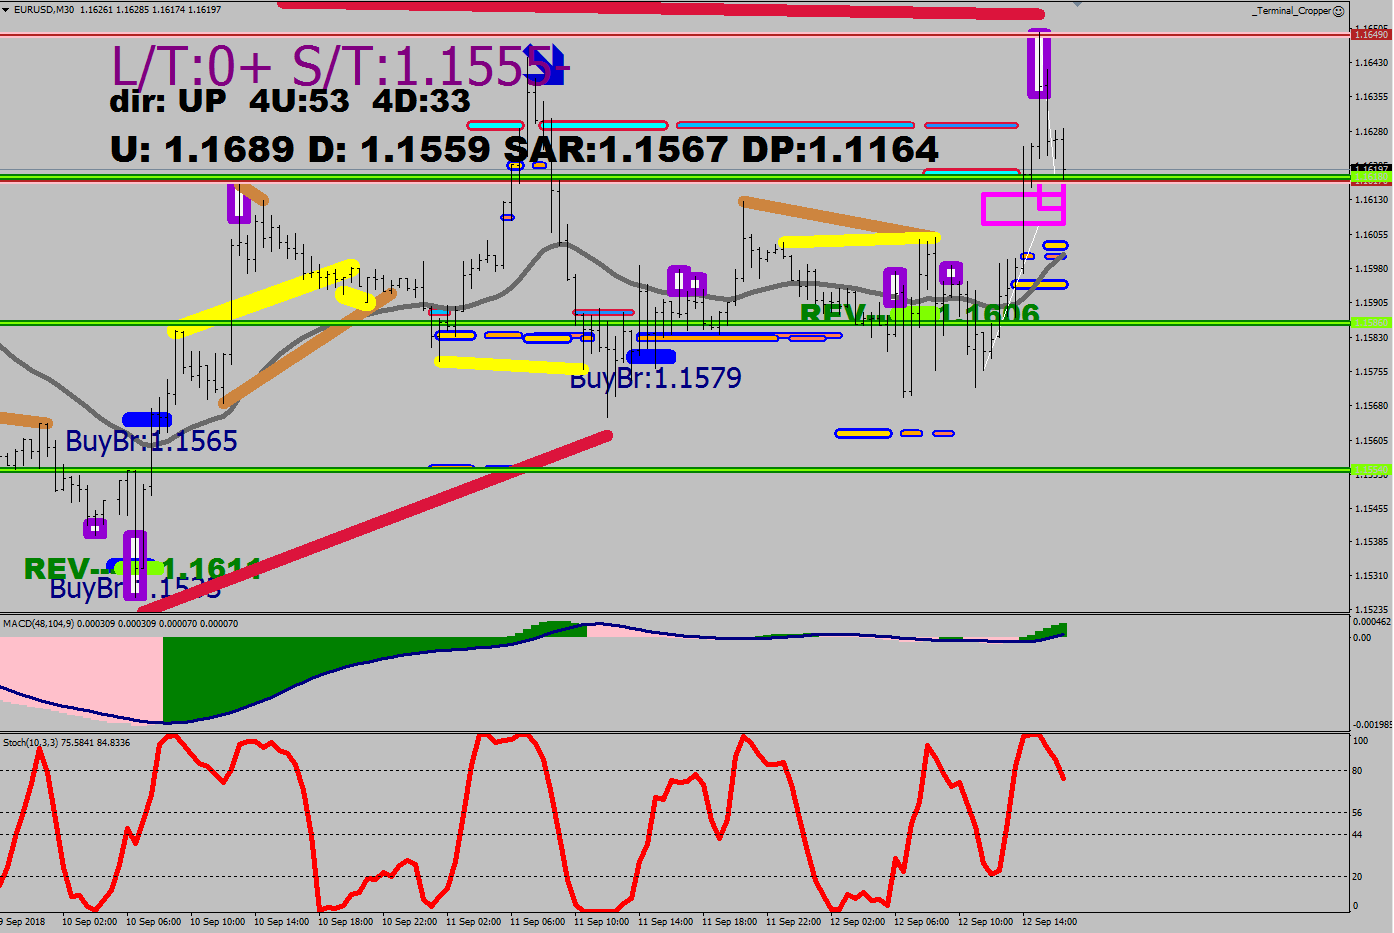
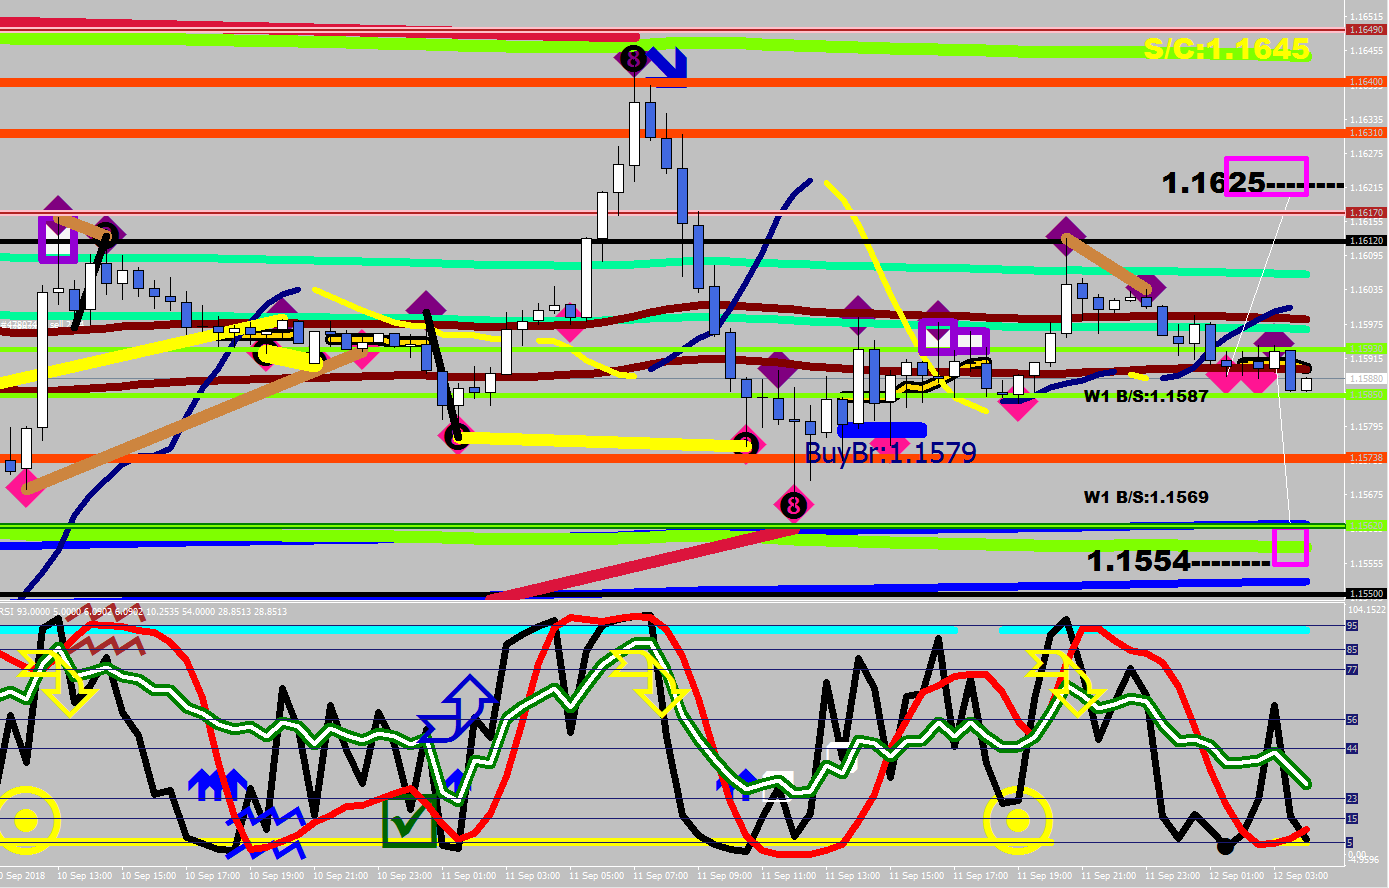
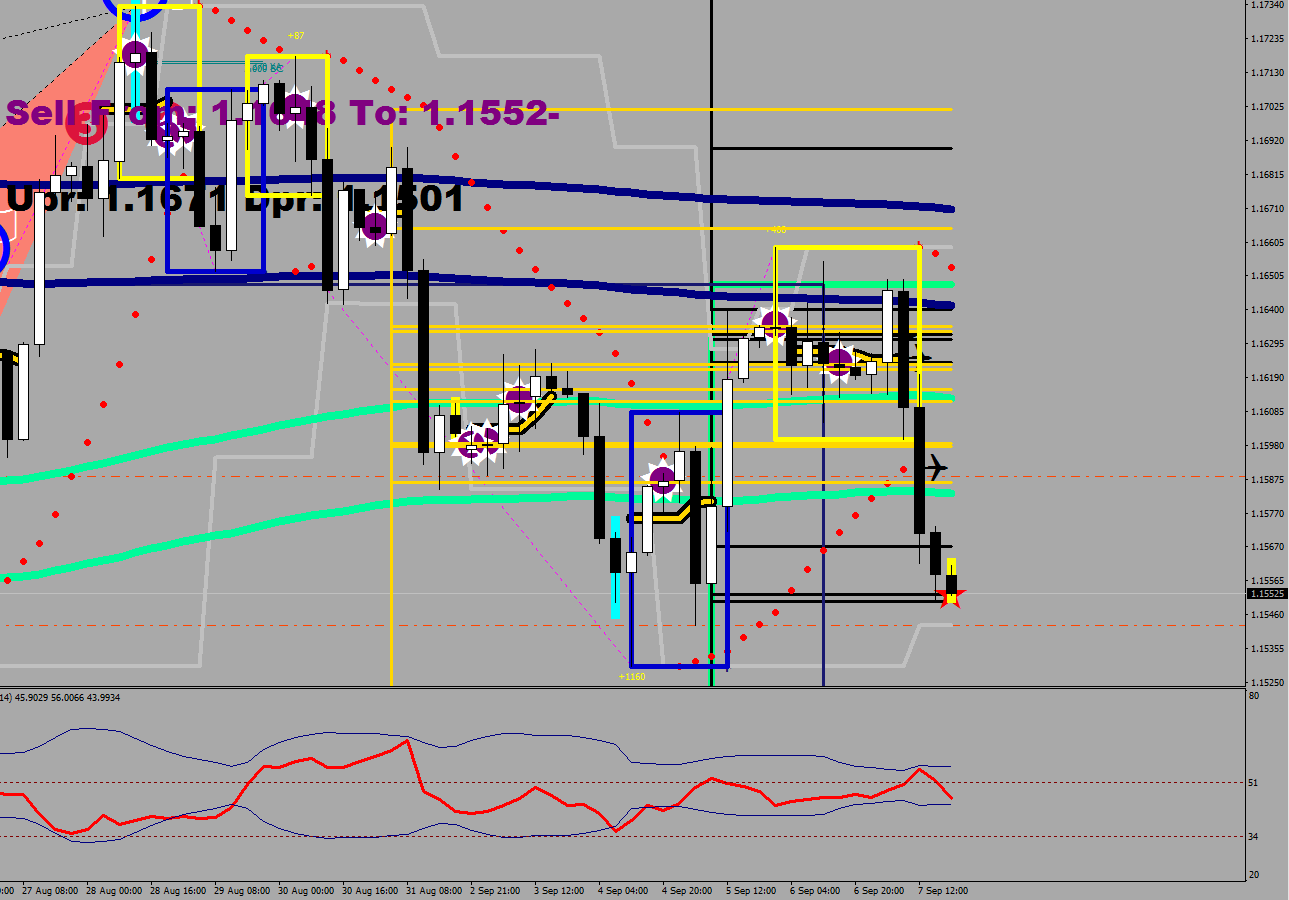
People ask questions from me, like “how can you trade with that?”
You don’t need to plot everything, you need some understanding and I definitely have coded some of the best indicators into existence. See for yourself!
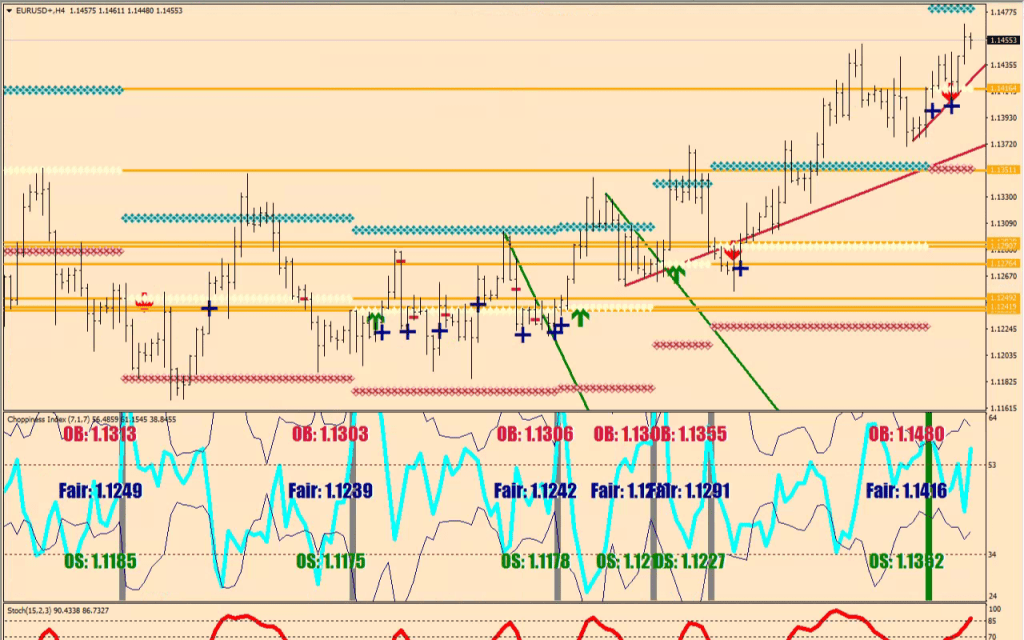
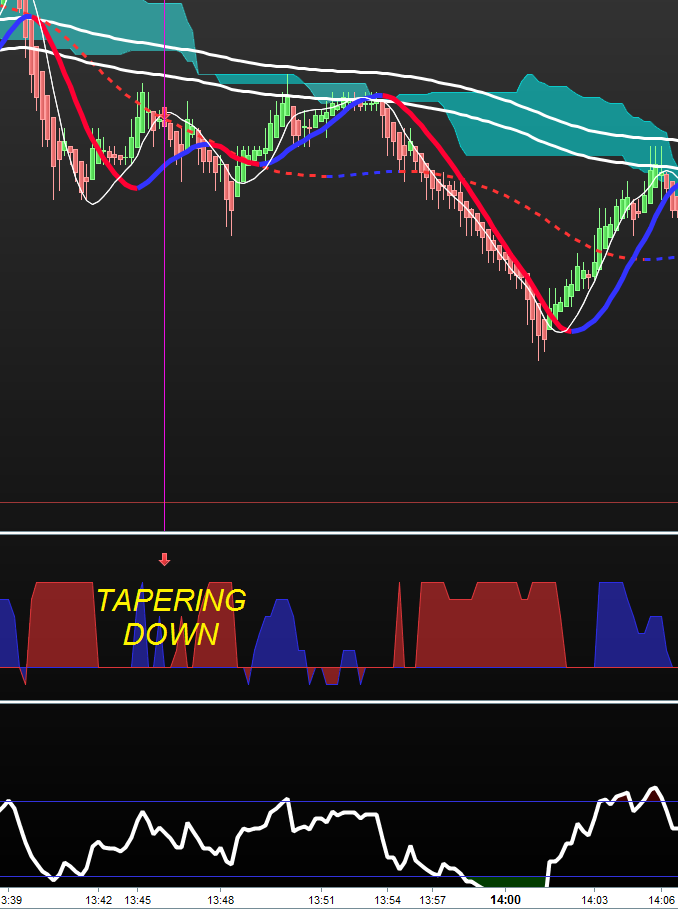
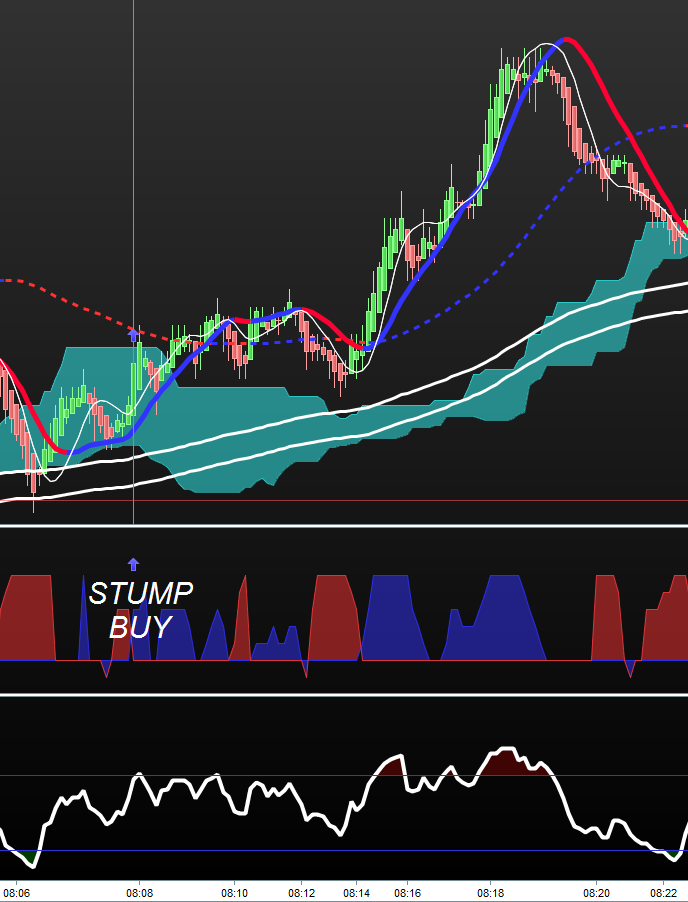
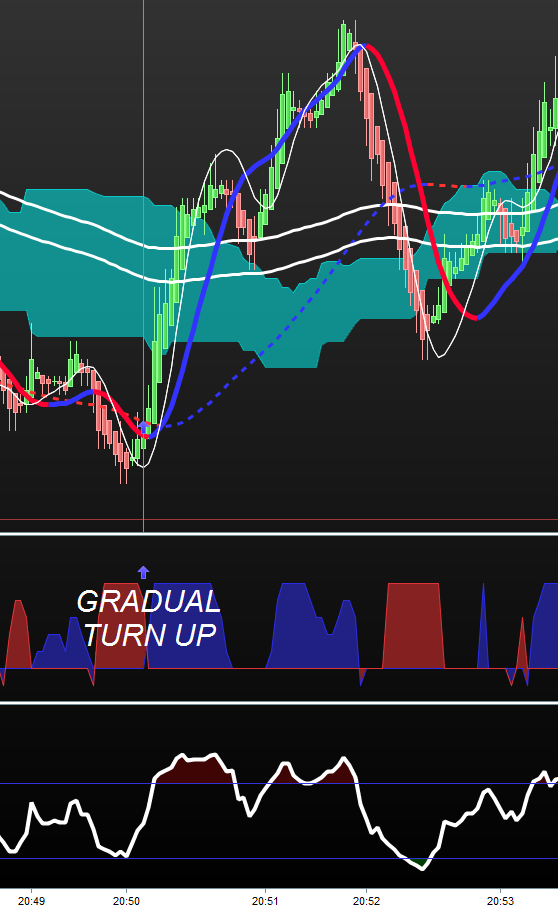
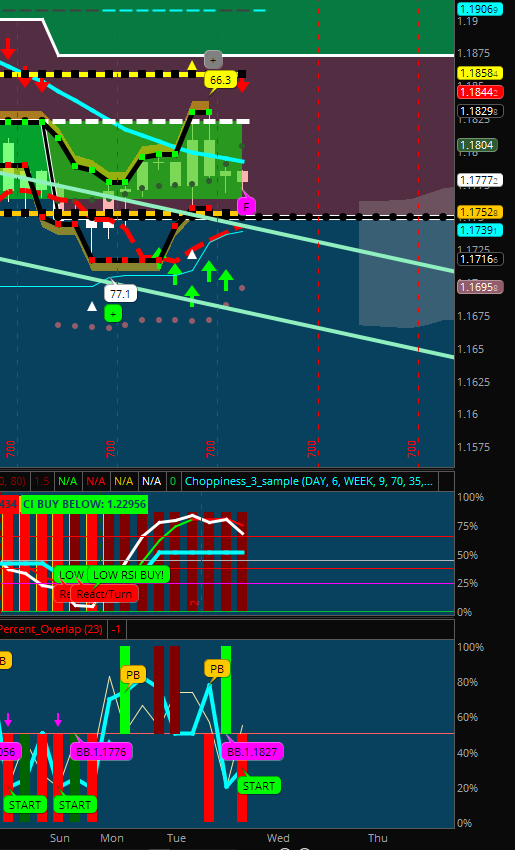
Let’s start with my version of the TTM Squeeze. Empty circles do not cover out the underlying plots.

What’s the latest?
After the 1st of July, 2022 I have but one indicator for sale. The 15-min ATR Continous aka The Range is for Eur/USD trading only and runs on a 15-min chart. The price is $49.

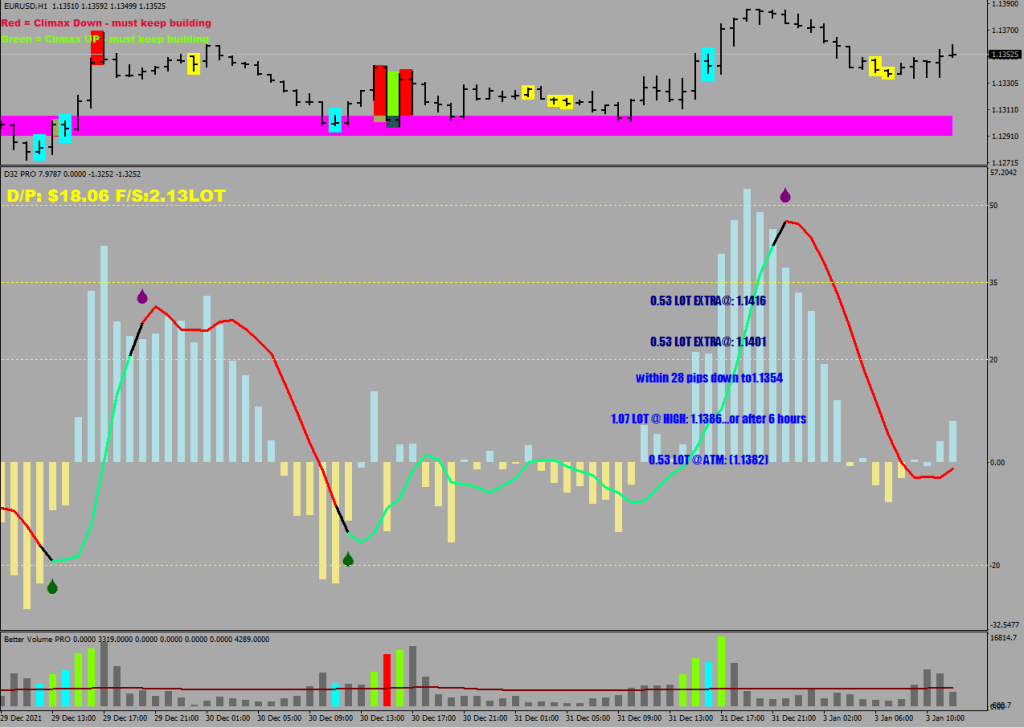
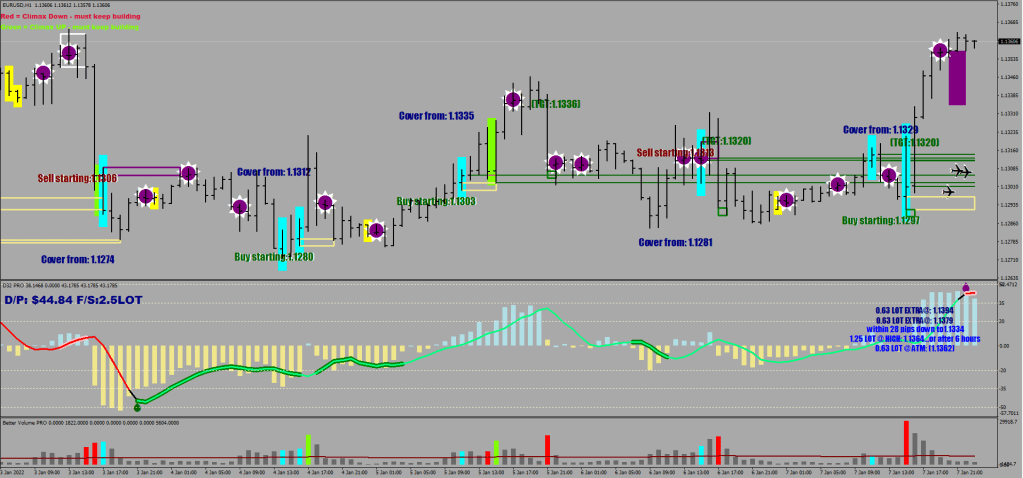
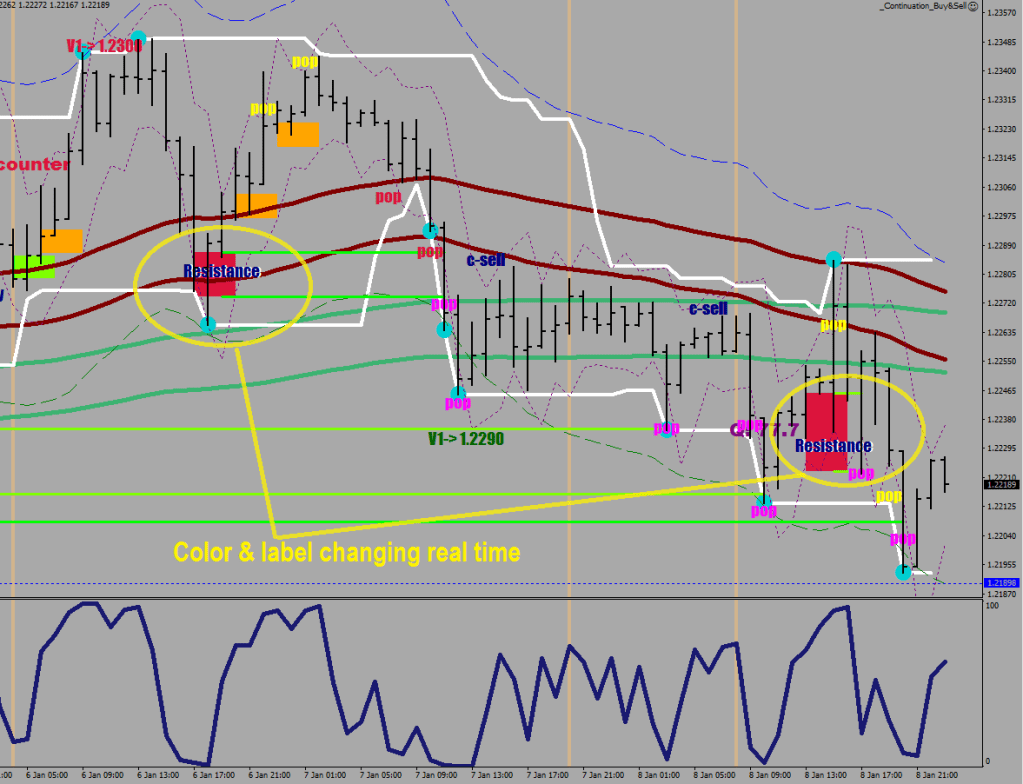
D32PRO V1.4 is conscious of liquidity breaks, has added Supertrend filter as well as negative/positive splitter => the accumulation highlights on the chameleon MA. Better Volume Chart Bars V1.1 received professional volume based reactive volume plays with entry and exit suggestions, real time support/ resistance & current engagement plots.

Cyan = pro volume, Yellow = amateur volume, Magenta = extra high volume

Practical usage of MFI and Volume example:
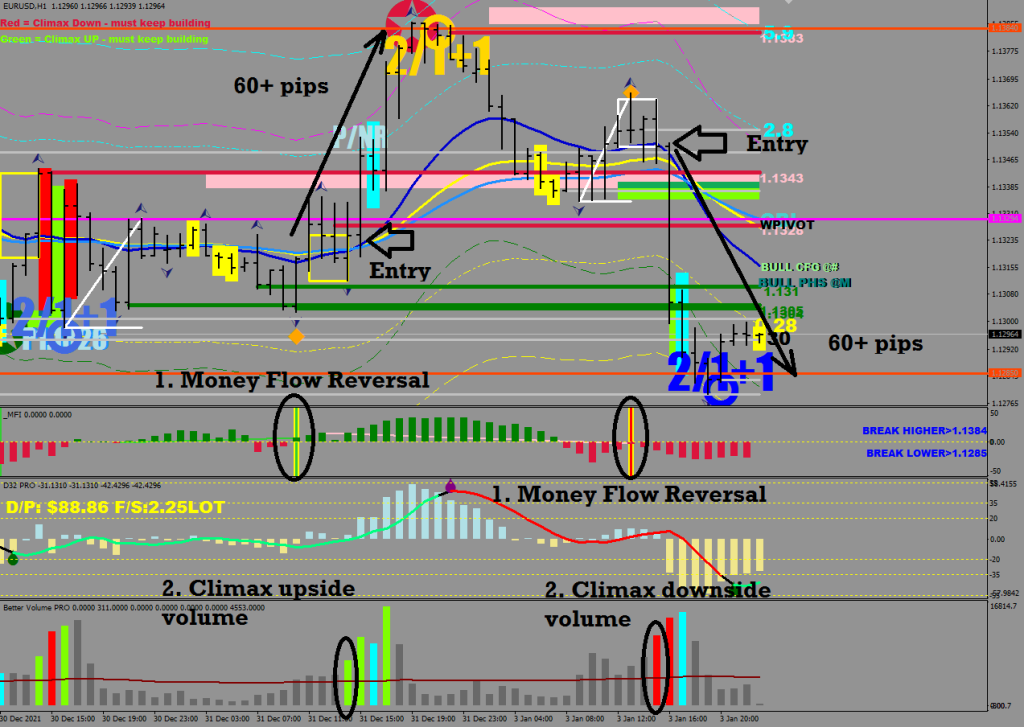

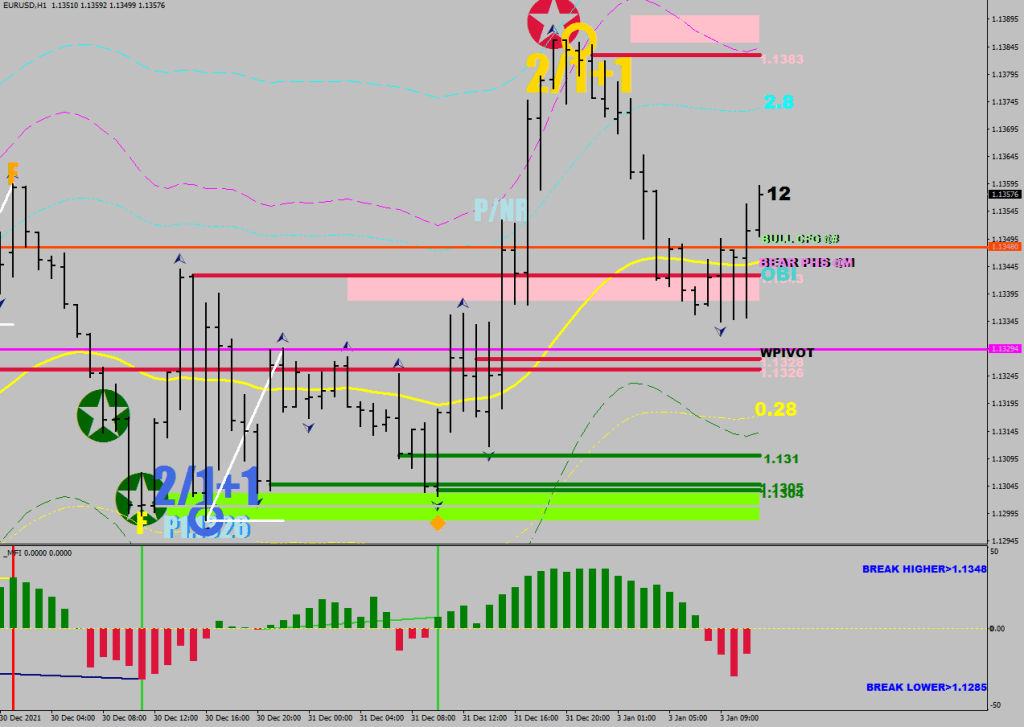
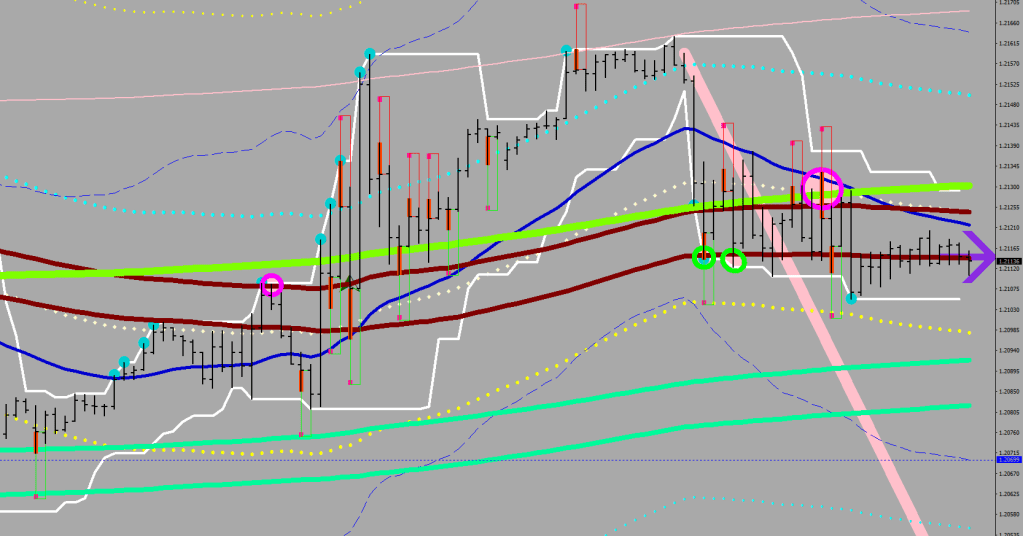
The Swiss-Army Knife version of Nick (called Rhodes) has auto level plots: combined daily exhaustion levels and hourly tough cookies and some recent swing low / high for good measure & highlight on those that are the closest to the 3-day ATR from the last consolidation weight.

Nick Rhodes by now the smartest, all encompassing indicator with automatic M-Axis plots, trend line cross over sensing and limitless abilities.
Quarter Lines – with the implementation of the push away the mountain plot, now in full color to suggest reactions even for an embedded market.

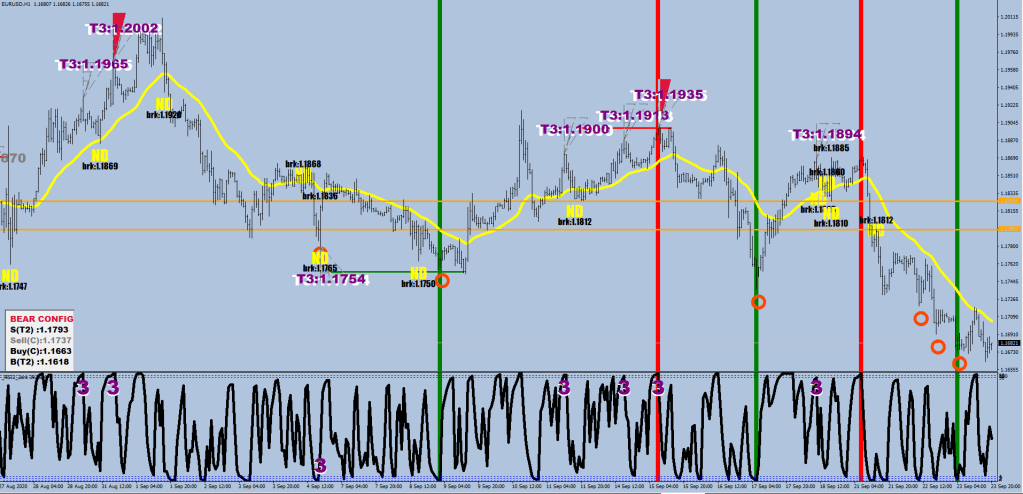
The Candle Fabricator has some rules about what values to plug in for the last two fabricated weekly candles. There is a current weekly candle option, but the main feature is the Don’t Come Back Levels. Play the color of the last fabricated candle via stop entries at the levels sorted for the current week ahead of time after having been exceeded sparing most or all of the draw down. Add to the position at the next level in line. See blog entry for more.


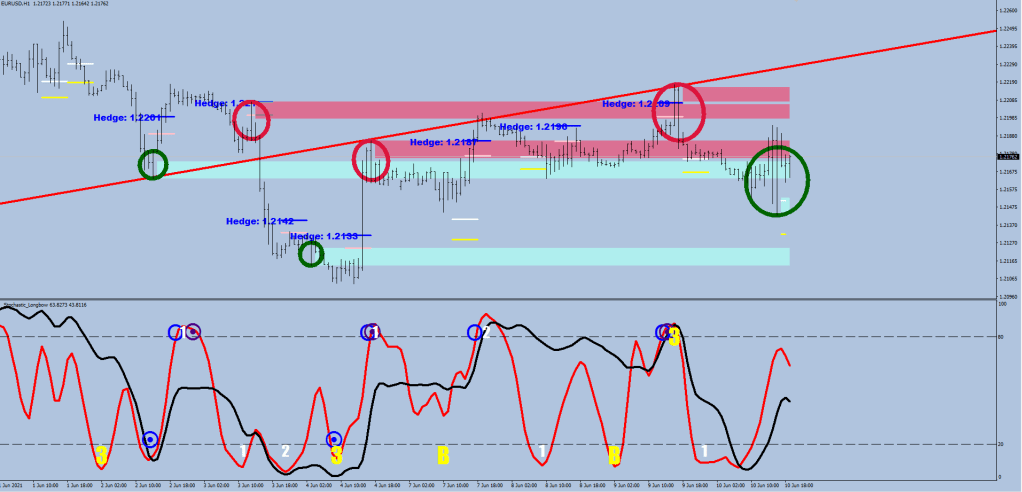
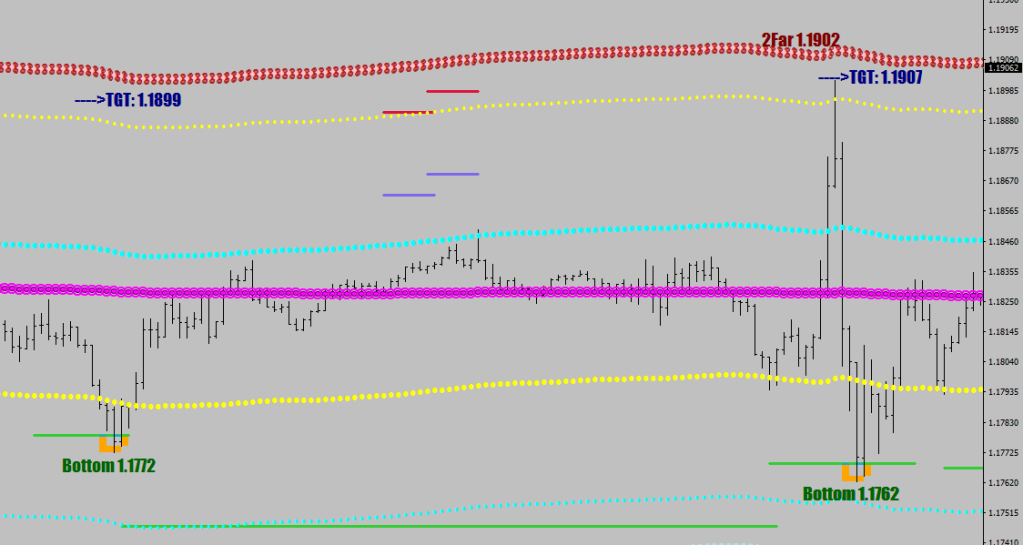
Current goodies of the Stochastic Longbow include taking a stab at figuring out the wave count, it plots hedge levels and support/resistance zones.


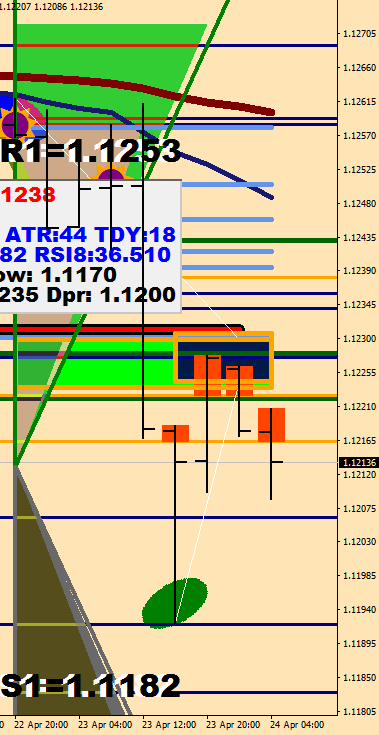
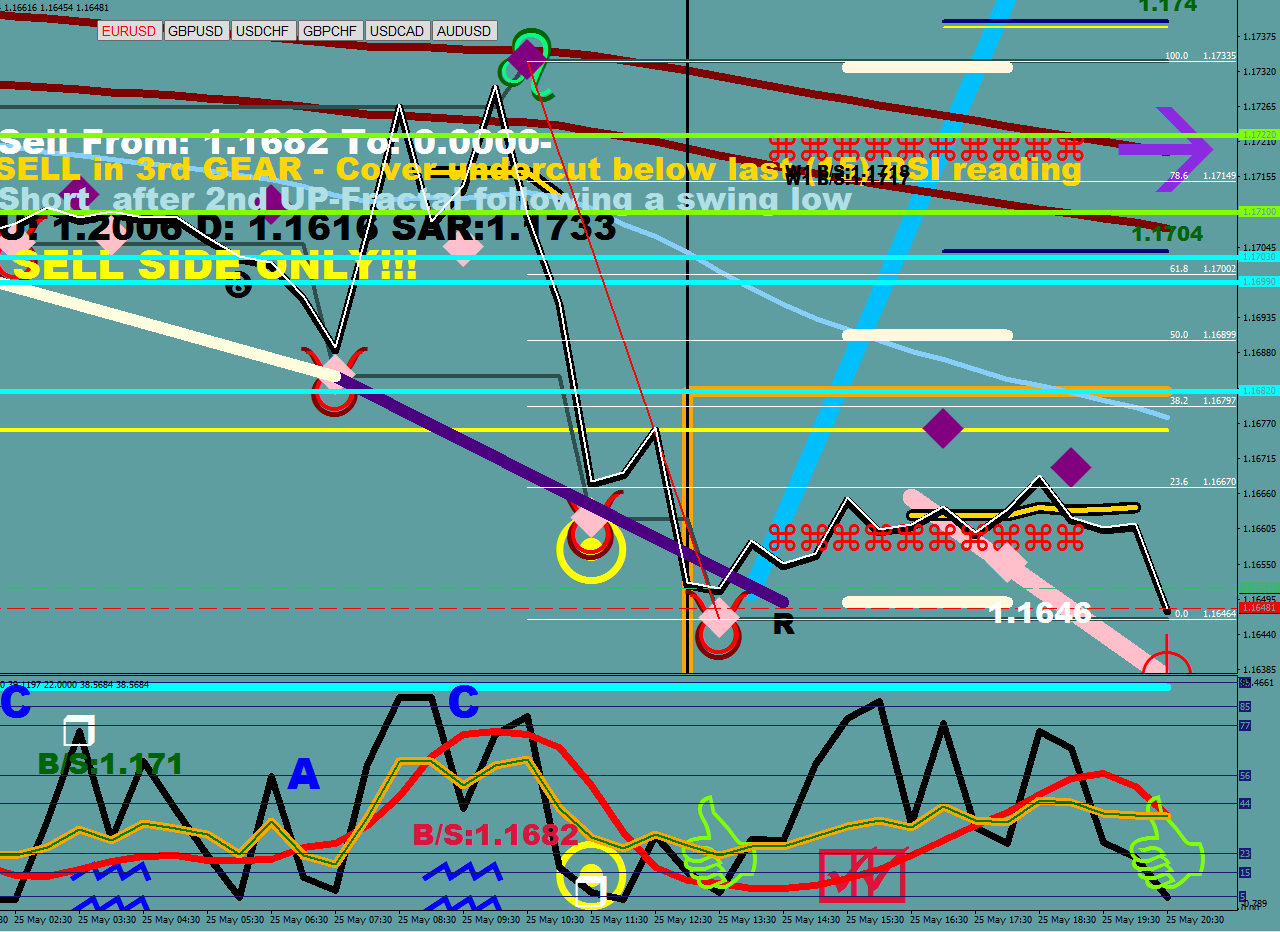
The first RSI2>82 is a sell after a hammer & spanner on the red (RED SELL)
The first RSI2<18 is a buy after a hammer & spanner on the green (GREEN BUY) – routine: Catcher in the Knife


CI Moat – available.


…
…
…
…
…
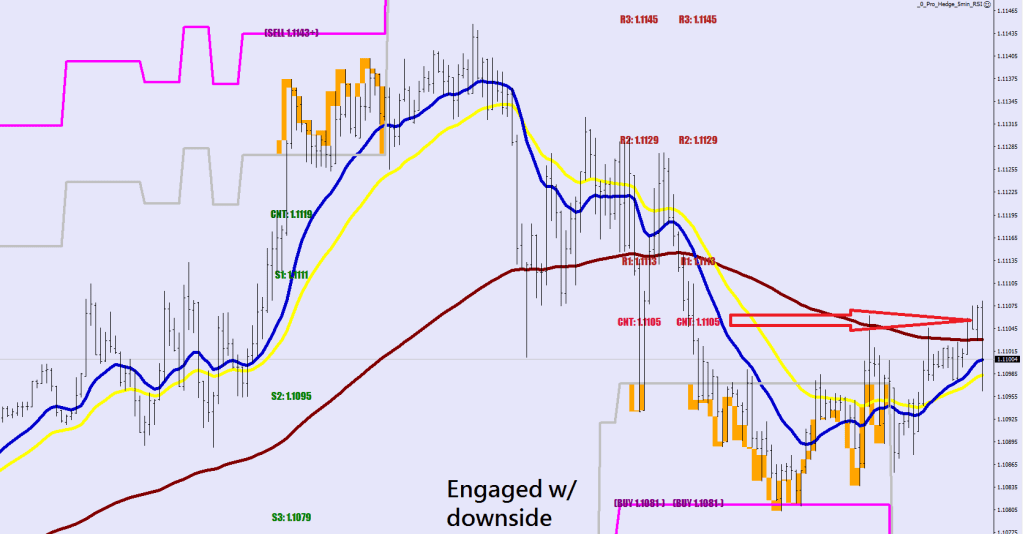
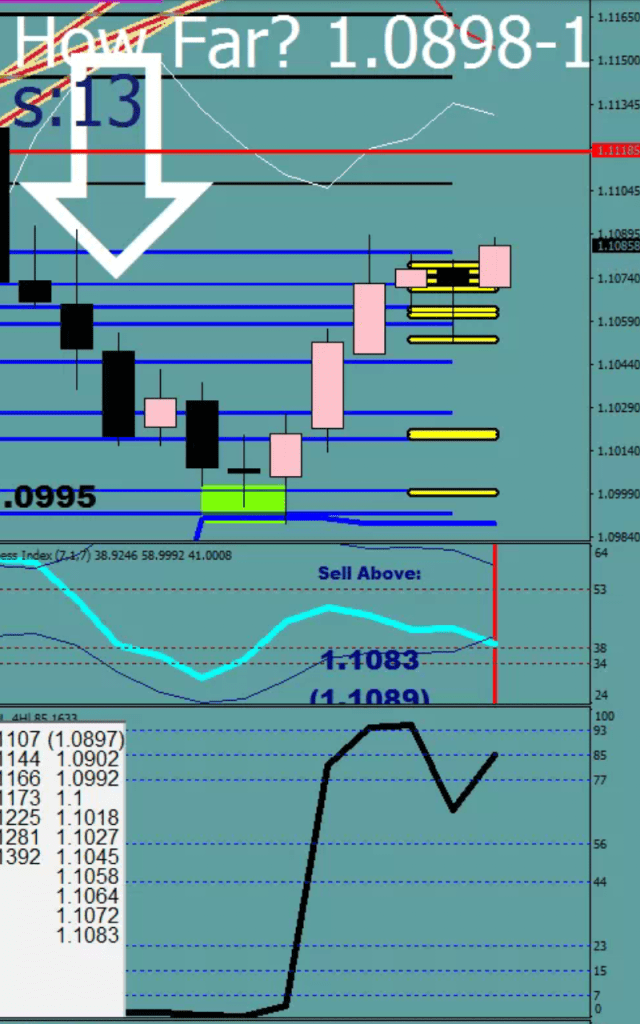
Eshocks to the downside

…
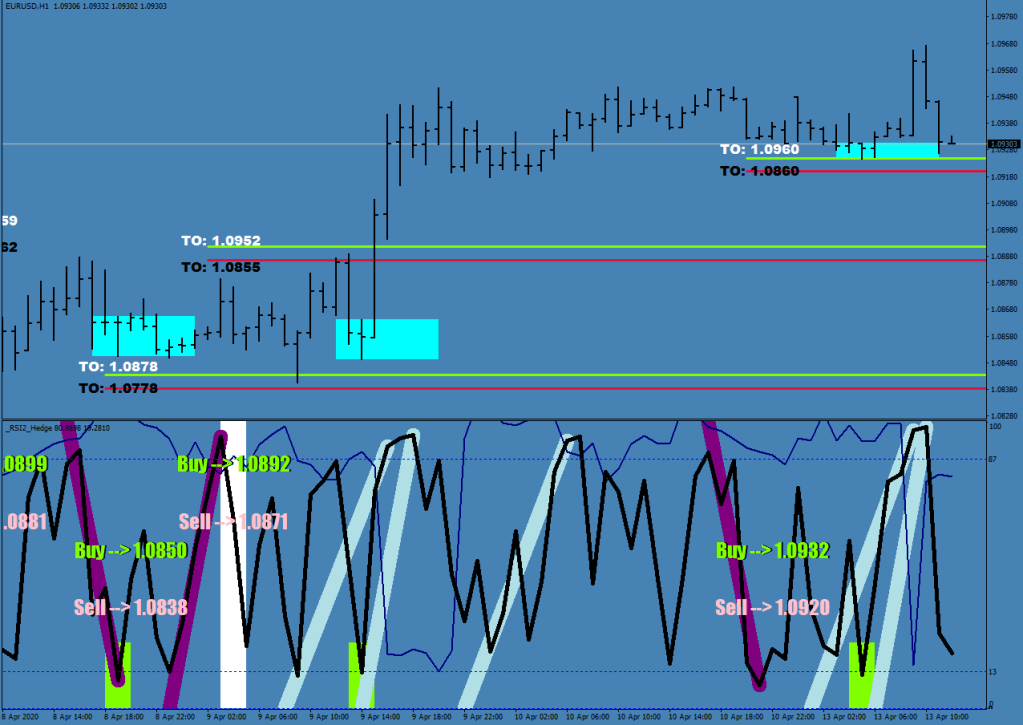
Donate something and get RSI2 Hedge for outstanding trading signals.
…
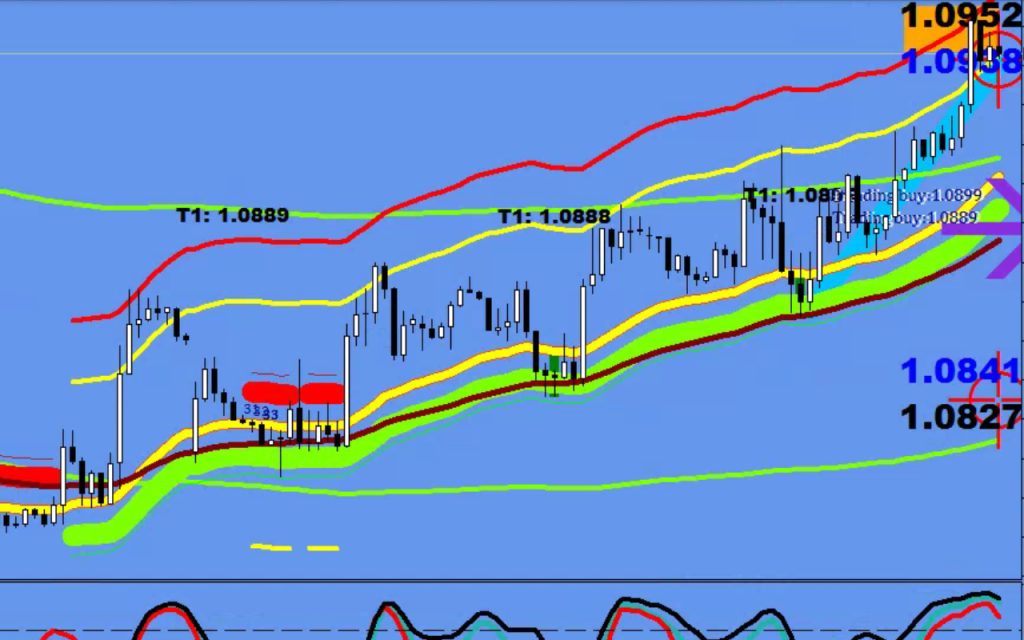
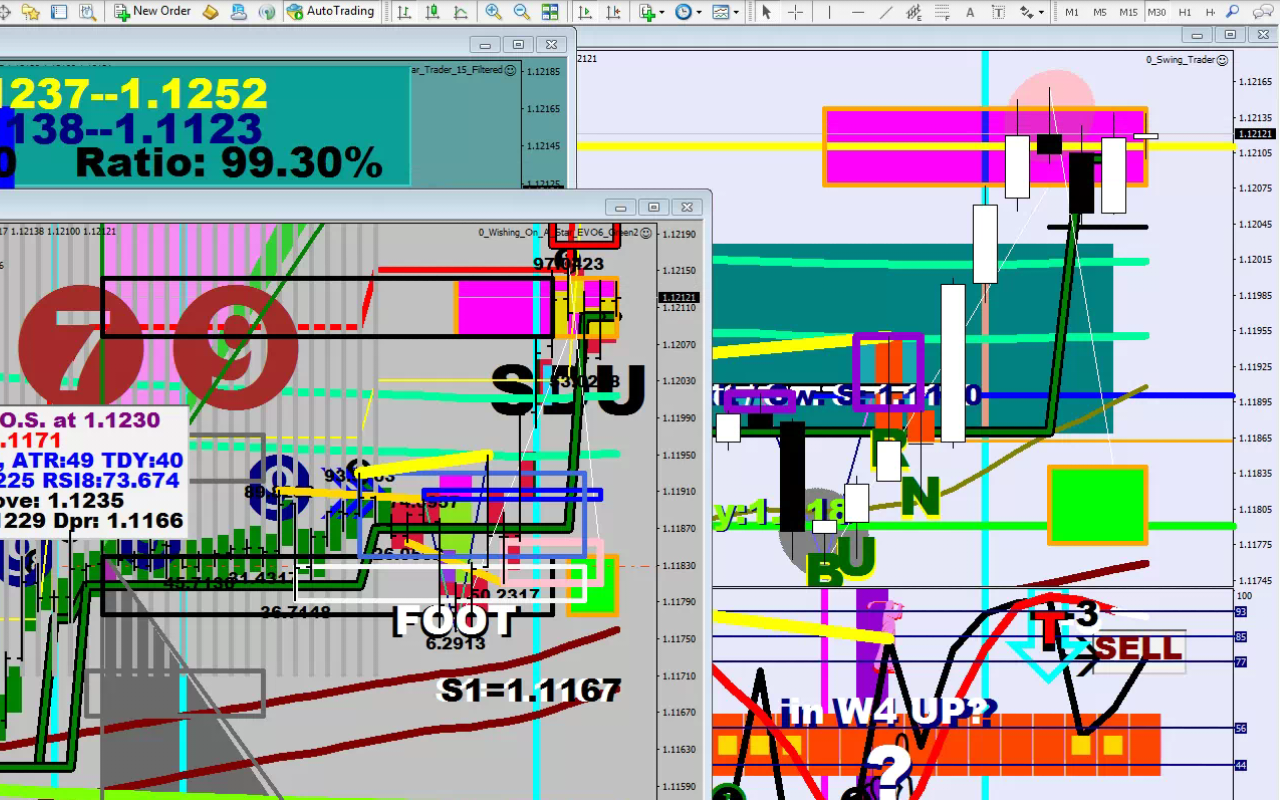
Such a perfect trade…
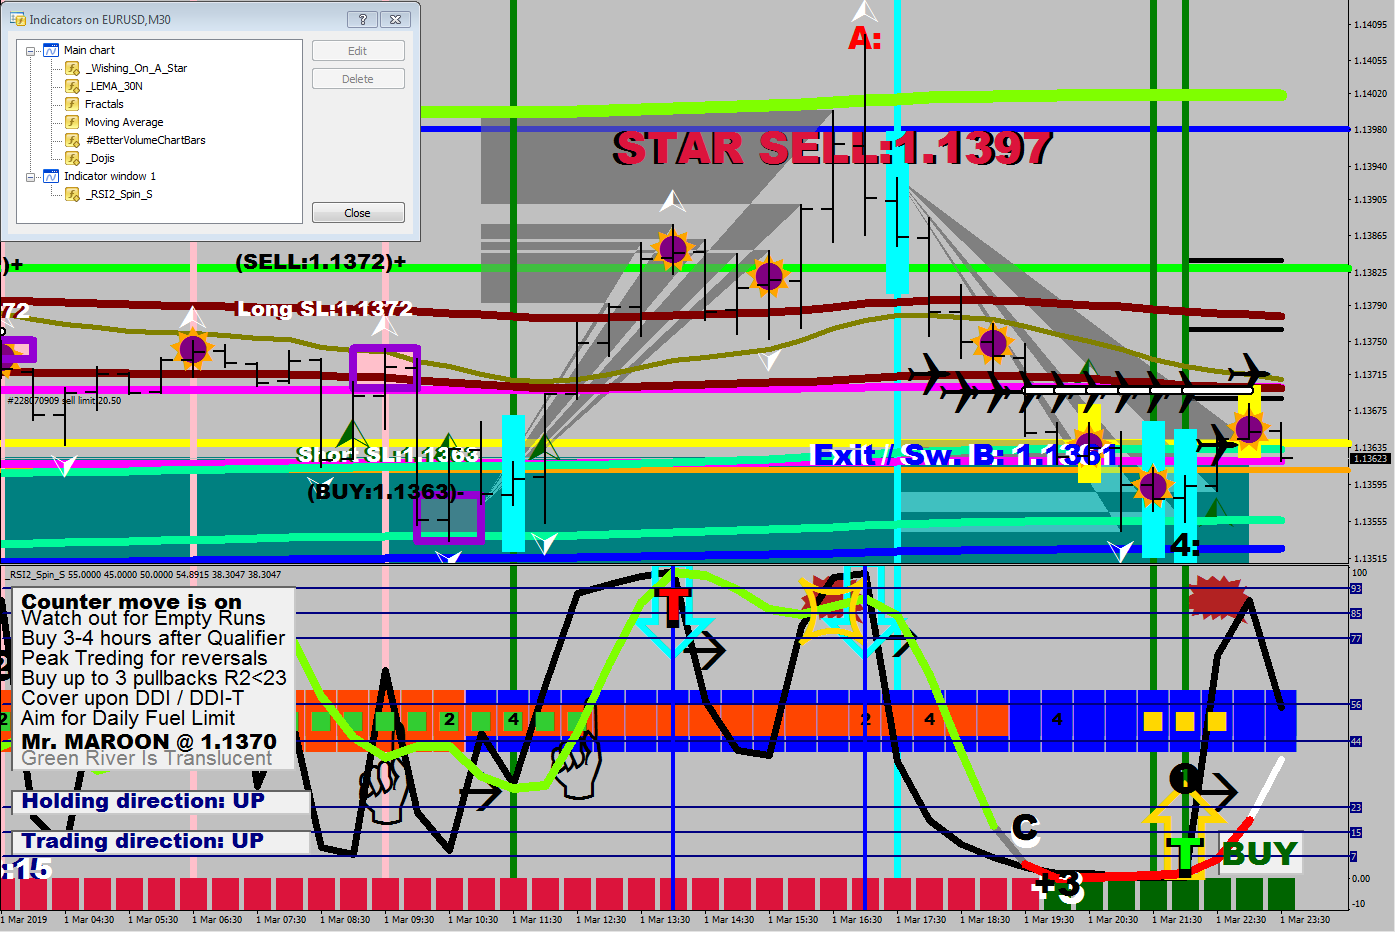
My Maroon Attack and Fractal Switch indicators both called attention to this trade.
If you got in with a total of 1 Lot, the potential was $450+ in less than 3 hours this morning.

Don’t you think you should be obtaining a copy from me for a donation of your choice to Macdulio@yahoo.com ?
…
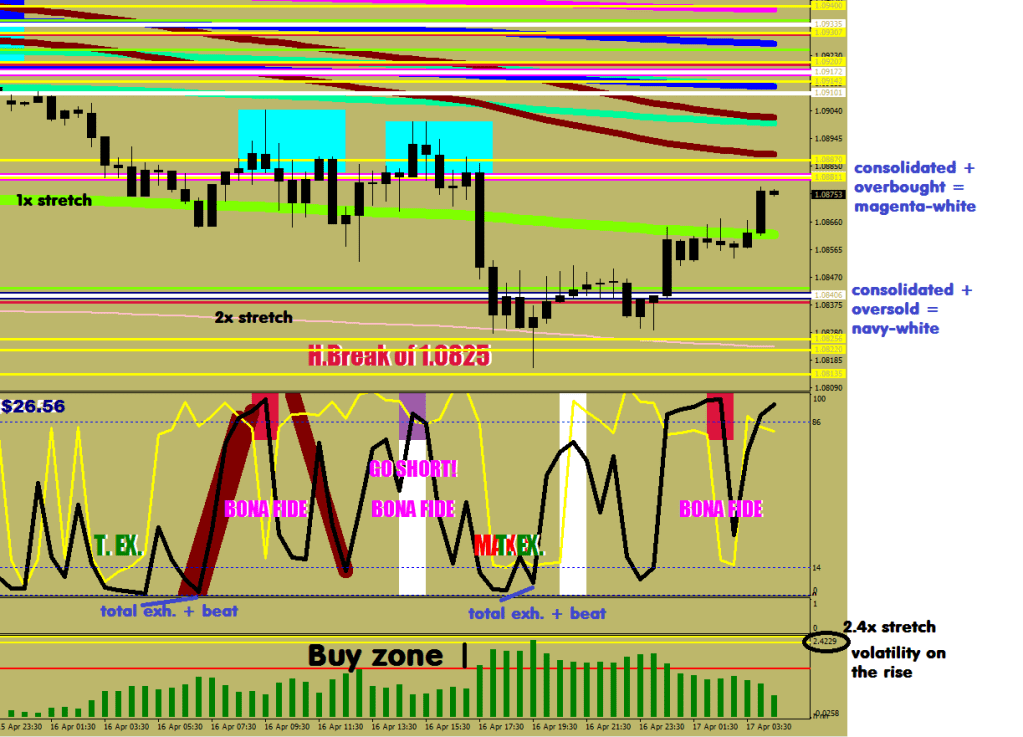
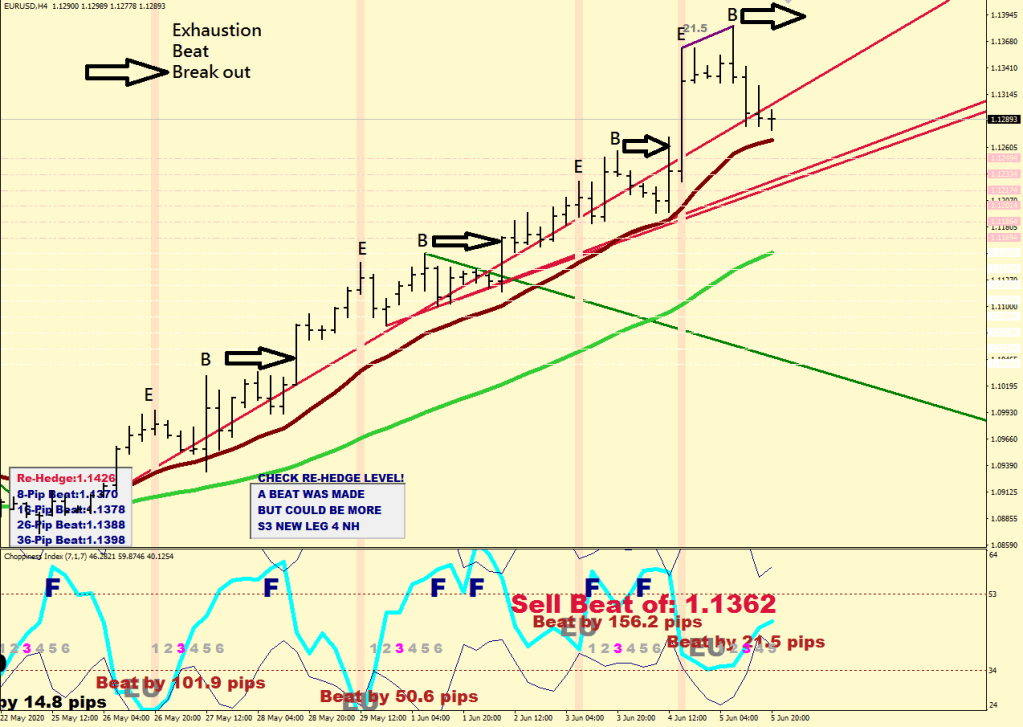
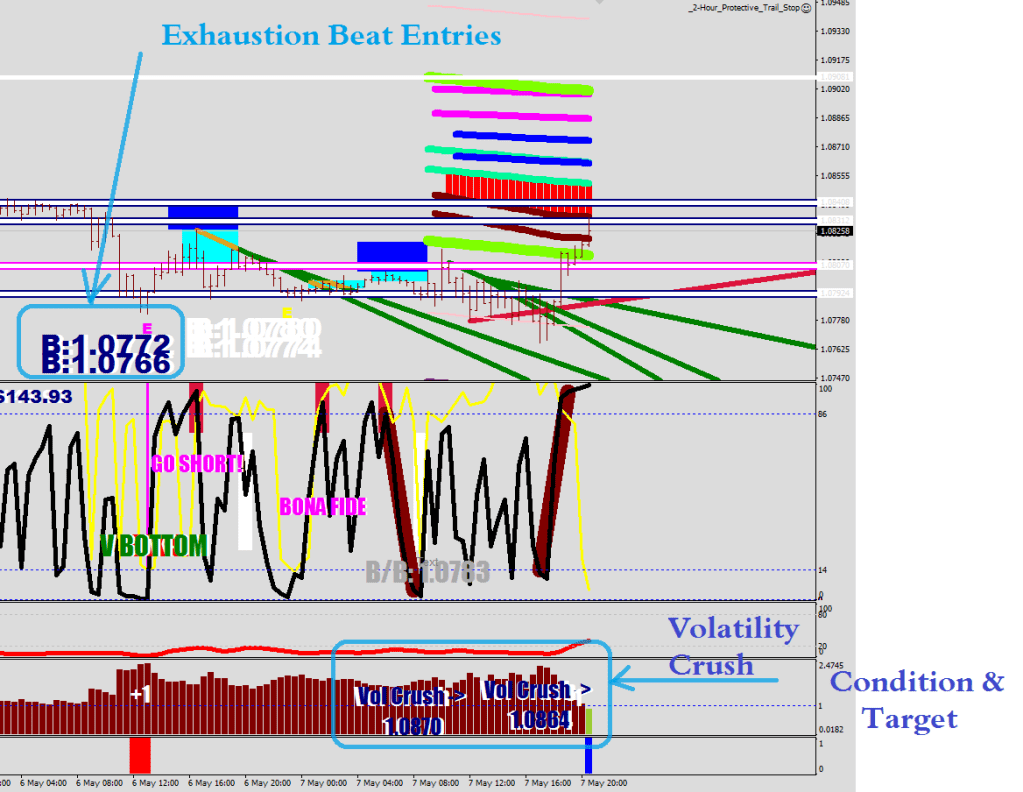
Exhaustion – beat – action – suggestions
…
…
…

…
From the 1st of August, 2020
….

…

…
…
…


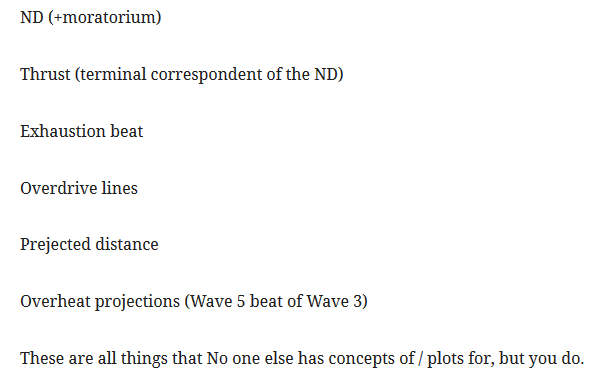
When you know what to plot, all of a sudden everything starts to make more sense.

The highest level of intelligence is being able to answer a question that no one can even phrase correctly.
You are welcome!

…
Crossing over

…

…
My latest idea is to become a solutions provider: grow a mustache and get a “A. Dent” license plate in front of my red NSX.
Following these, since I have made every indicator I would ever need (anyone could probably use one or two of them), I would start to make them available one by one along with the EAs I’m trading (i.e. my trail stop) with for little cash.
I’m thinking a unique number for every one of them, mostly around $20, some extra stuff, like the Energy Bands I would give you a copy of for $49.
The numbers are up for debate, and they do not include the sources, only the EX4s.
Heck, I could enlist several dozen auto trading routines (these with source also) for $25 and up.
Let me know what you think on my yahoo email address.
Macdulio, of course.
…
…
Think about the following riddle for a while, and come back to me with an answer.
-0, +8, -12, -8, +4, -4, +0, -12
…
Currently working on a Full Lambda Auto Trendlines routine (instrument independent).

Would you care to buy one say for $19.99?


This is starting to be one of the best indicators ever made. Did I say 19.99? What a deal!
…

…

…
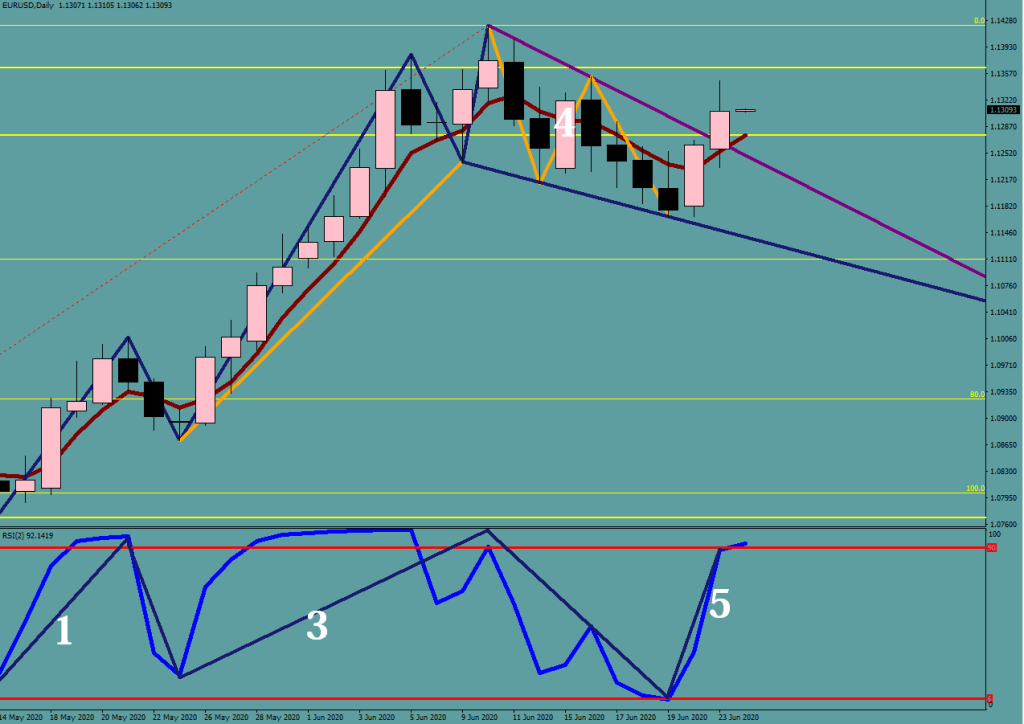
Why was this a terminal wave 5? Because this was a 16-pip failure of the 3rd Wave.


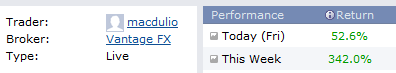
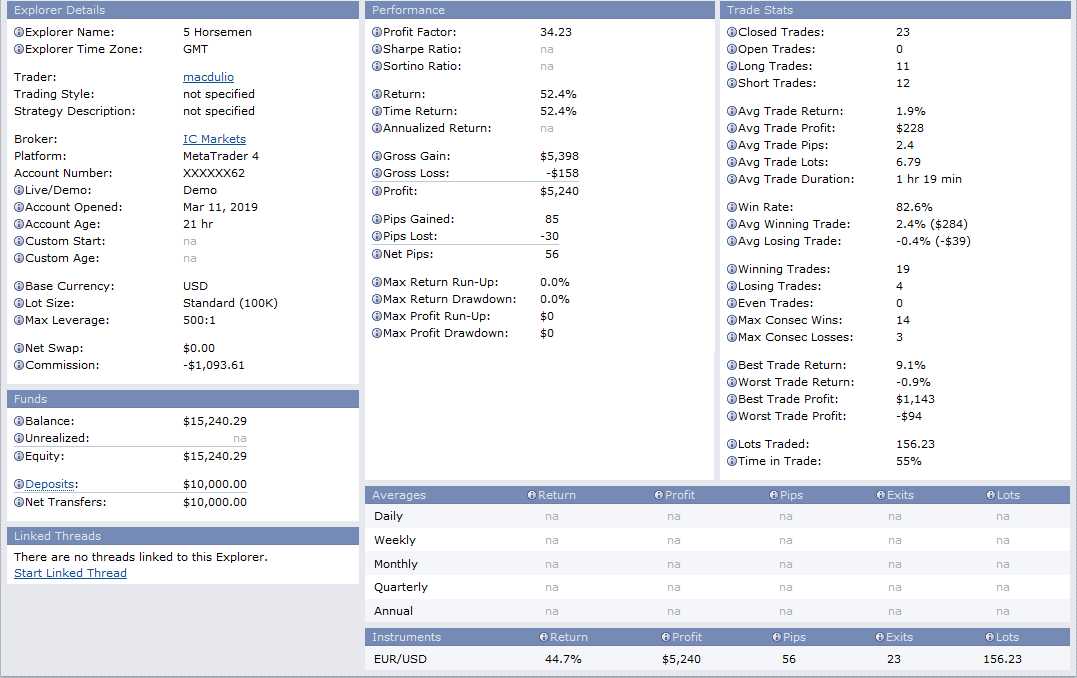
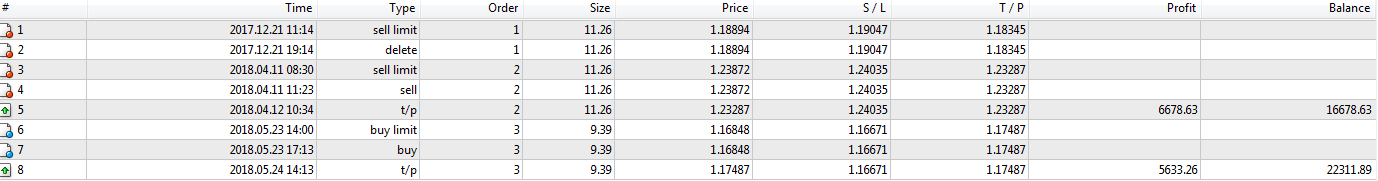
Careful with scammers people, MyFxBook stats can be doctored.
After I pointed out the issue of the negative Absolute gain>

…mr Bloodsucker took care of the necessary change.
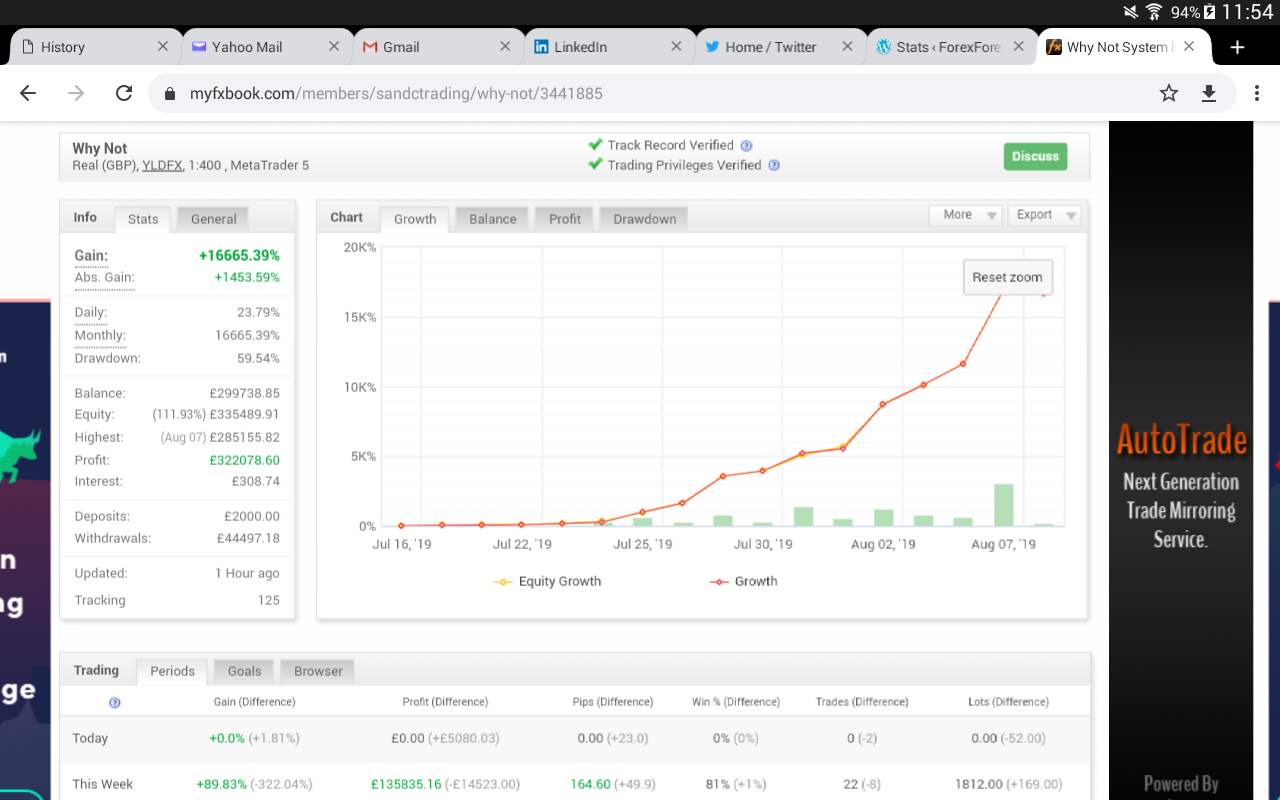
He did not however to date has changed the entry (perhaps was unable to) that is missing from the video statement but is there on MyFx: the 4.2 pips stop out that miracleously ended up with gains.

I think he made a promise that if he reaches 1 million GBP profits, since he won’t be needing as much money, he would give 10% discount from his hoax, useless junk software. In the meantime he would be showing you cars and feel free to purchase from his mechandise on YouTube (shirts, mugs etc)
Now, to relax before we get a heart attack, we get to shoot a lot of scammers.
I made these two game modifications
back in 1995, because I’m that old. They run with the zdoom.exe (in the folder) on just about any PC.
You find level change, god mode and other cheats here:
Also, I have made a number of Sound Patches for these dooms (i.e. Heretic Sound). You can copy them into the downloaded doom’s folder and parameter ZDoom with it.
i.e.:
>zdoom.exe HERESND.WAD HORROR.WAD SEE.WAD
(in Total Commander) you can use CTRL+ENTER on these files
just remember, if they overwrite the same sound, the last one in the list would come out on top
…
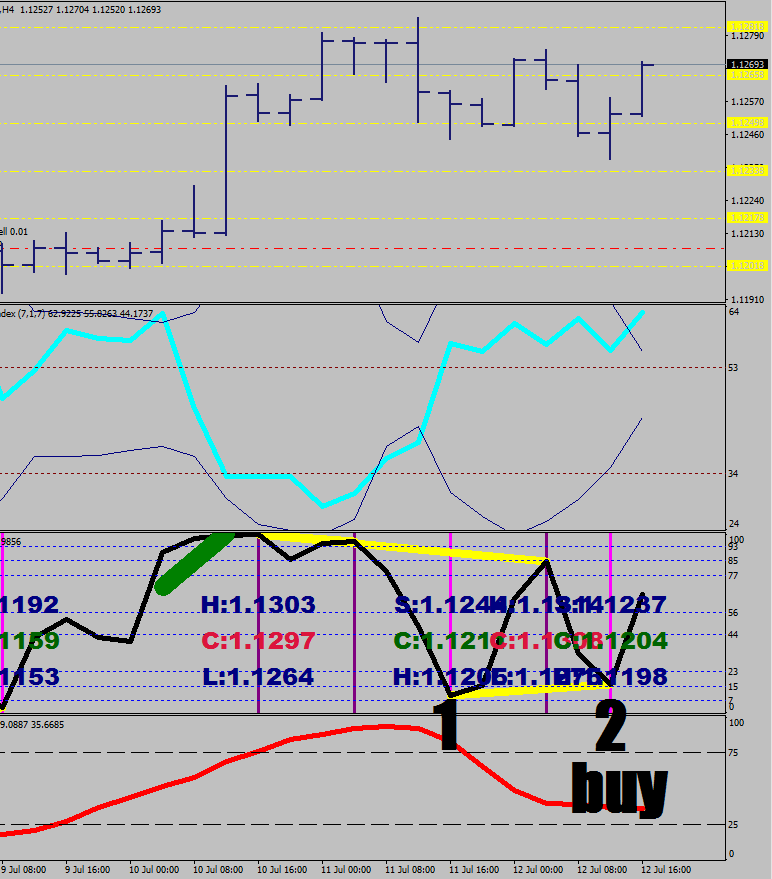
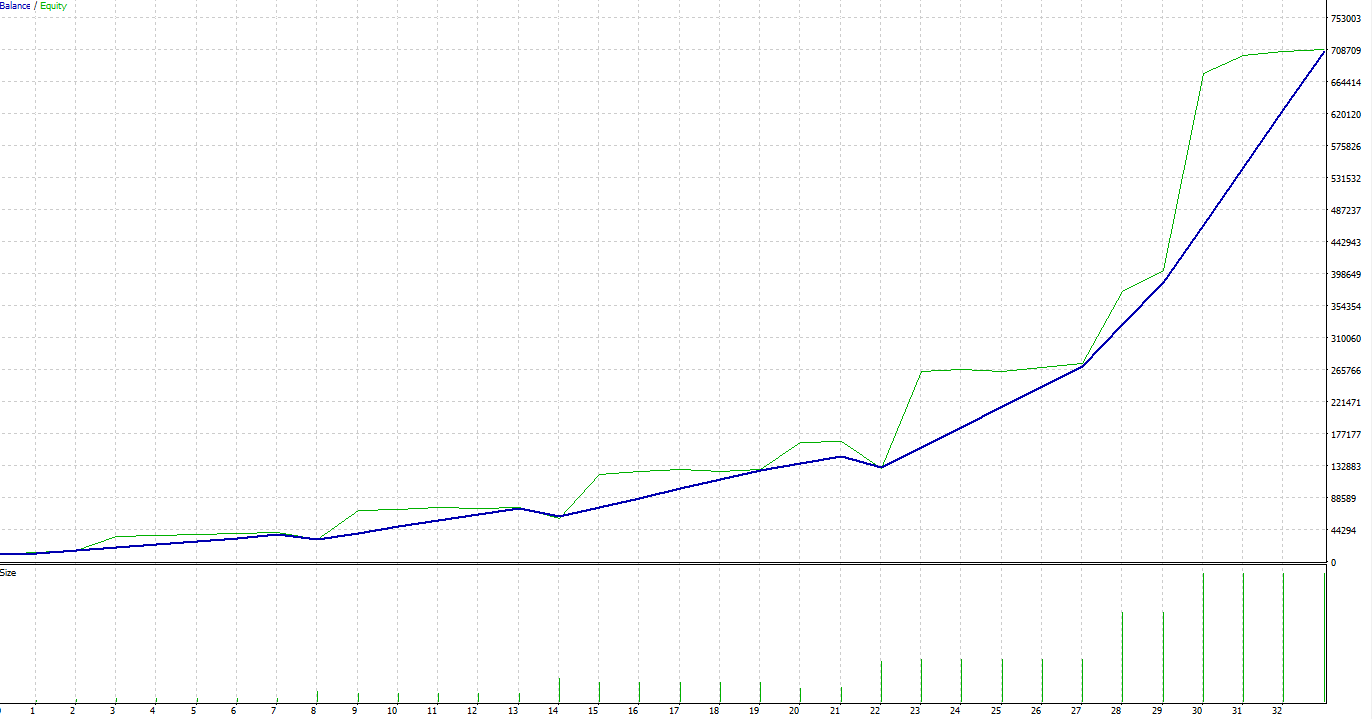
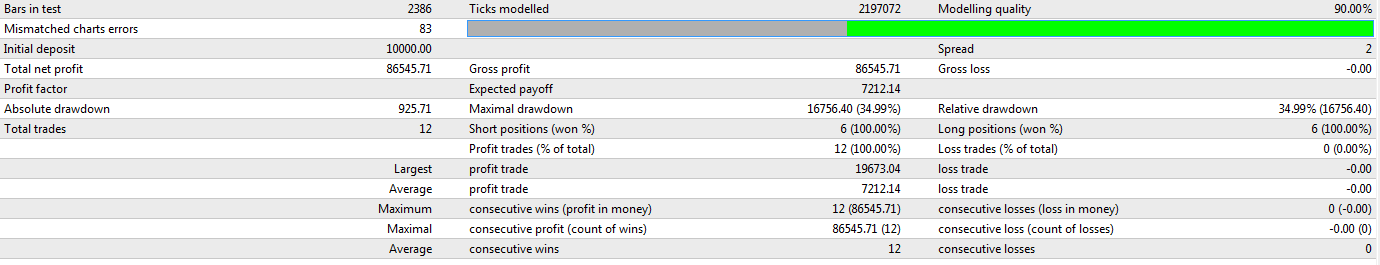
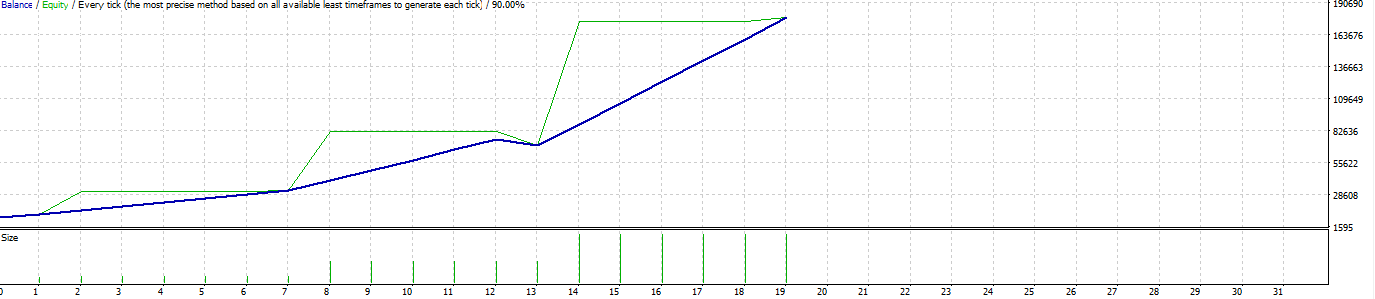
The week in numbers. 3-mont trial run kicks off with 0.18% maximum draw down.

How did I do with high leverage on my live account at the same time?
Volatility breach
RECONNECT

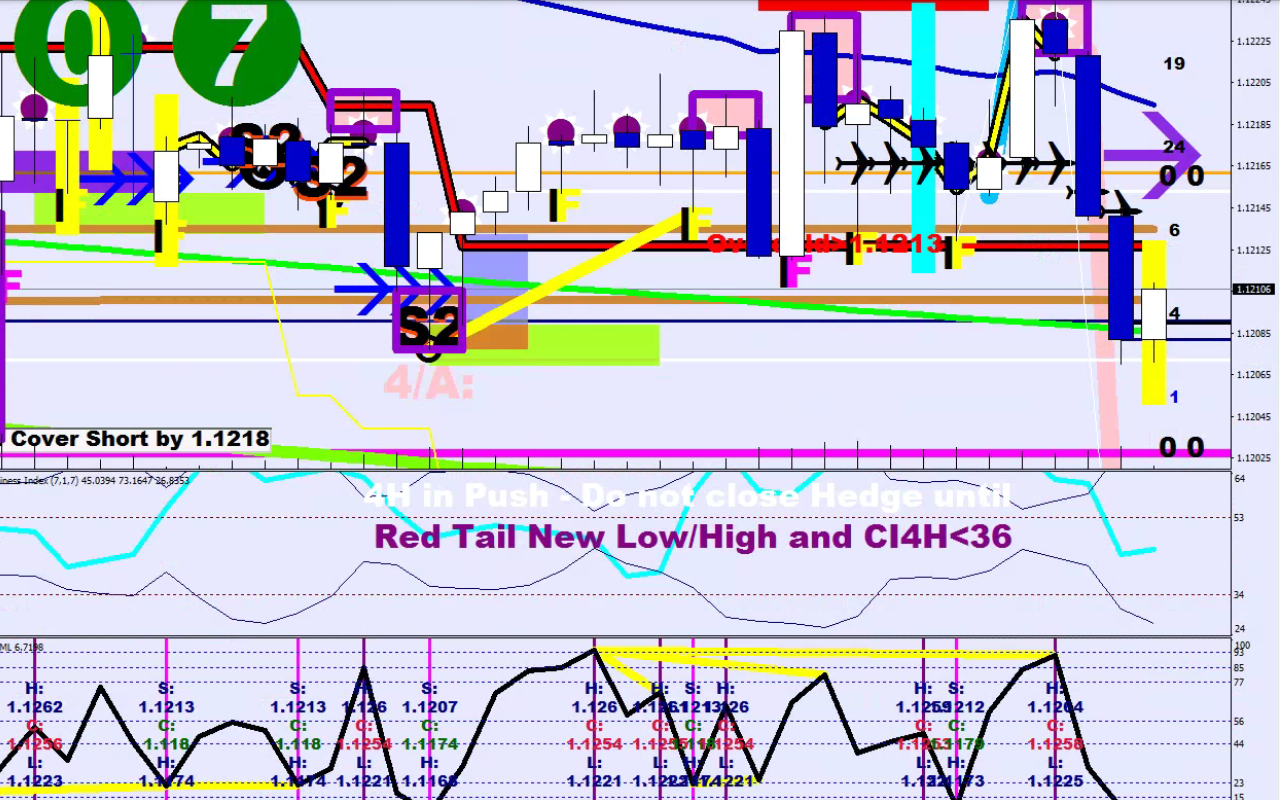
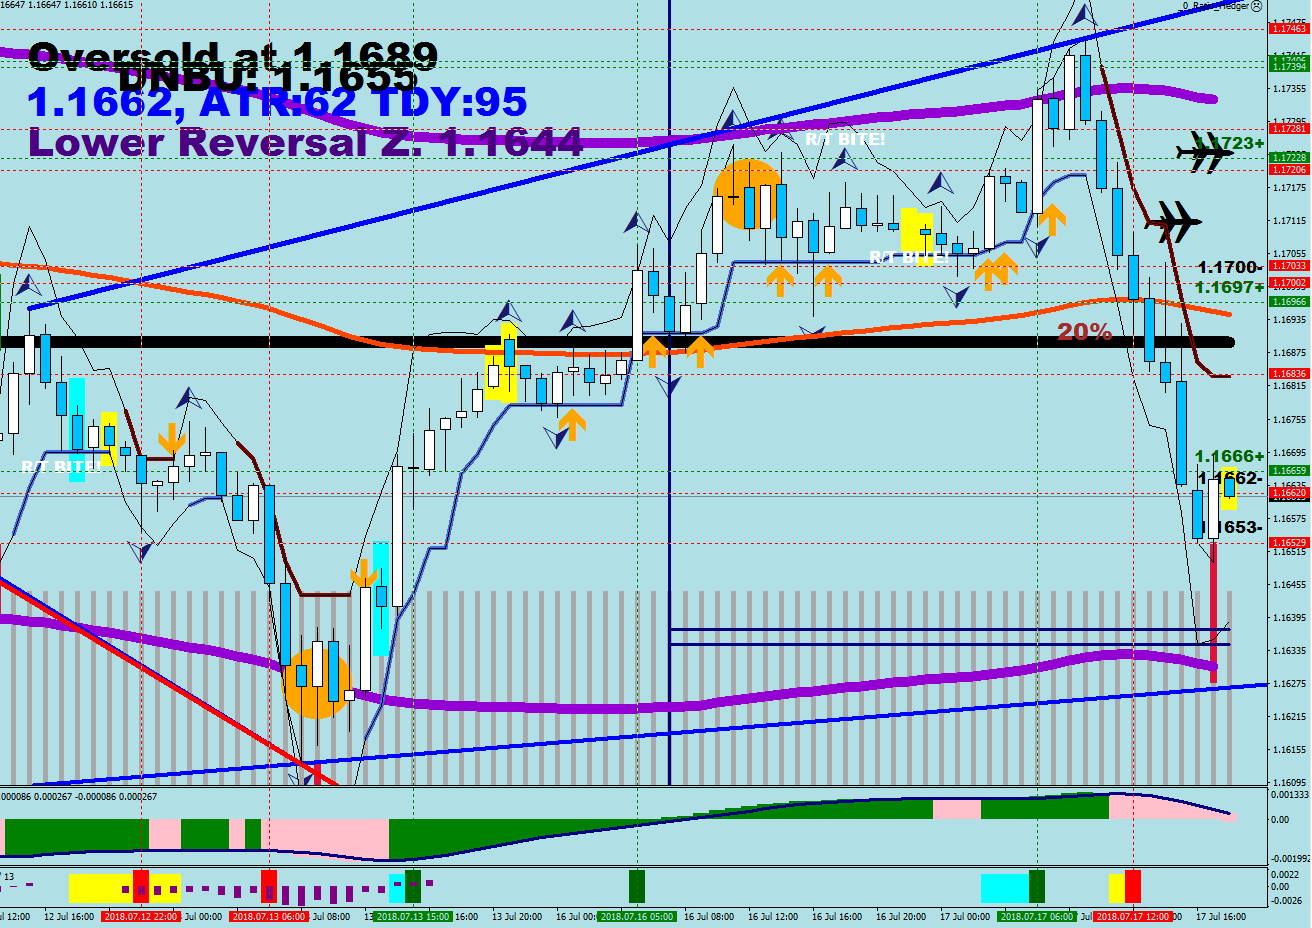
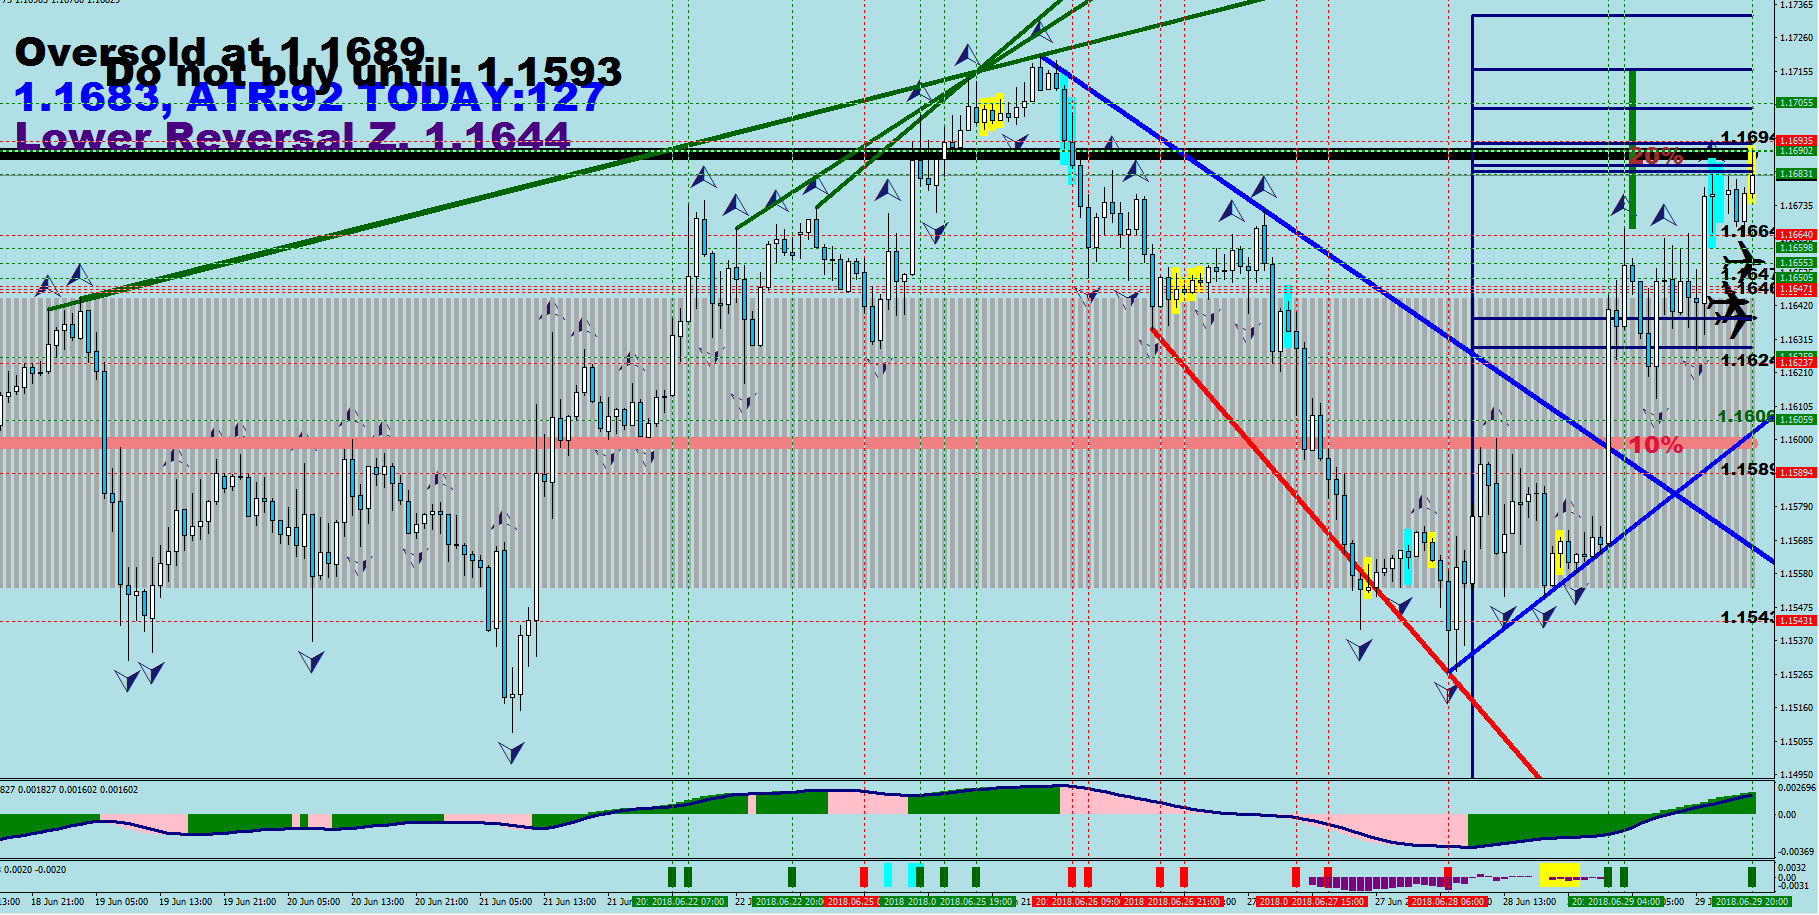
Red tail, lower low, RSI2 divergence in Bear Zone 1 and the Volatility Whip is about to be violated on the upside.

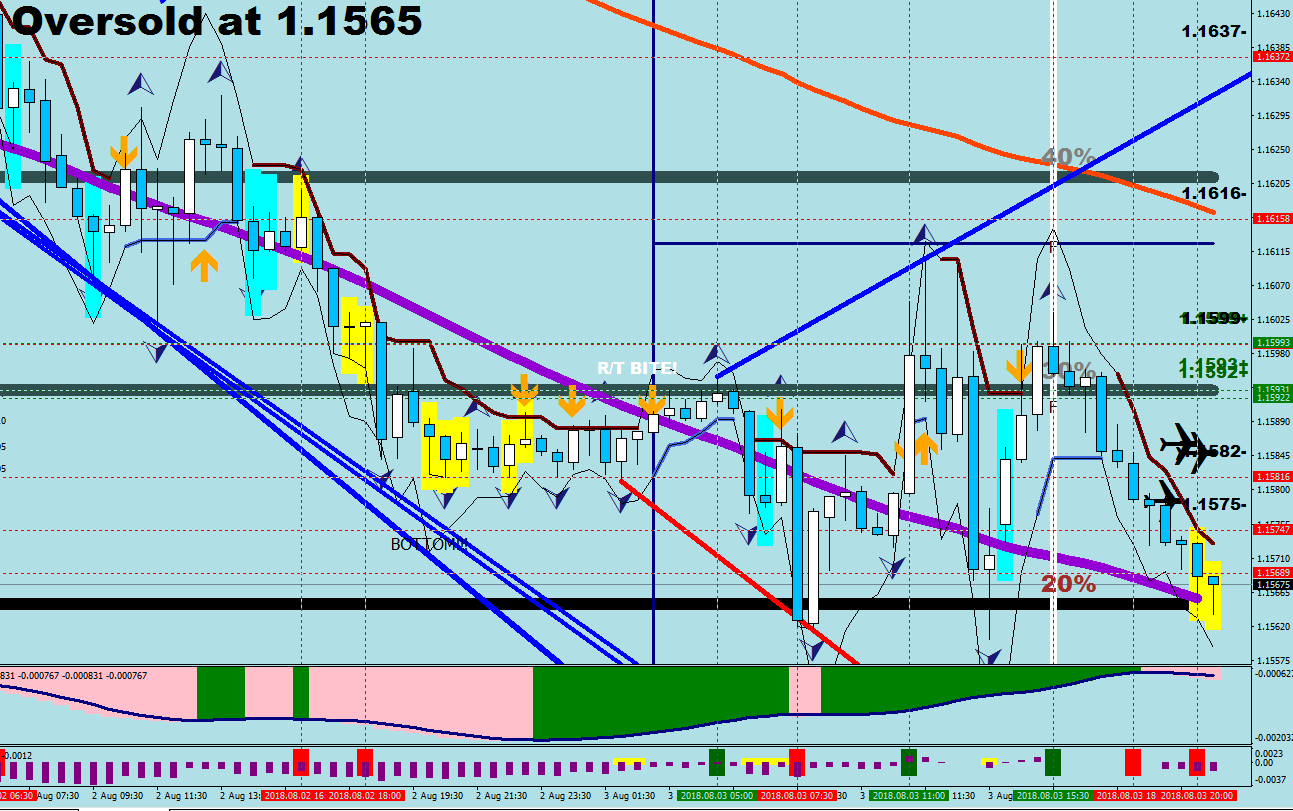
As it turns out, Acapulco is located at the oversold neckline (20%).


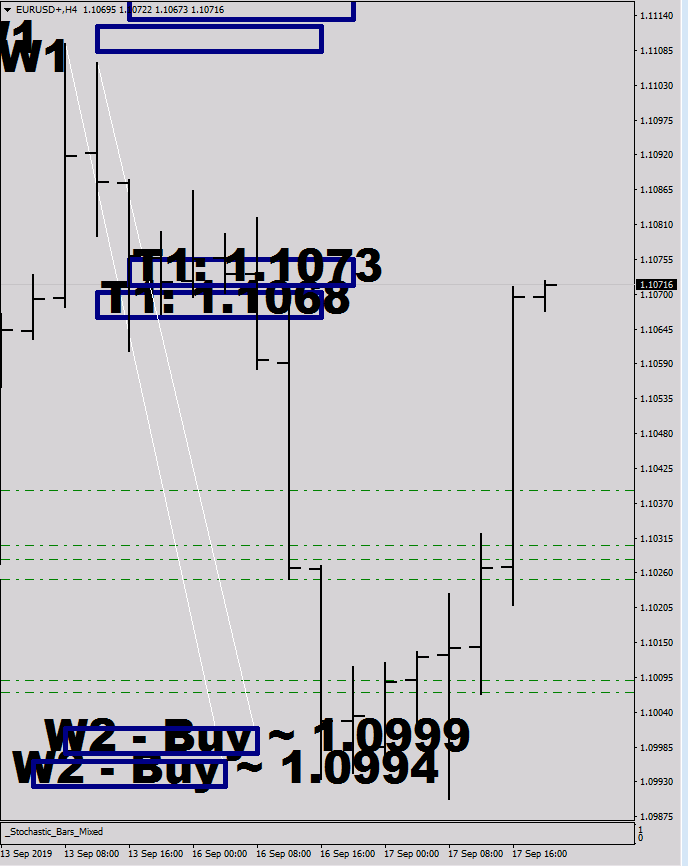
This week’s performance as of 21/9/19

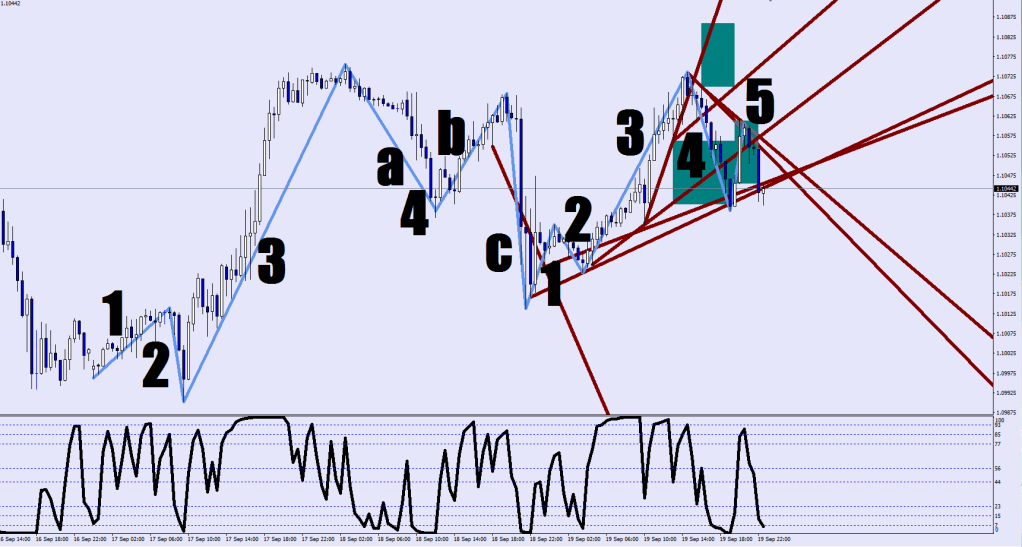
Like I said, W2 finder is a thing.
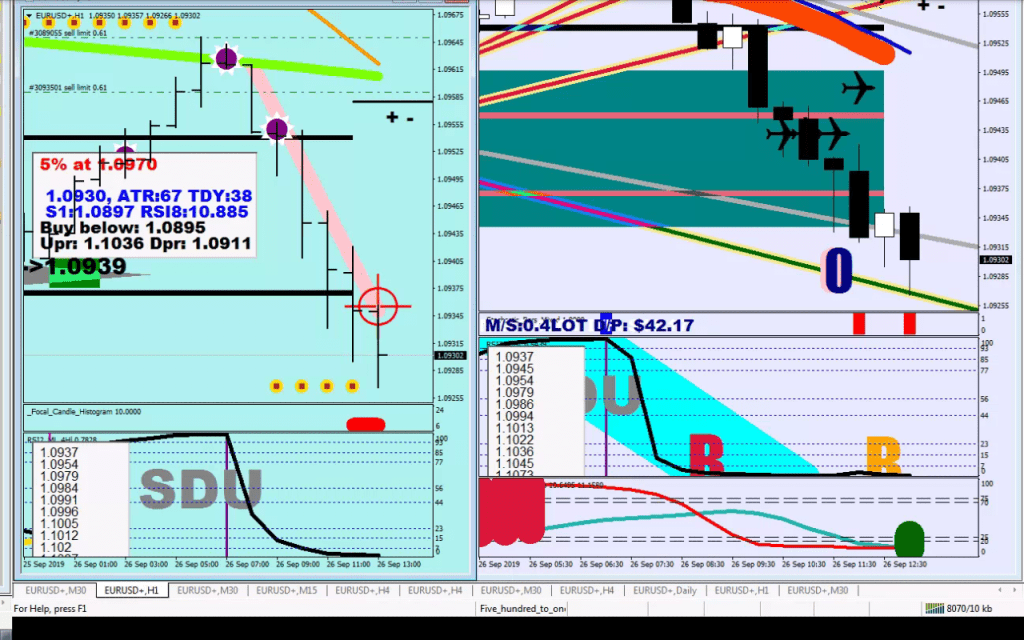
What can there be said about the daily fuel limits today? That they both were hit within 30 minutes.

Fading market outer limit projections (brownie points) fluctuation – failed break distance away from prior swing


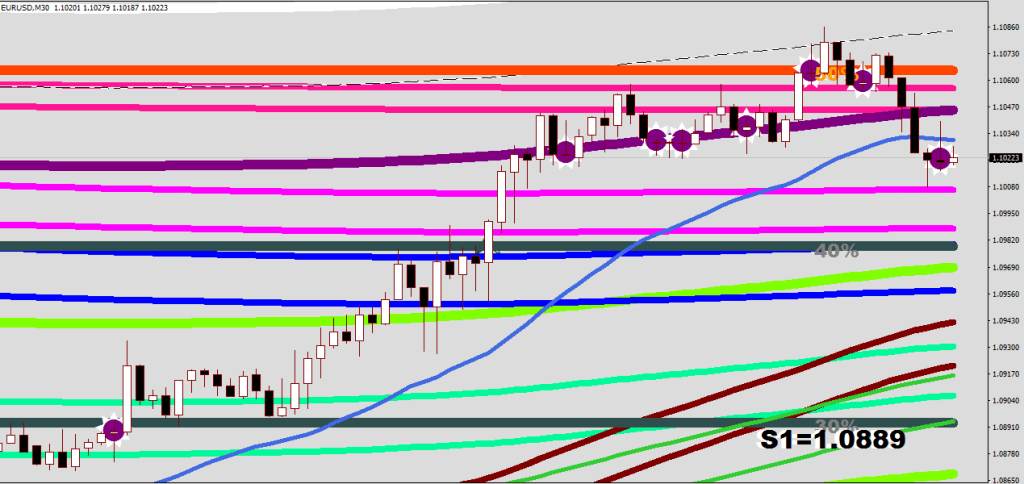
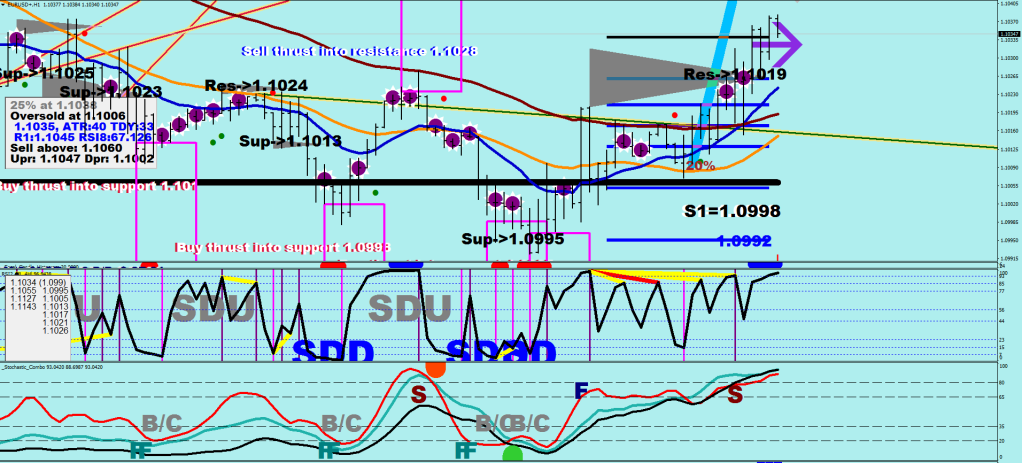
Show me the meaning of thrusting into support/resistance.
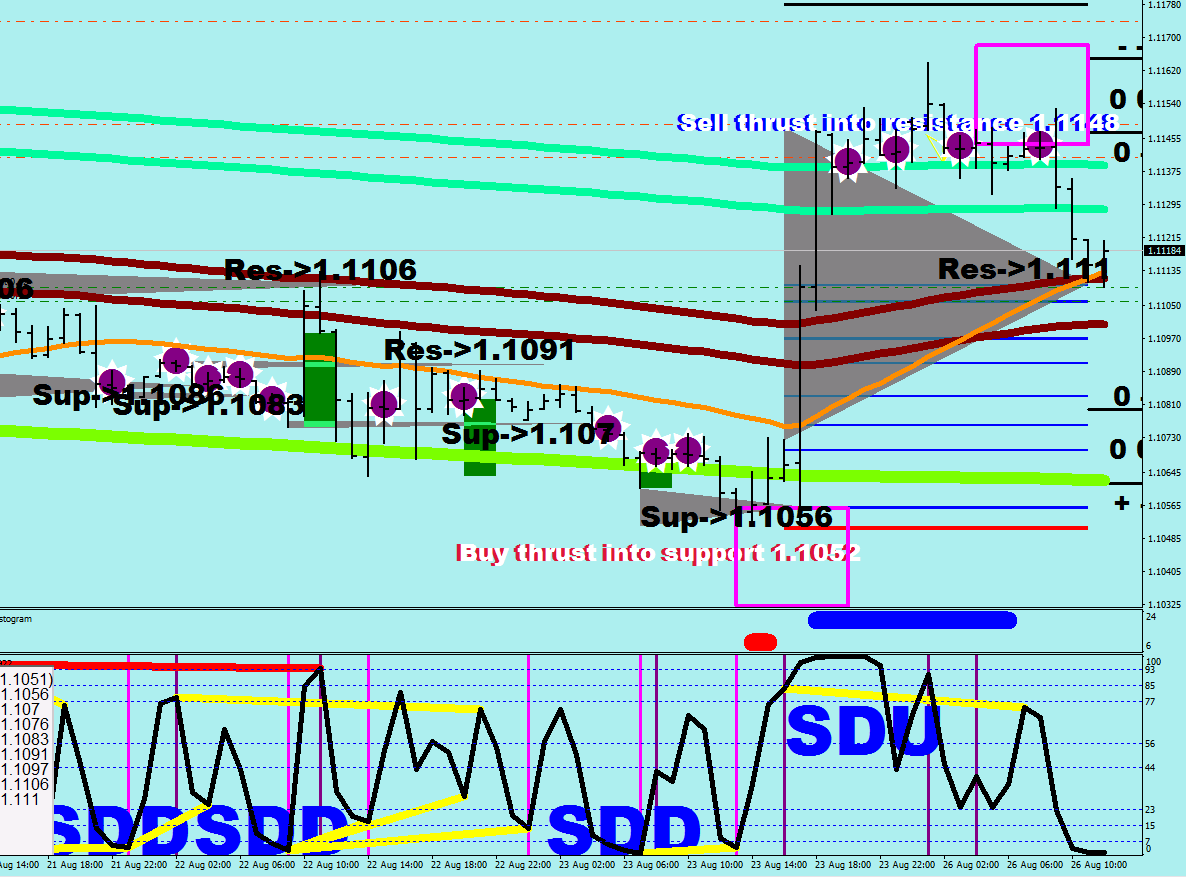

Whoop-Bam-Boogie

My current record for doubling the account is 52 minutes. I am not trying to sell you anything.

In case you still don’t know what high leverage is for…


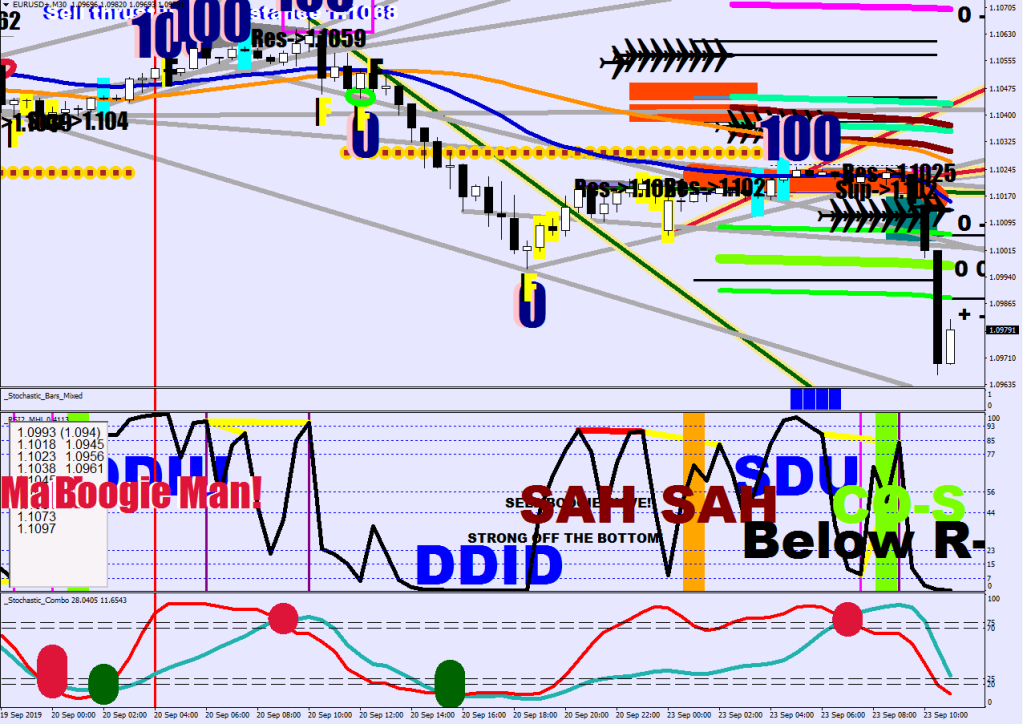
Bending the knee of the Queen requires 3 attempts by the Infantry. Check the triple divergence on the last 4 measuring legs.
Sign of Weakness

Sign of Strength


After the wave 5, no break extension – they get to stab the pig.
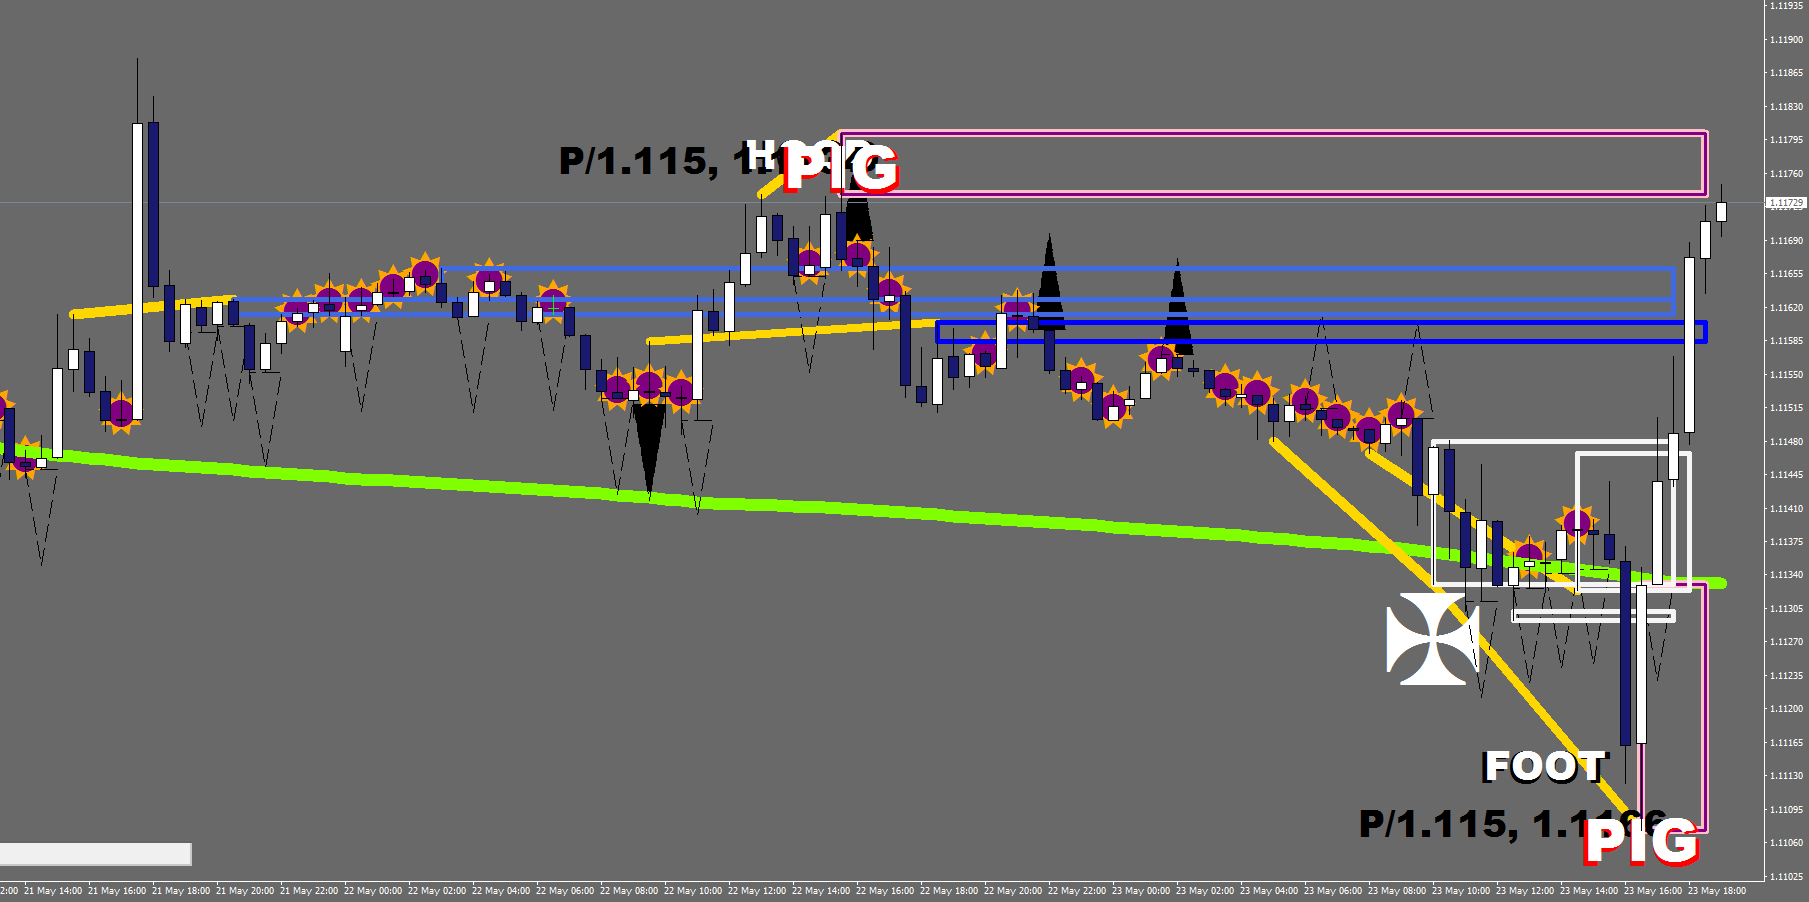


Foot loops
Eating good in the neighbour-


Pig in the sky kicked in wave 5 which was a no break extension to the fluctuation bracket – hedge only if the bracket gets exceeded by 9 pips+
The consolidation weight just moved from here
To here
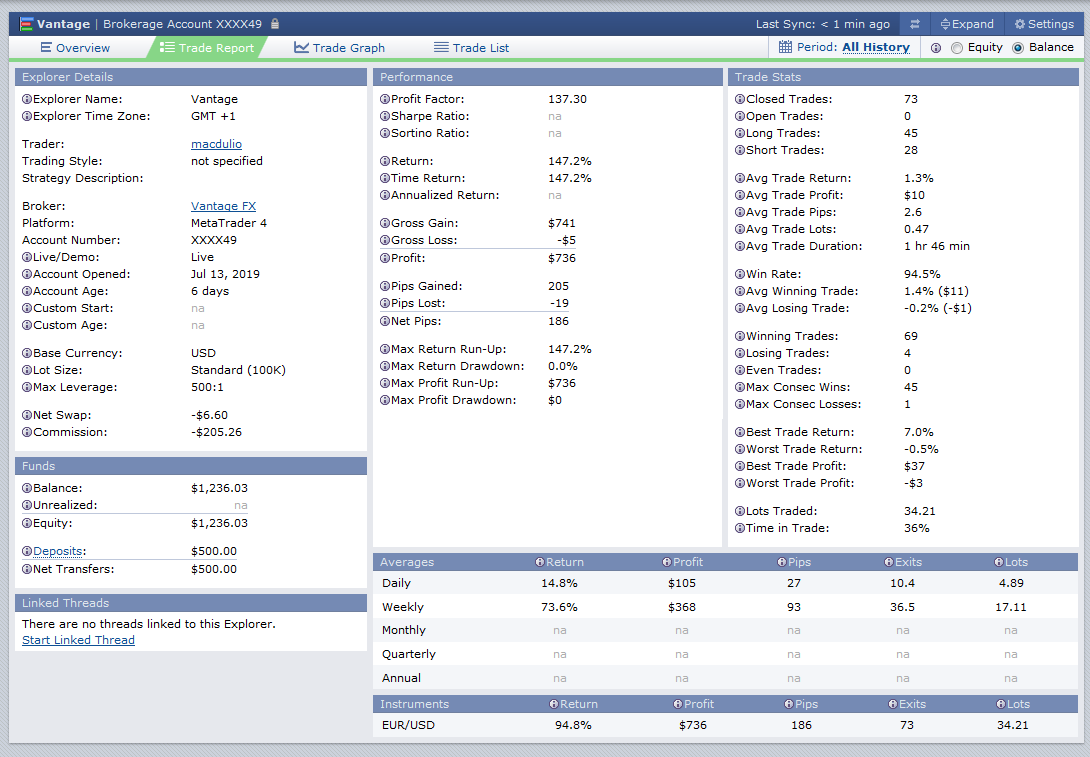
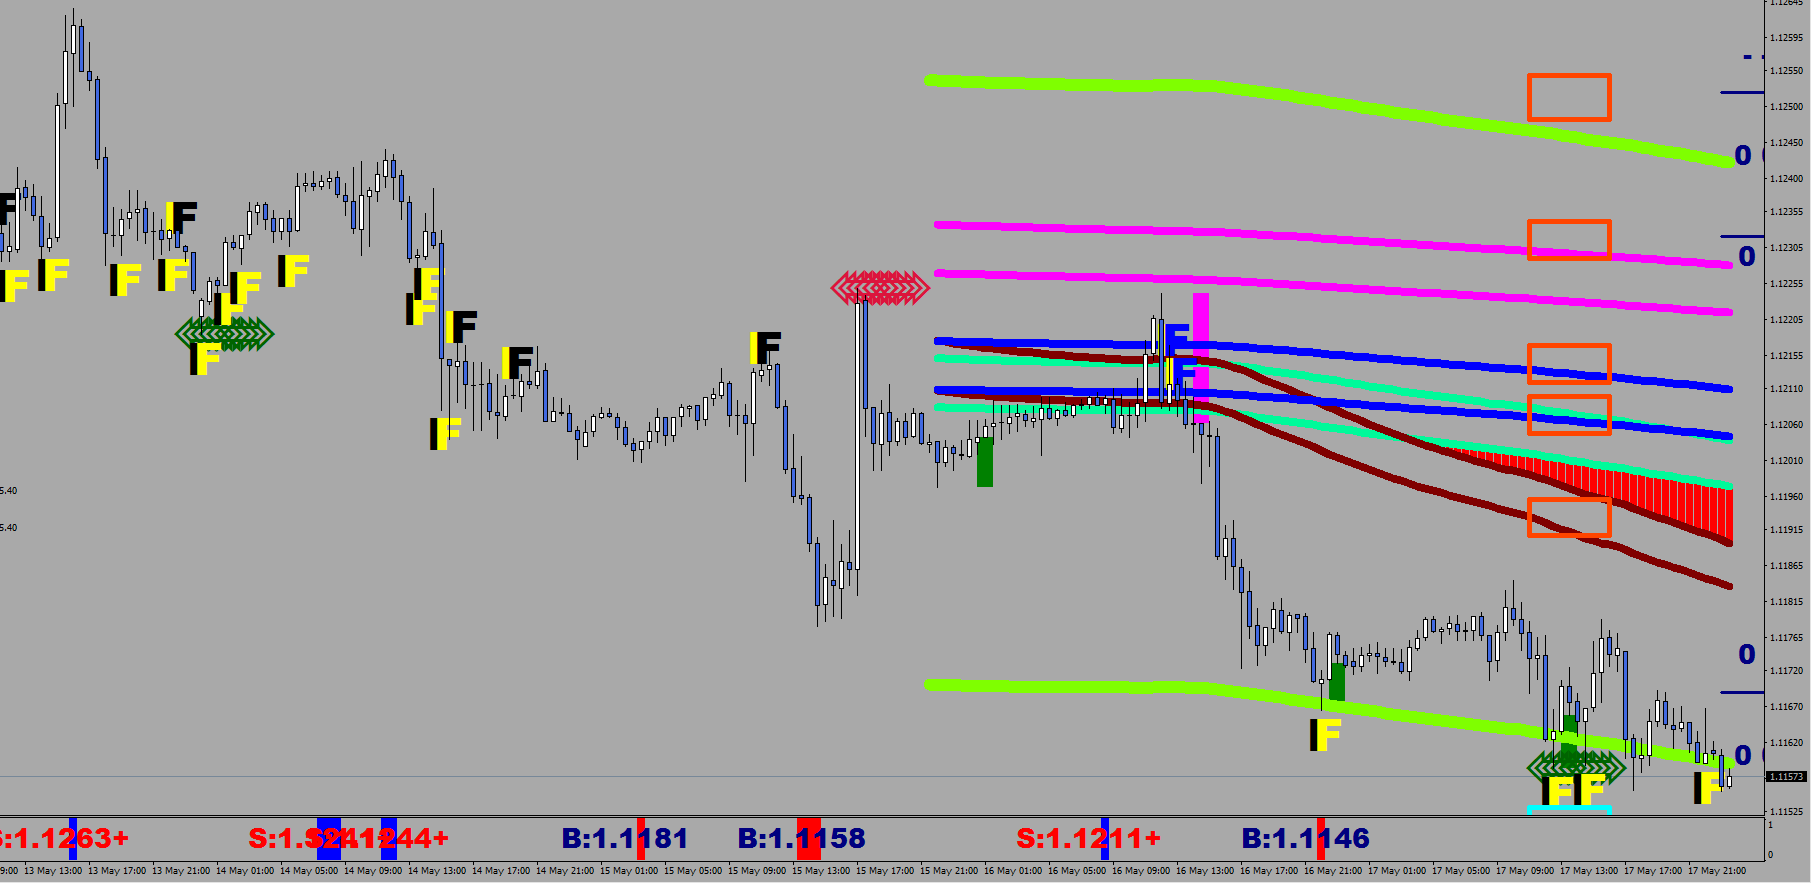
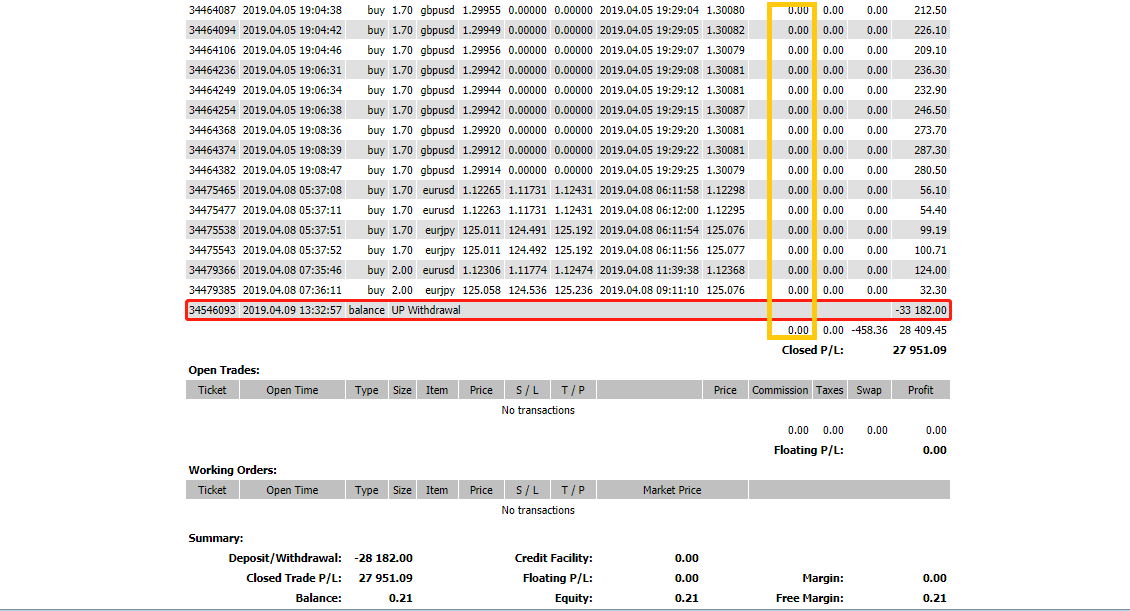
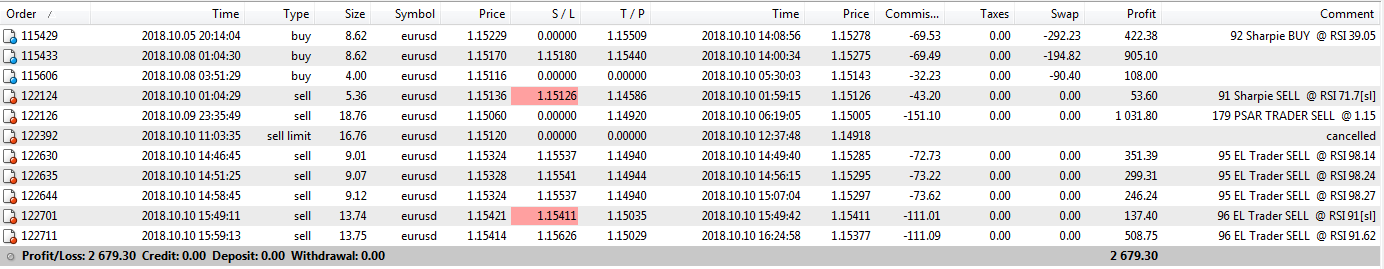
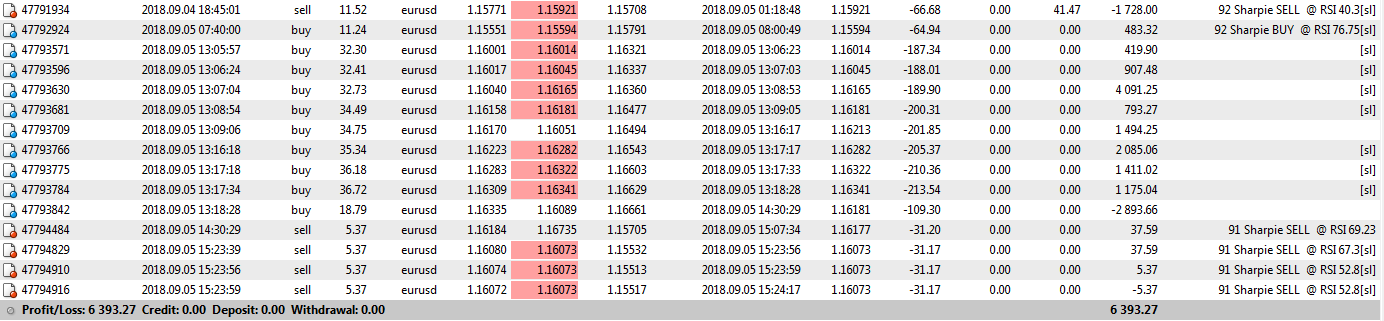
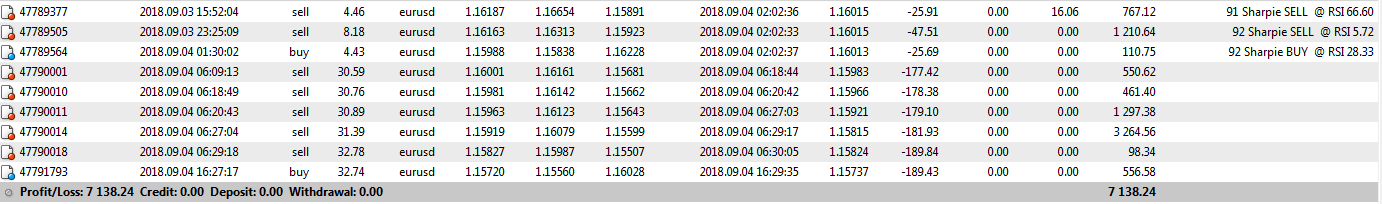
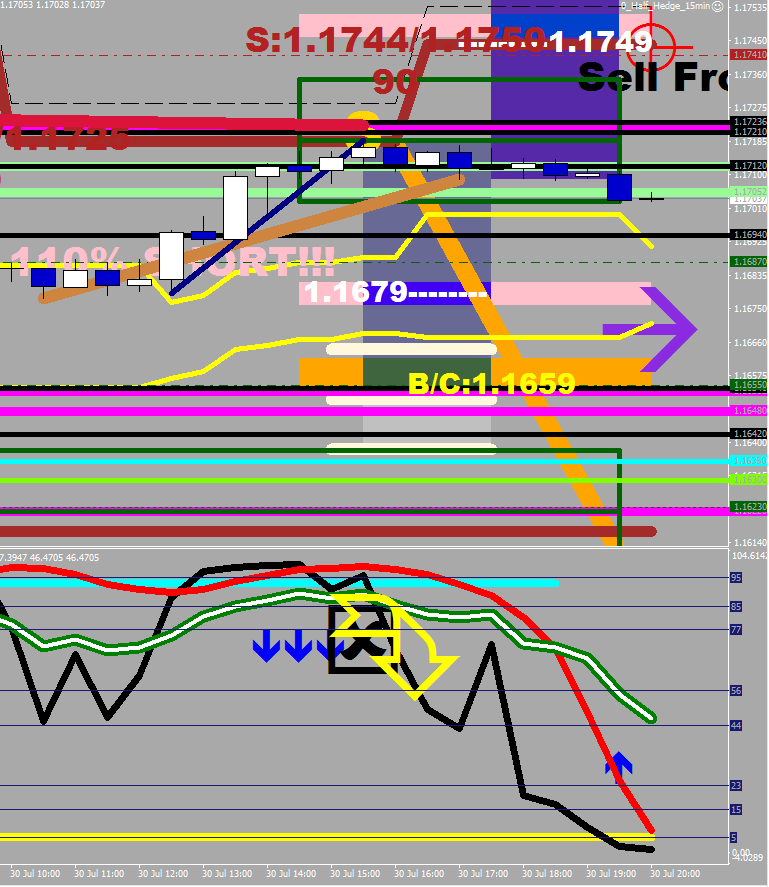
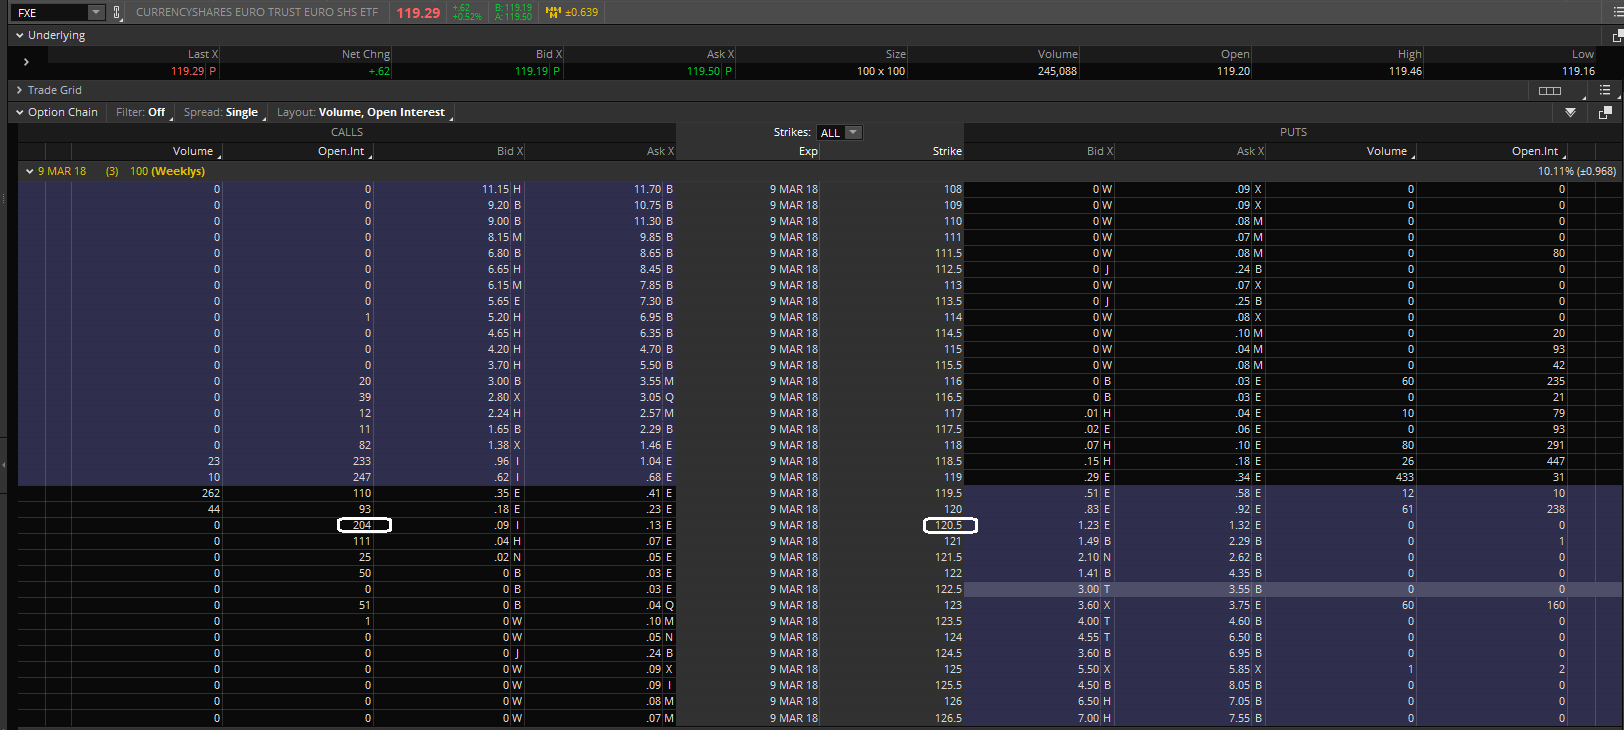
Was reluctant to do this, for the test period is not up yet, I’m into 3 weeks of Cooper test at the moment. The reason I’m talking to you is that I spotted another scammer. He posted outstanding looking results with a pretending to have withdrawn 6x money in one month. I can do these numbers, but the images he posted show 0 commission on every trade, which makes those statements a demo where the commission was not turned on and thus a forgery, for he could not possibly had a withdrawal. Look at the orange rectangles: this field would never contain zeros.
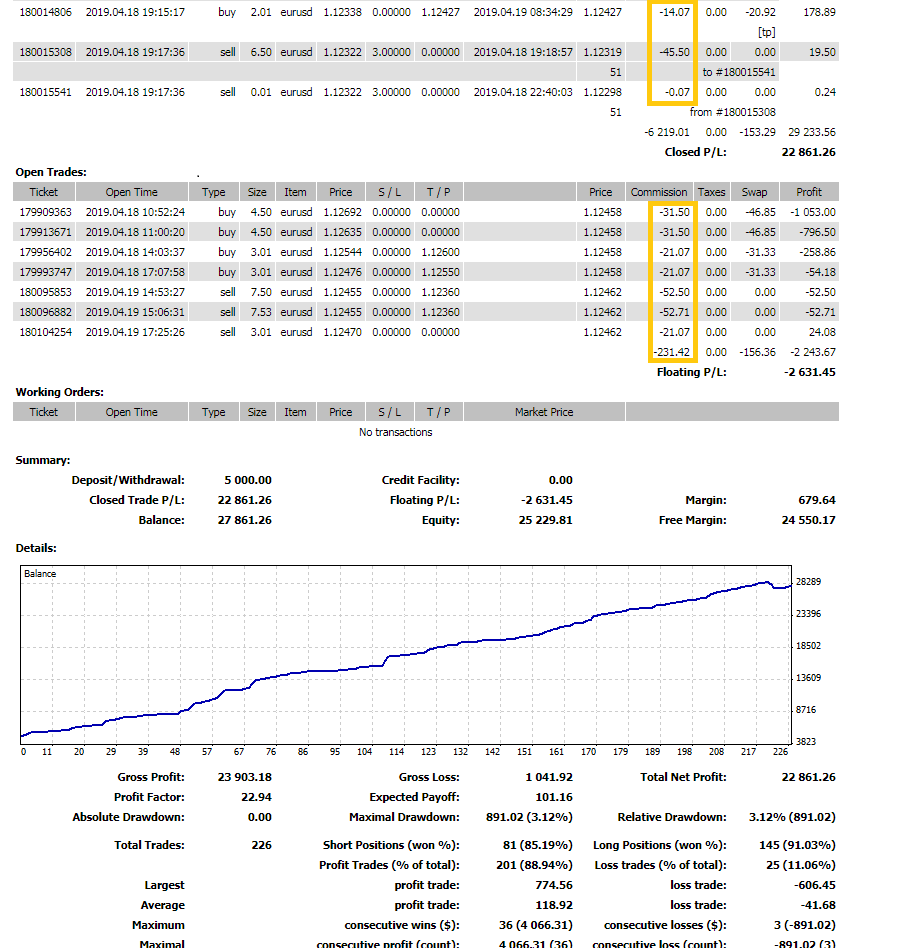
Here is the mentioned forgery:


About the End Game and the Burn in the book, very soon.

Evo6 Minx


This is what the fluctuation distance can get you

& the Fake Off Feature

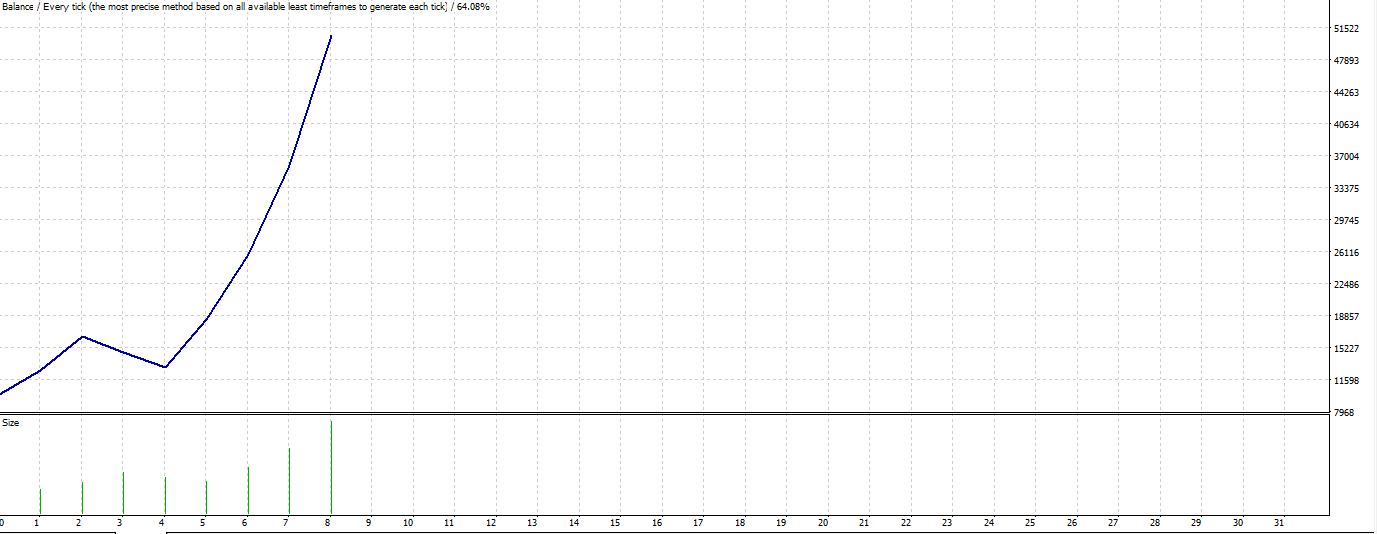
Latest back test for EVO-6

Last 5 sizes limited down to broker’s upper cap

See you on the other side…

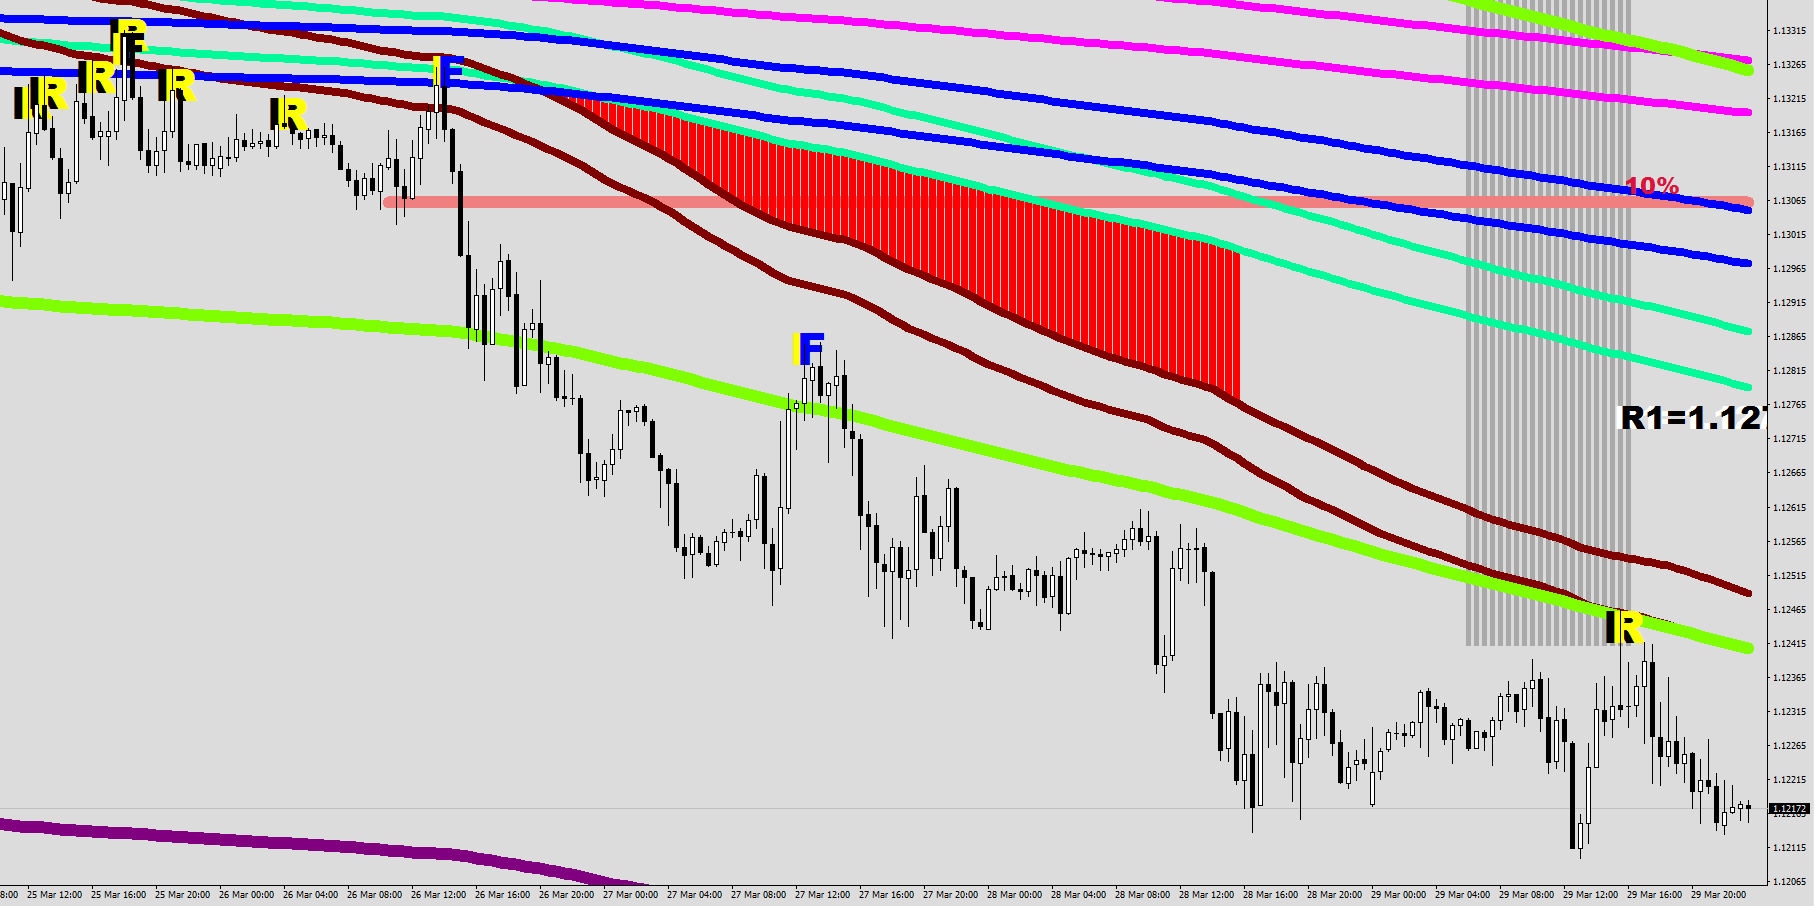
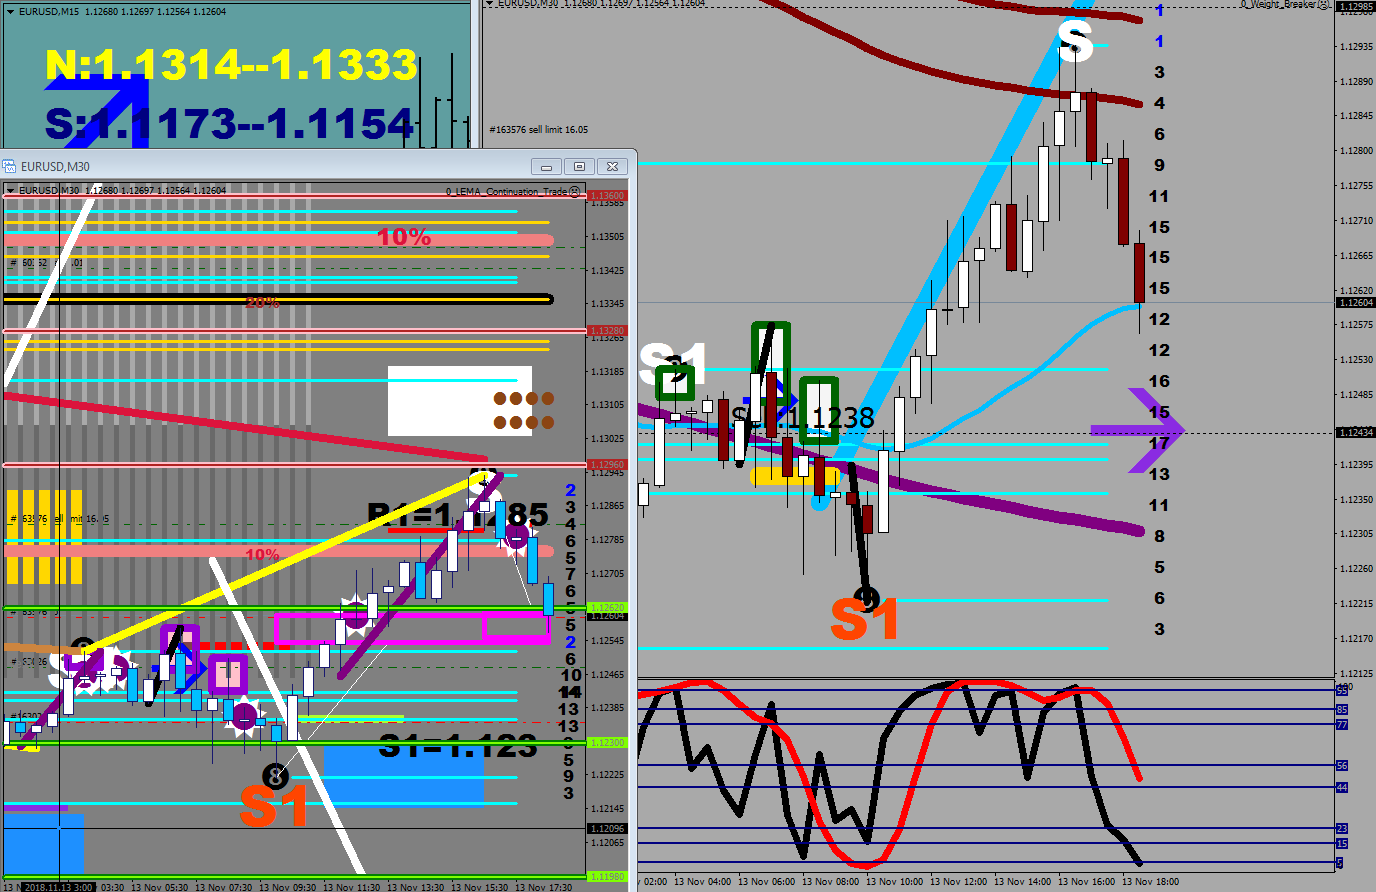
10% line reached
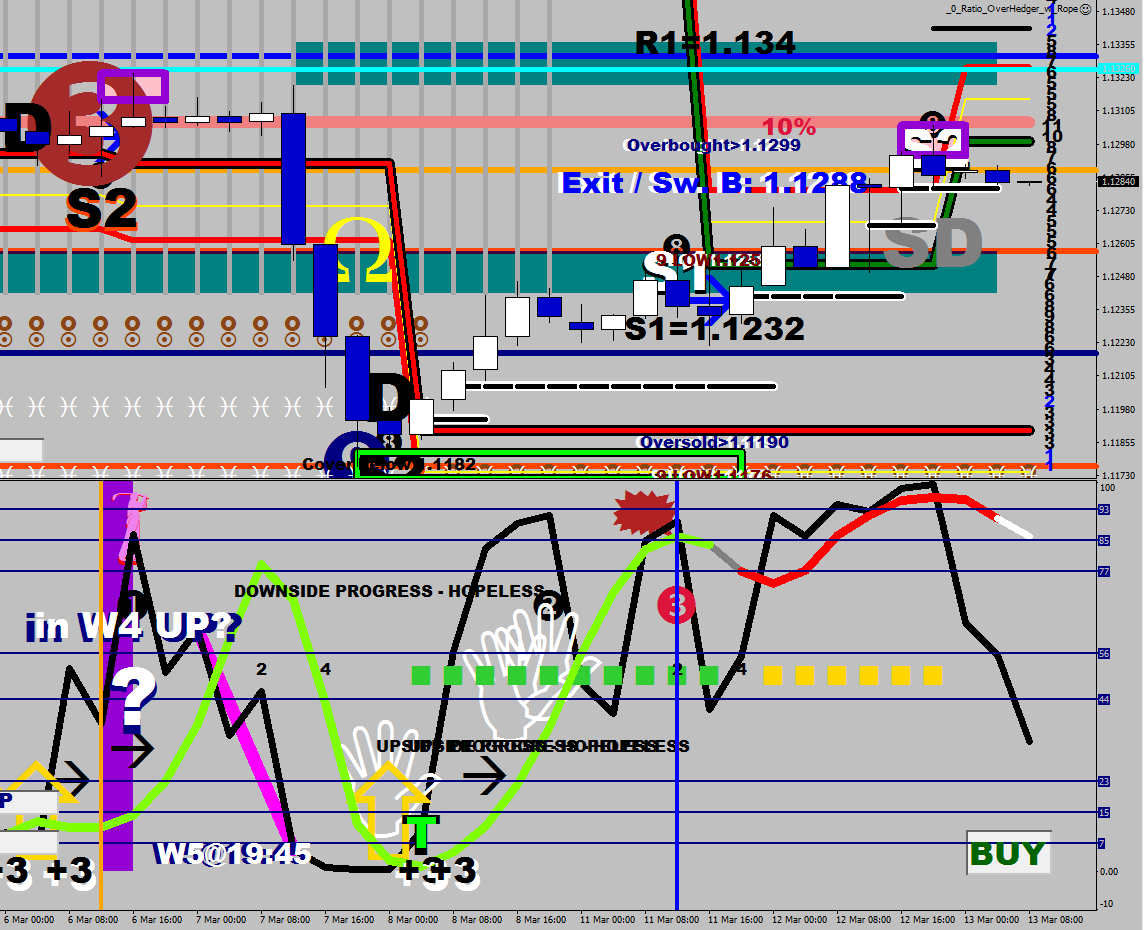
50% Monday.


Now that I am out in front, I can see the potential. This week it would had been 5x of what I produced.


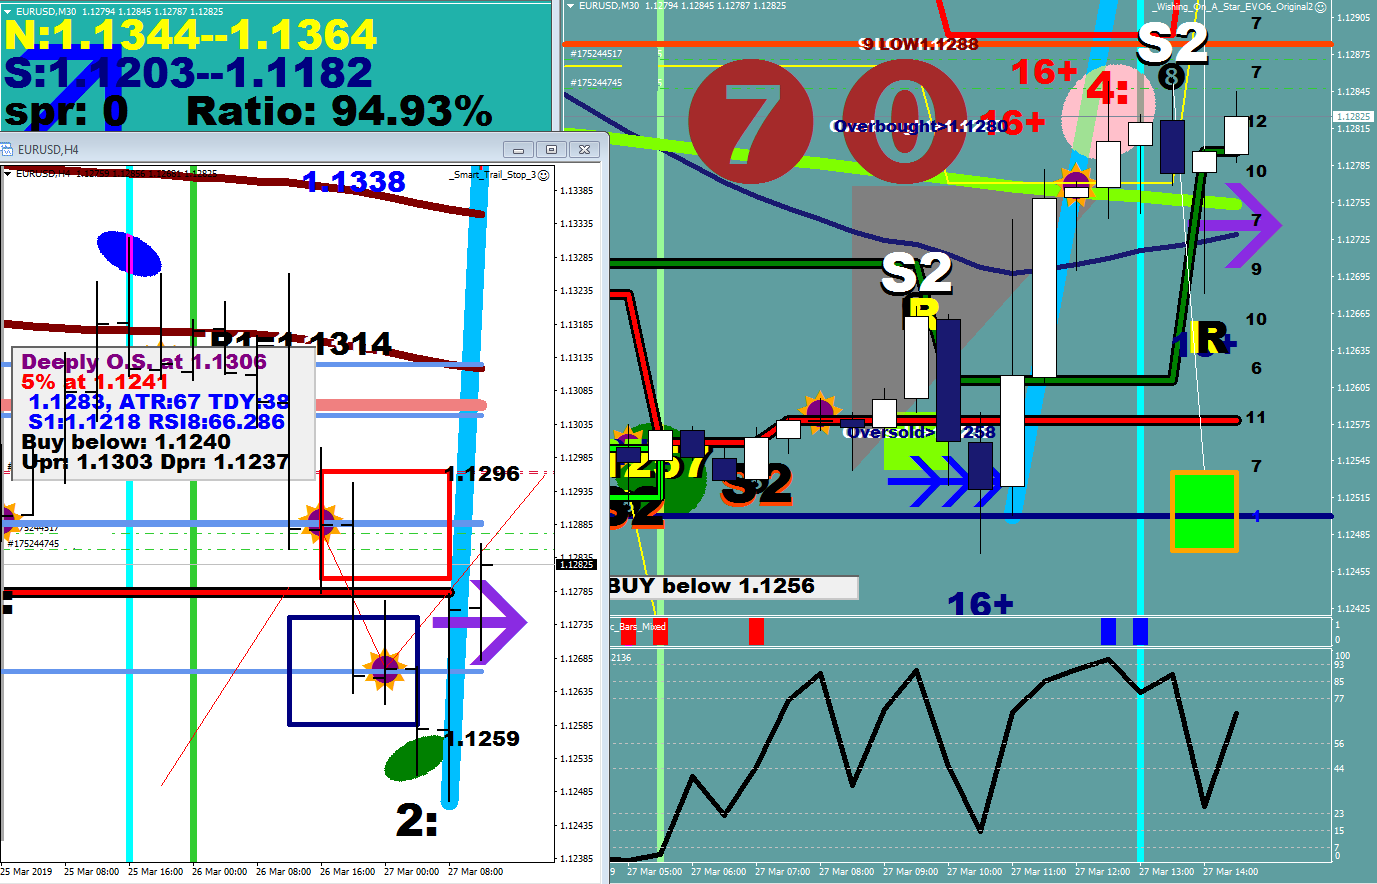
There is the ABC correction and there is the embedded 4H overbought stochastics.
Busy back testing my 2 new routines.

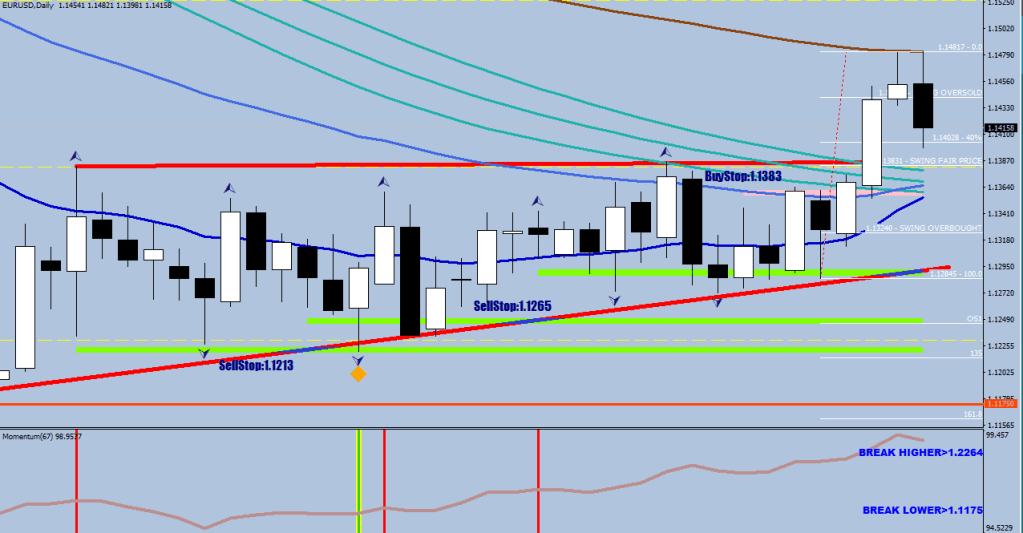
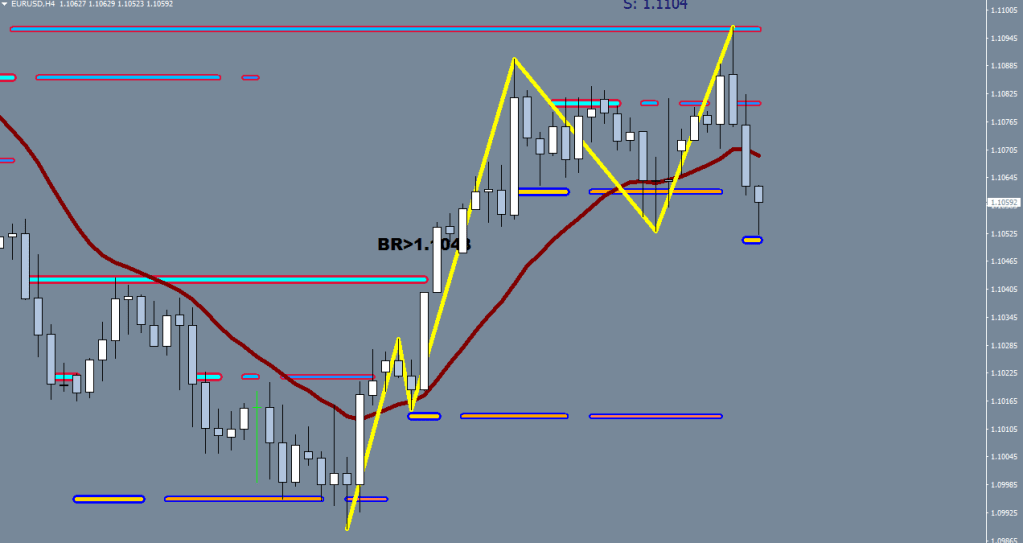
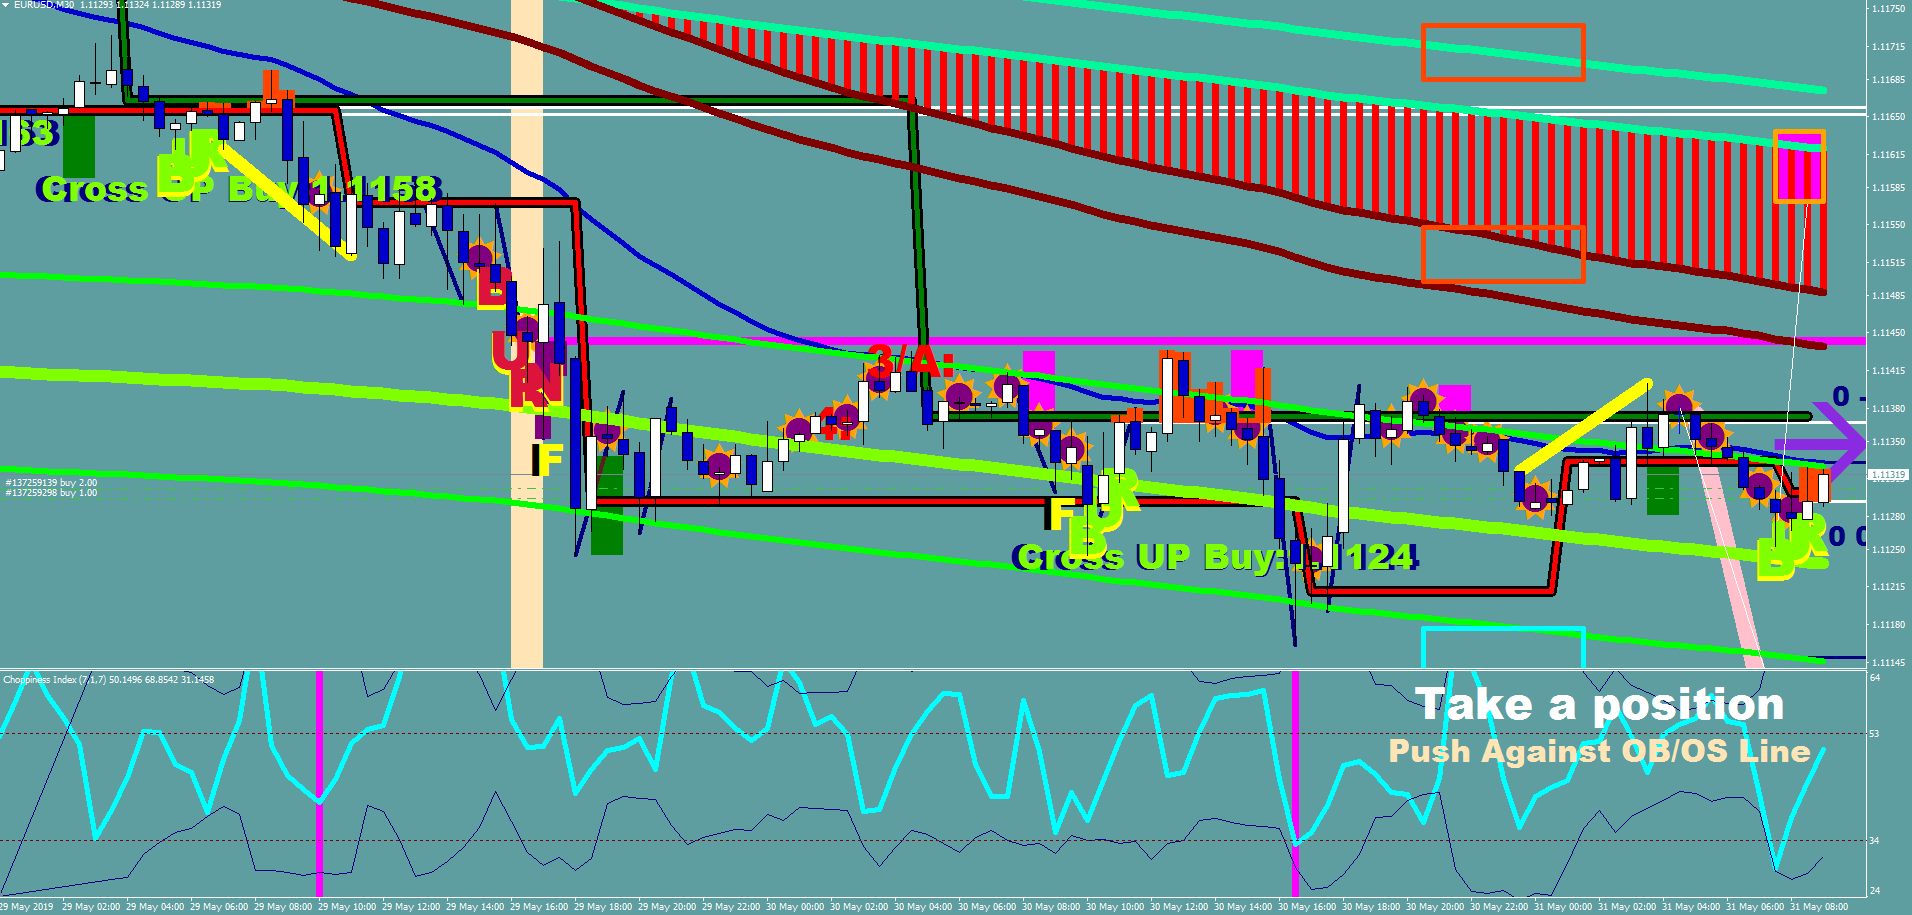
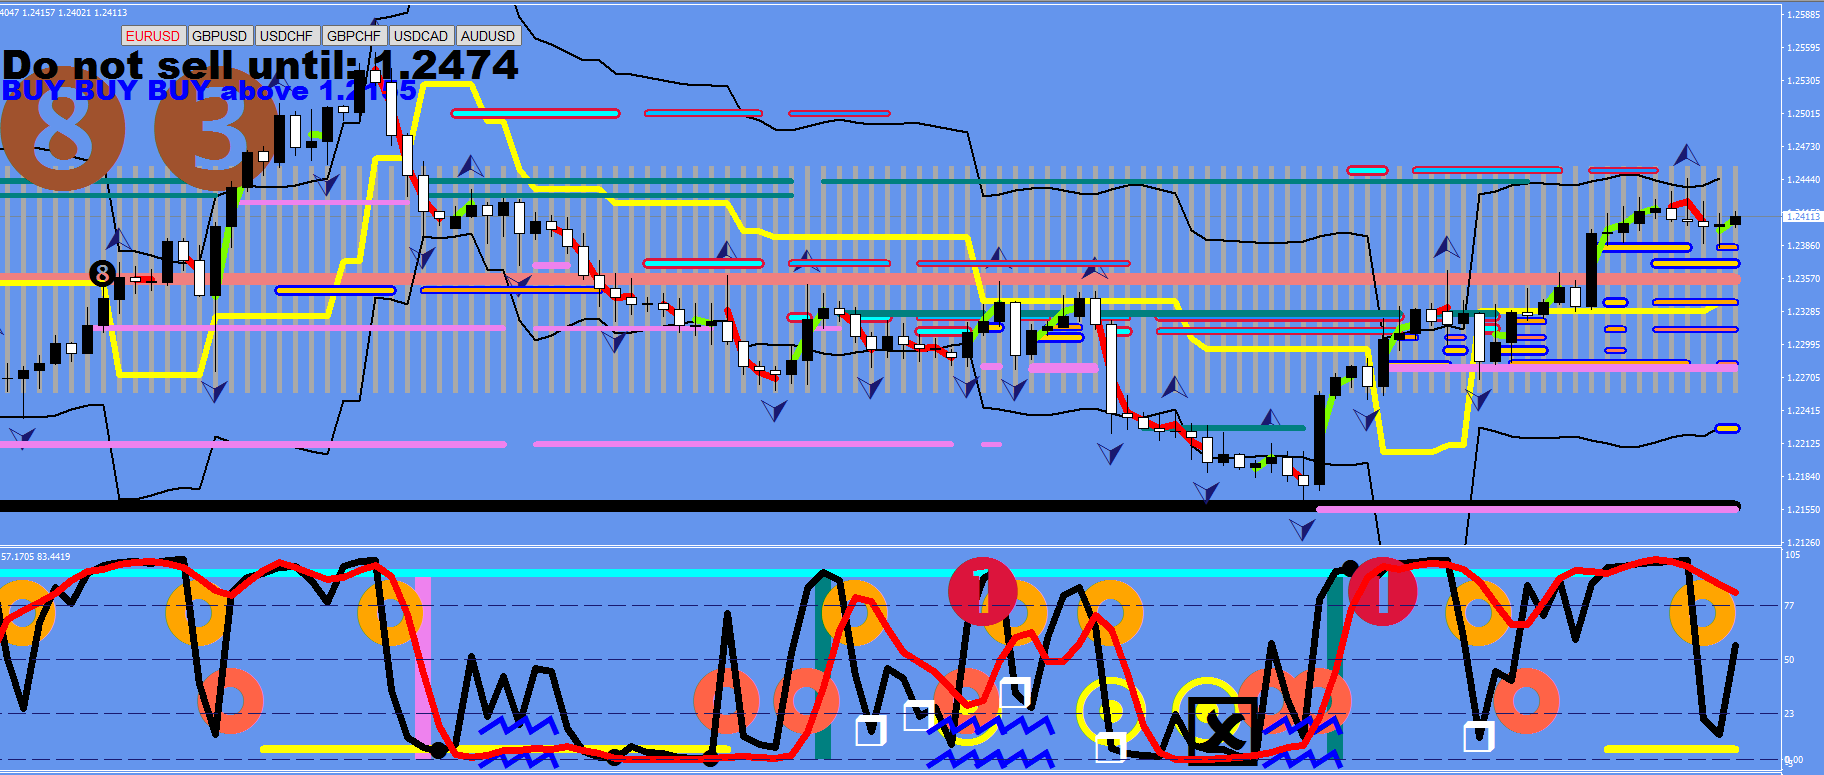
In terms of the future, I made my call in the last blog entry, and the call was this:

for 3/1/19
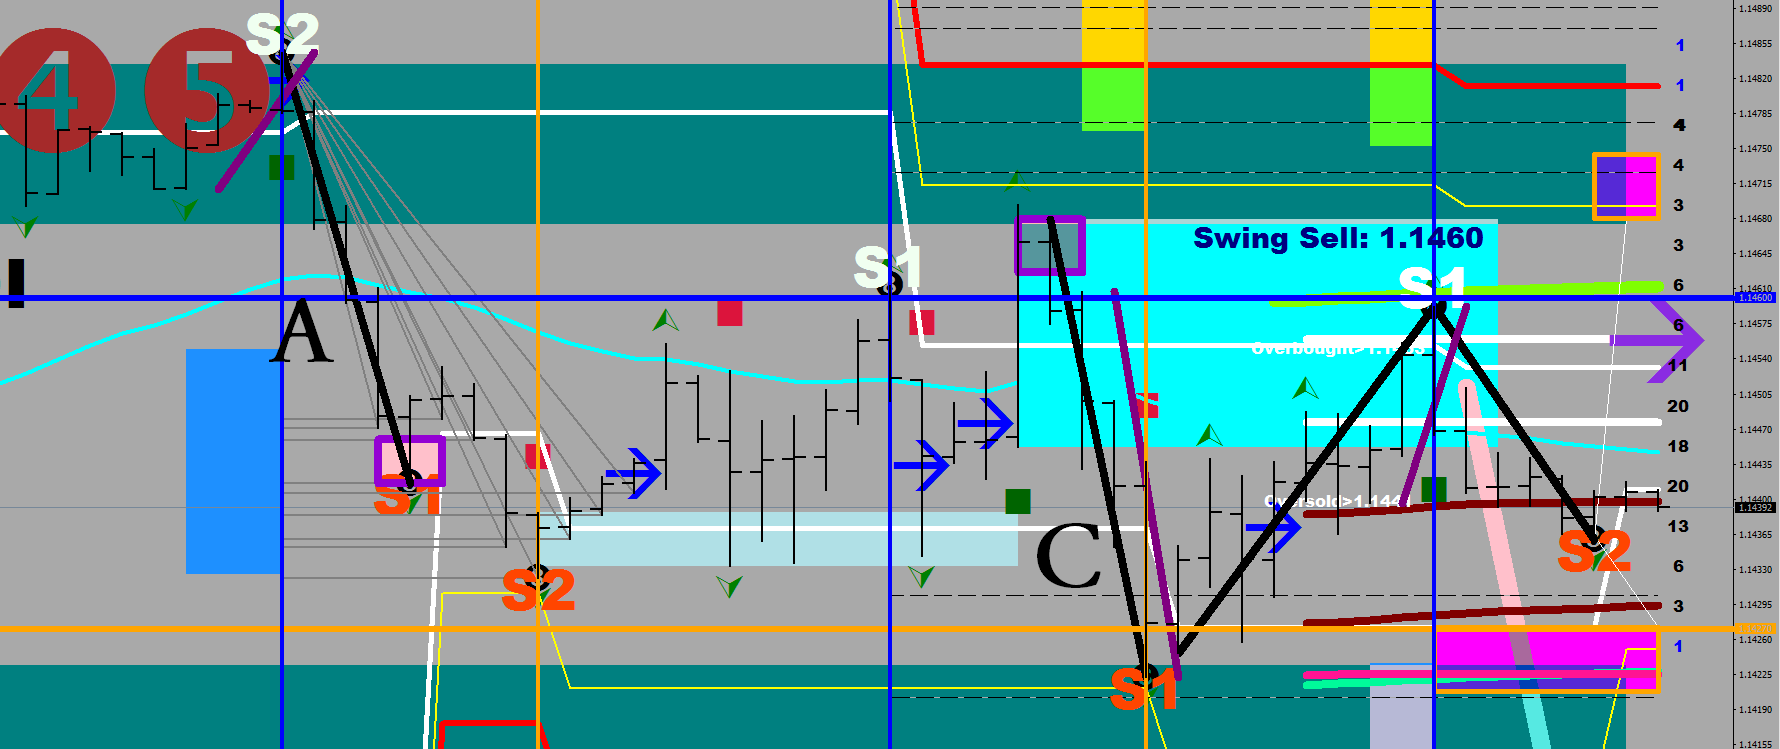
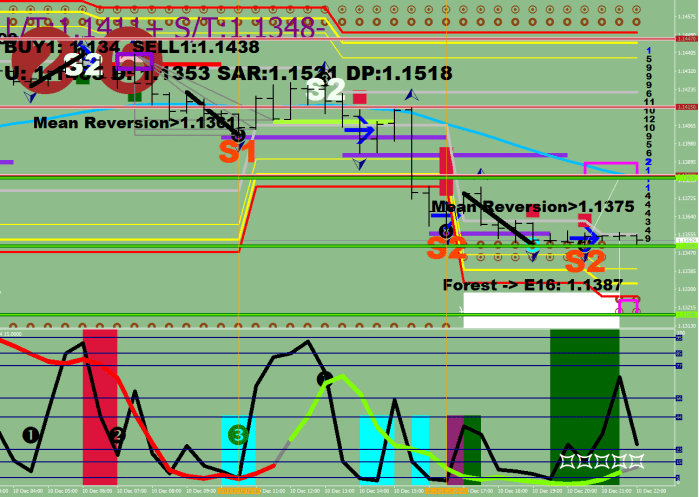
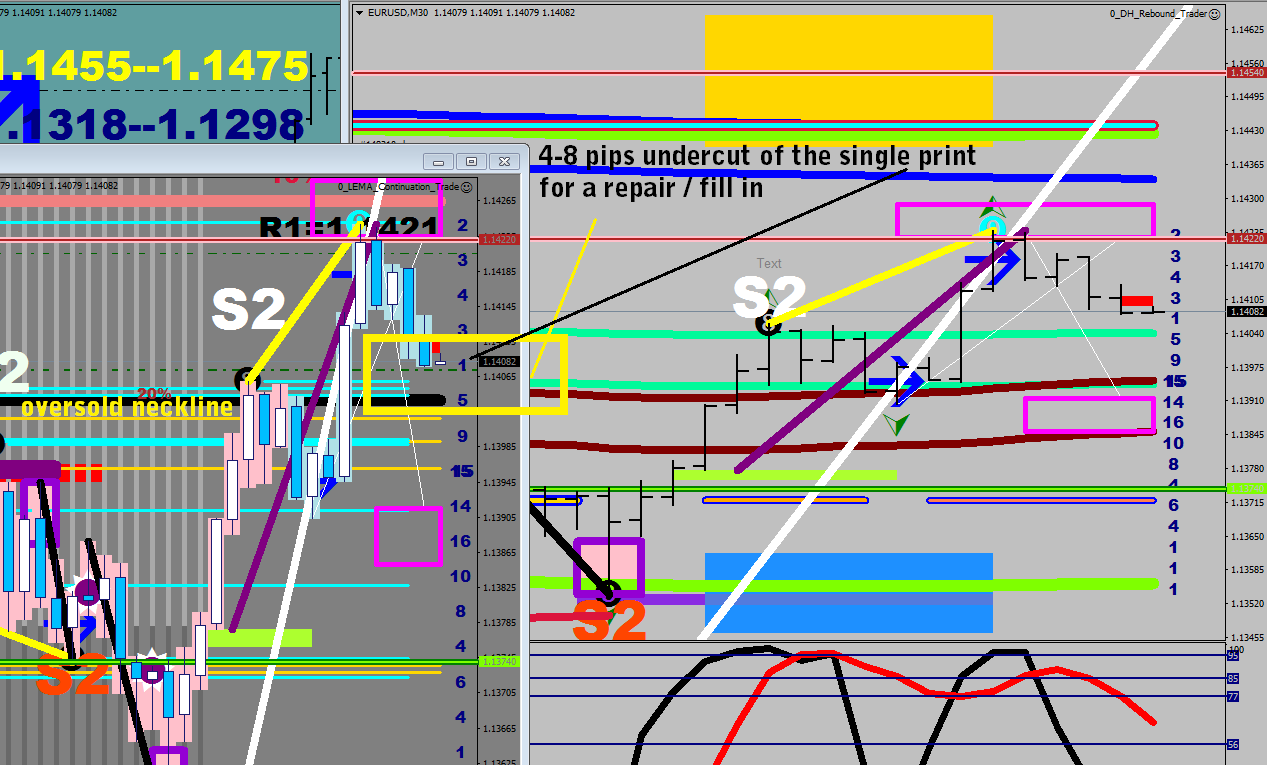
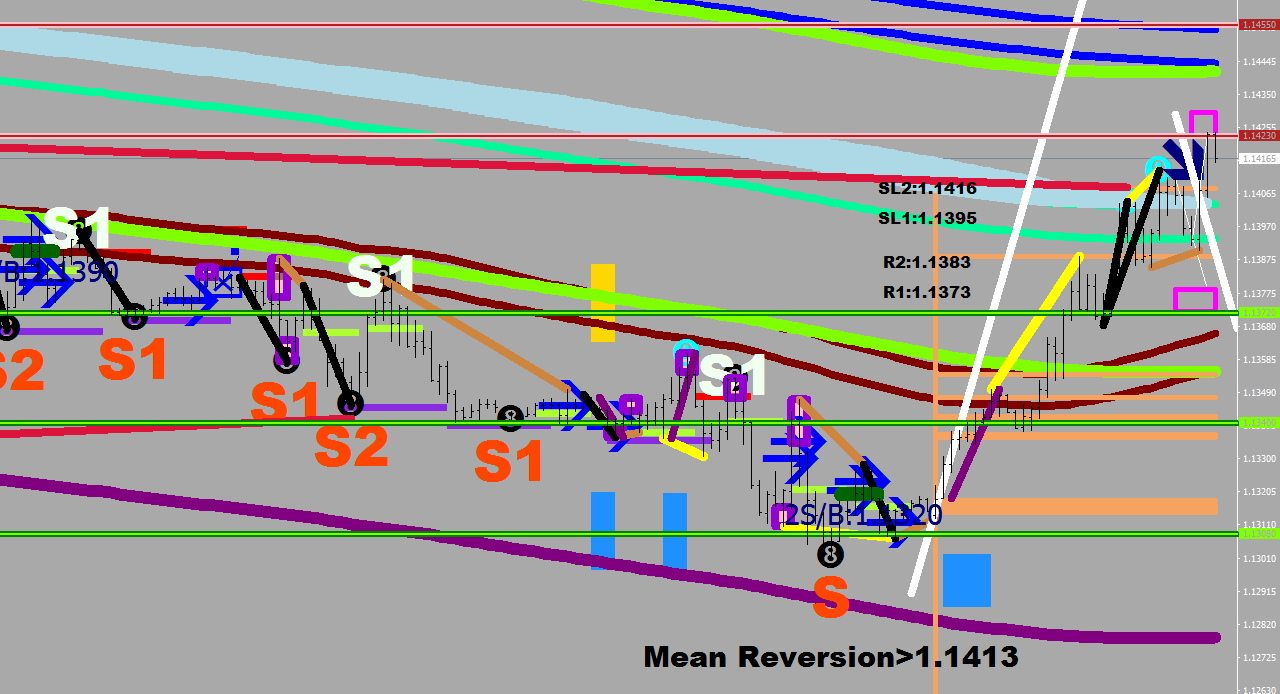
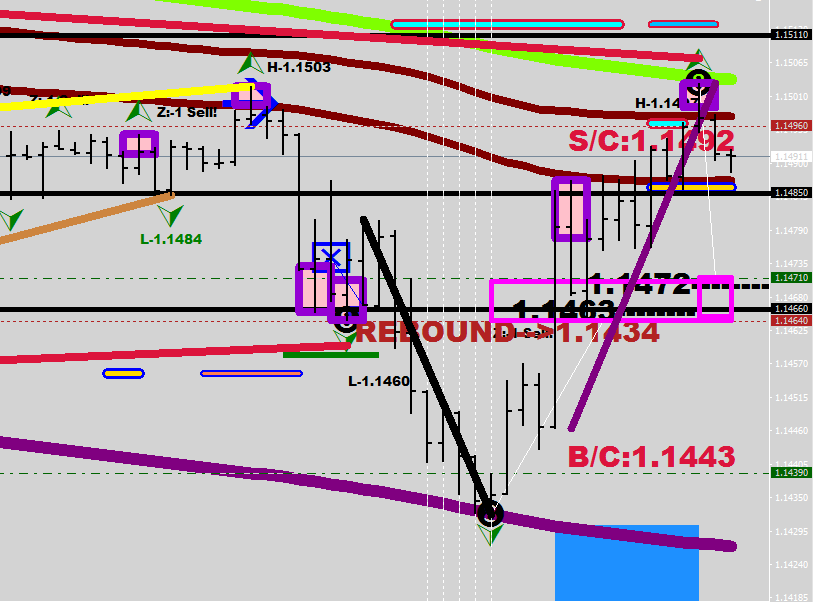
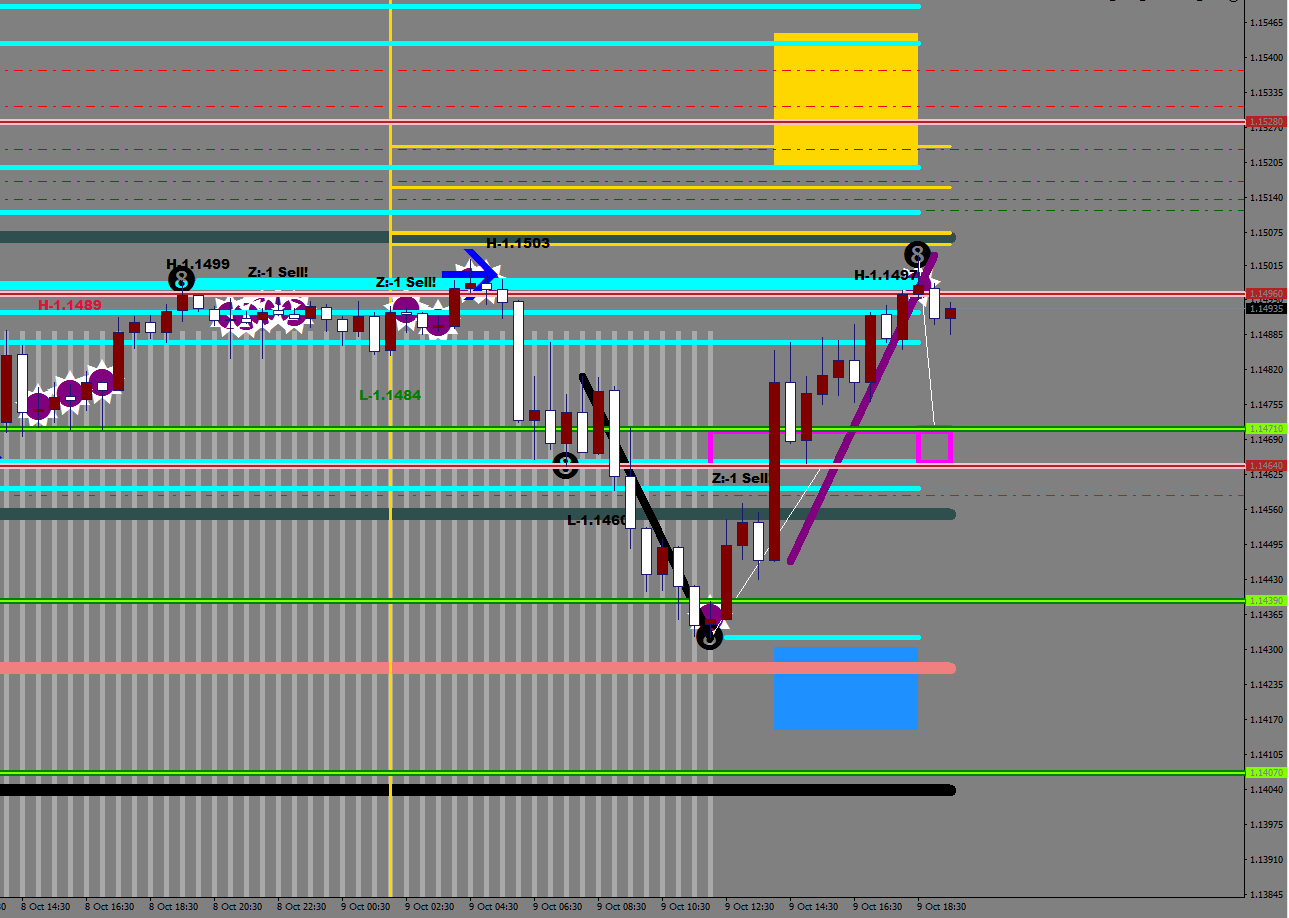
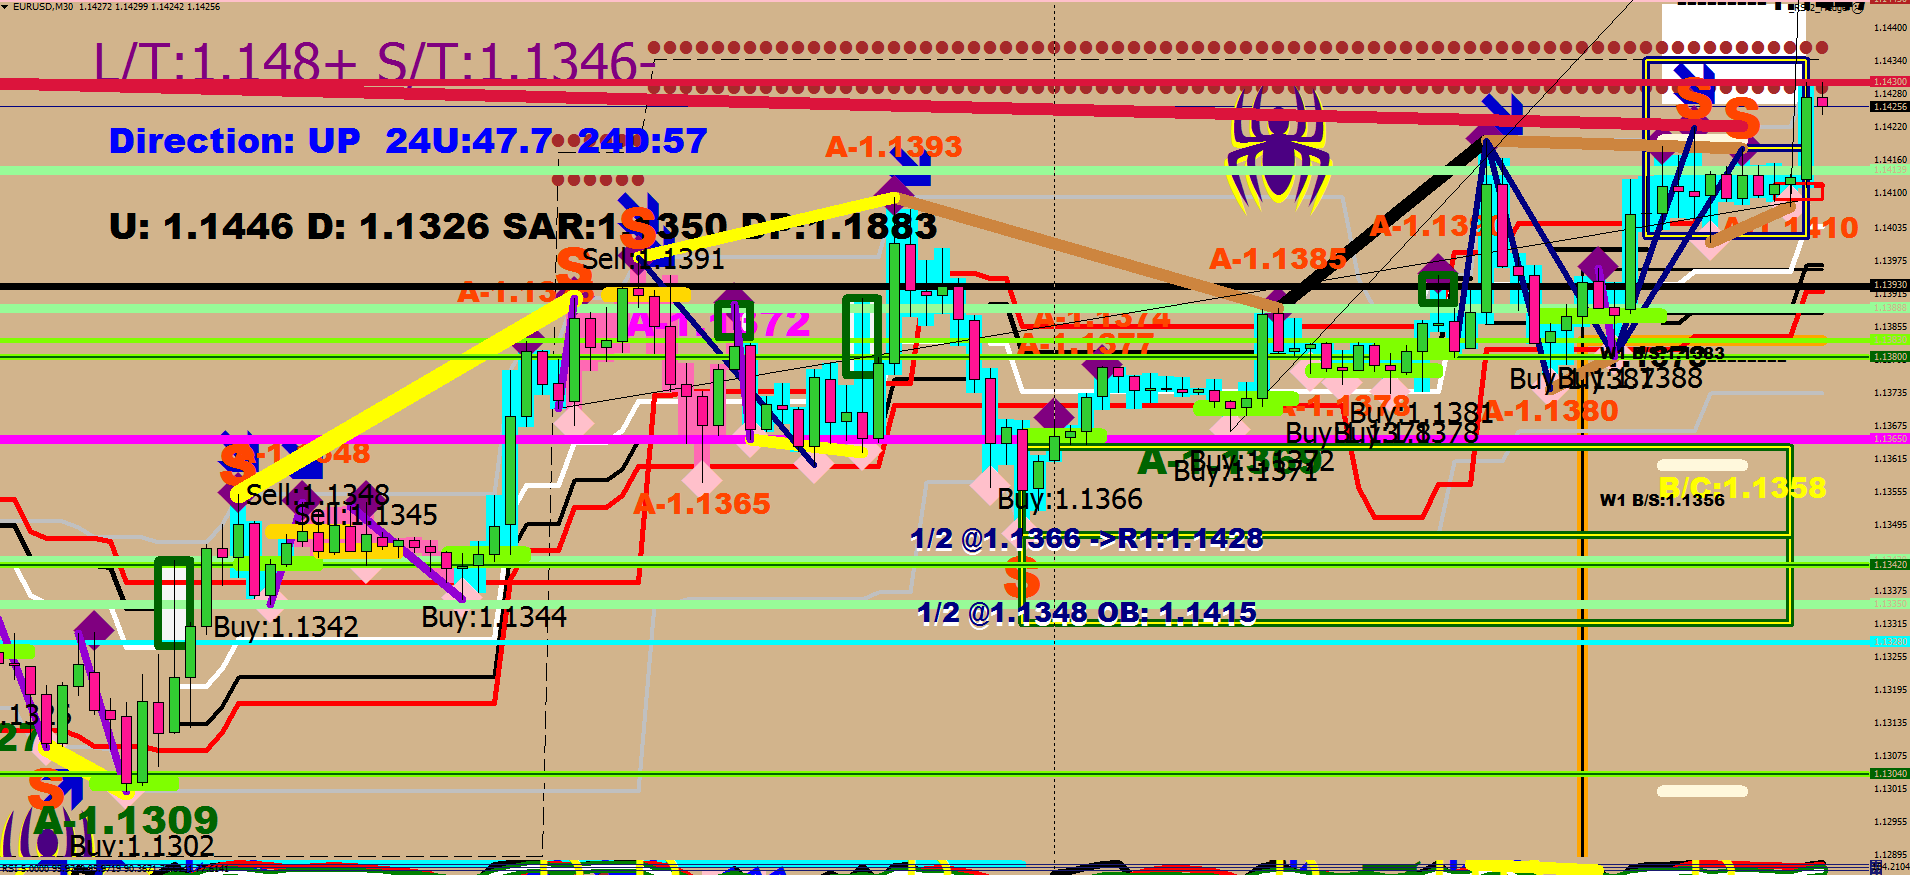
(expectation: (after a lower low – see the green rectangle later) a move back up 1.1375 to resist first – and a slip back into the green river to repair the quick move is not at all impossible upon clearing the lower guard rail at the fore mentioned number; target 1.1414-1.1420)
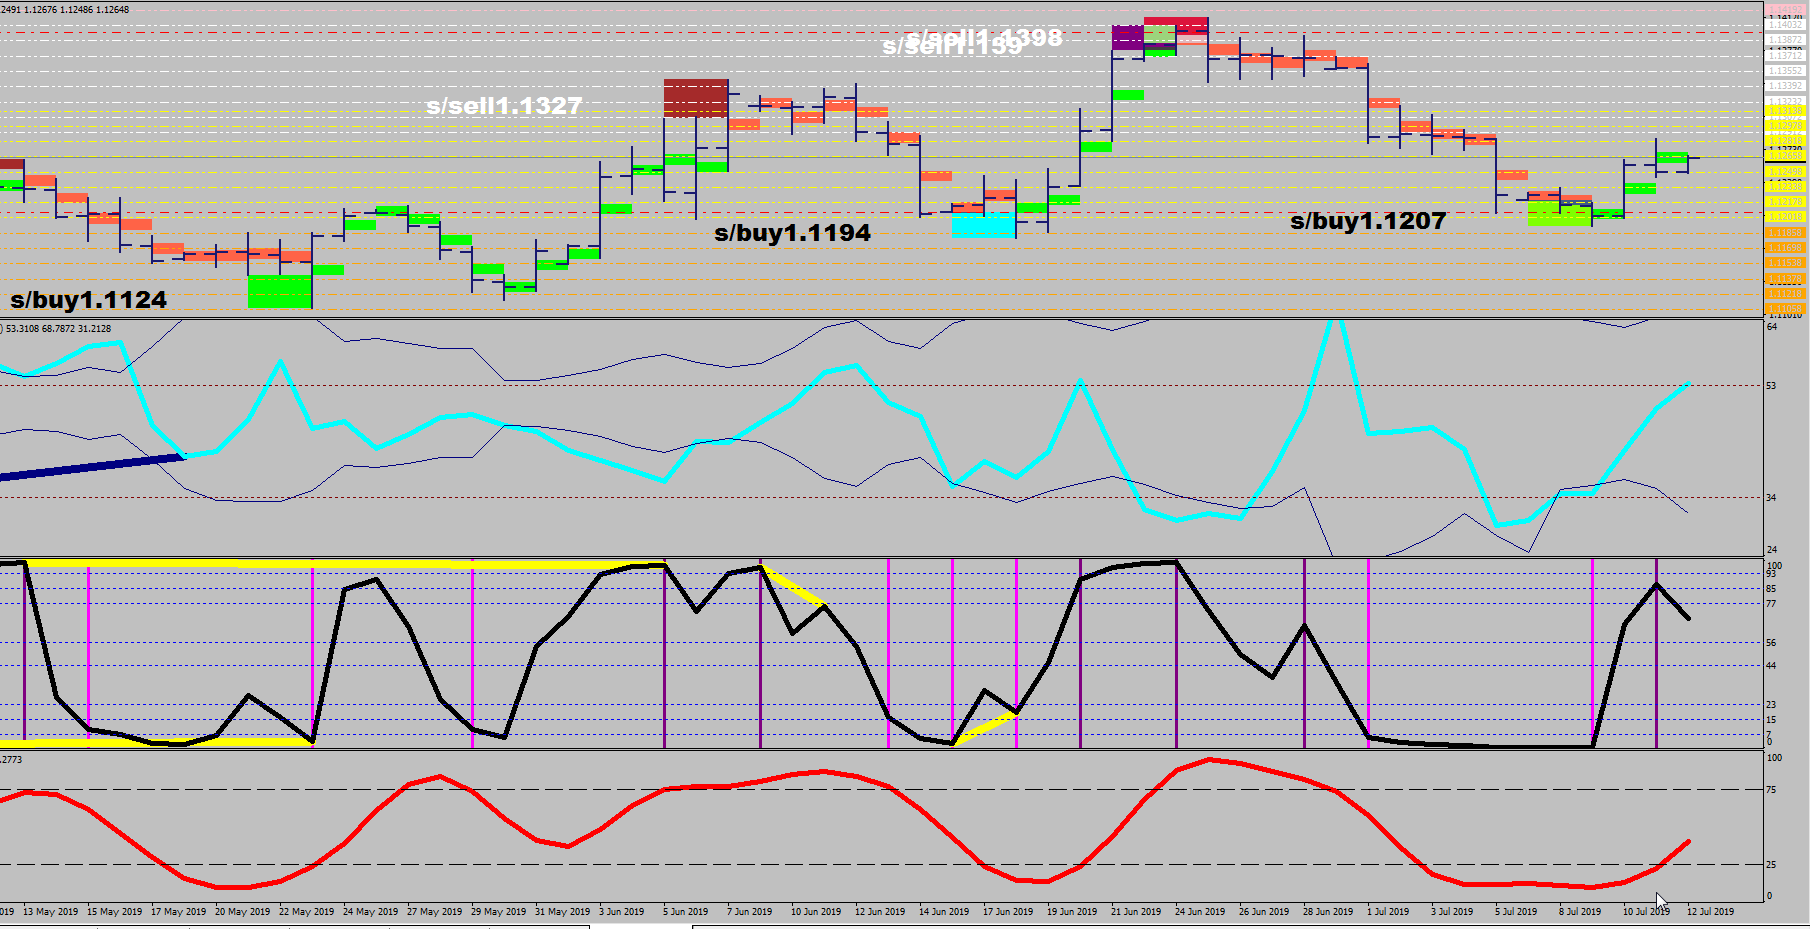
Roaming Range: 1.1325-1.1375
ATR limit up: 1.1520
ATR limit down: 1.1320
Statistical resistance levels: 1.1439-1.1443
Statistical support levels: 1.1417, 1.1402/1.14, 1.1377, 1.1350, 1.1312, 1.1306, 1.1285
Boss: Bear
Market speed: 2H
Other stand-out levels:
LT Oversold neckline: 1.1483
LT Deeply oversold: 1.1349
4H overbought: 1.1491
4H oversold: 1.1331
——— from 31/12 ————–
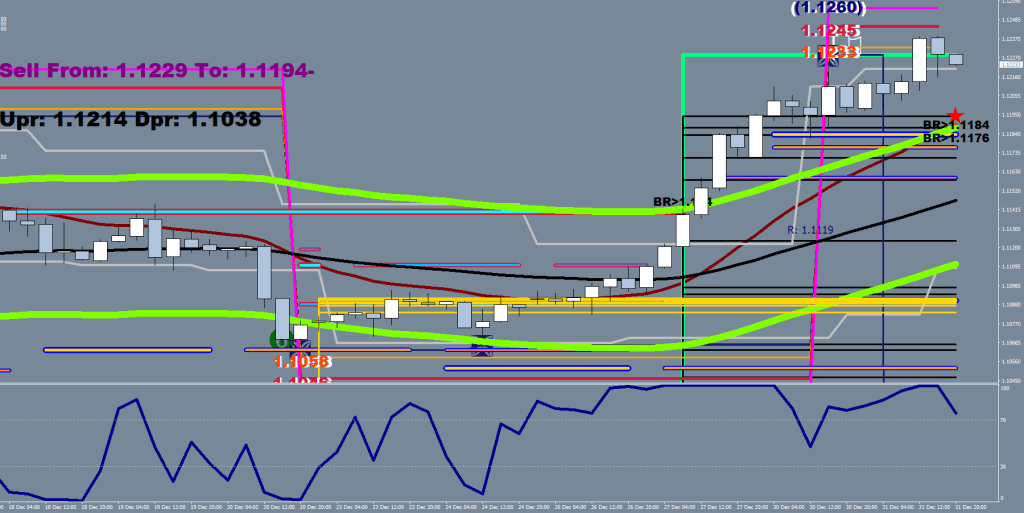
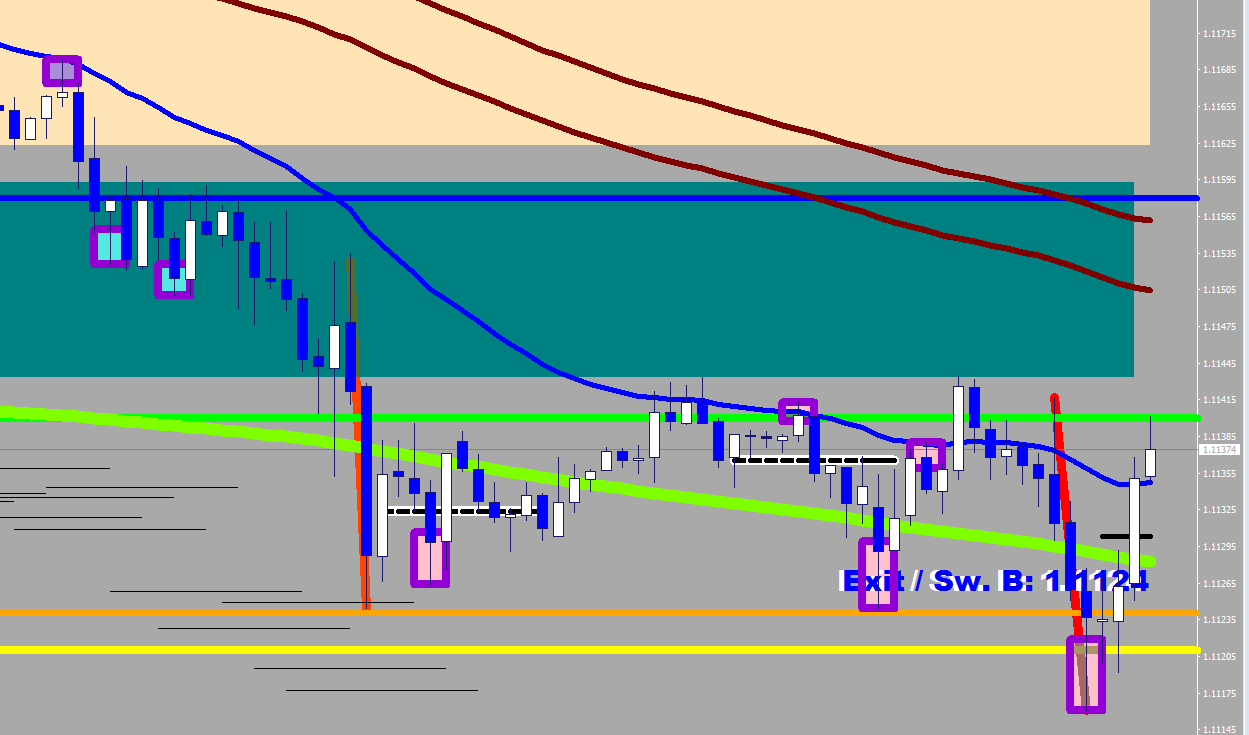
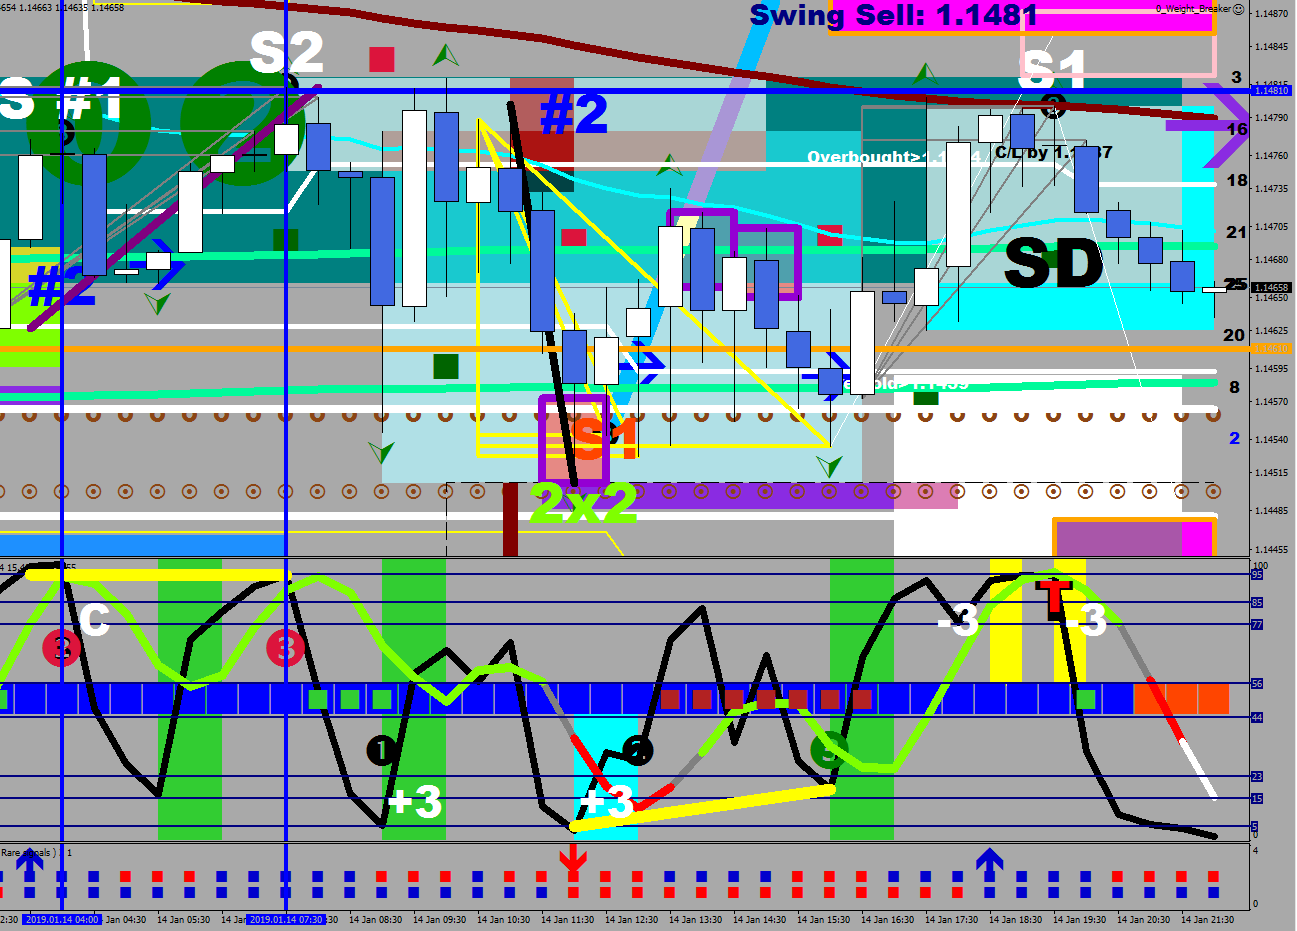
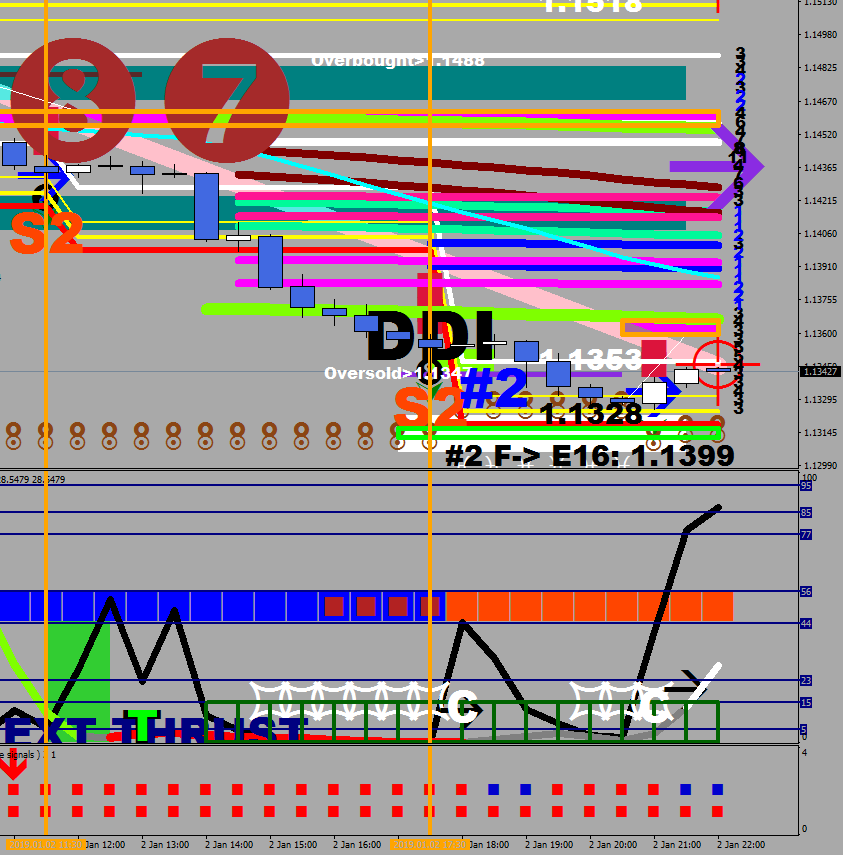
Wave 5 was made on 27/12 and the overbought status was lost soon after.
Price is currently above the Deep Pink, but I don’t expect it to stay here.
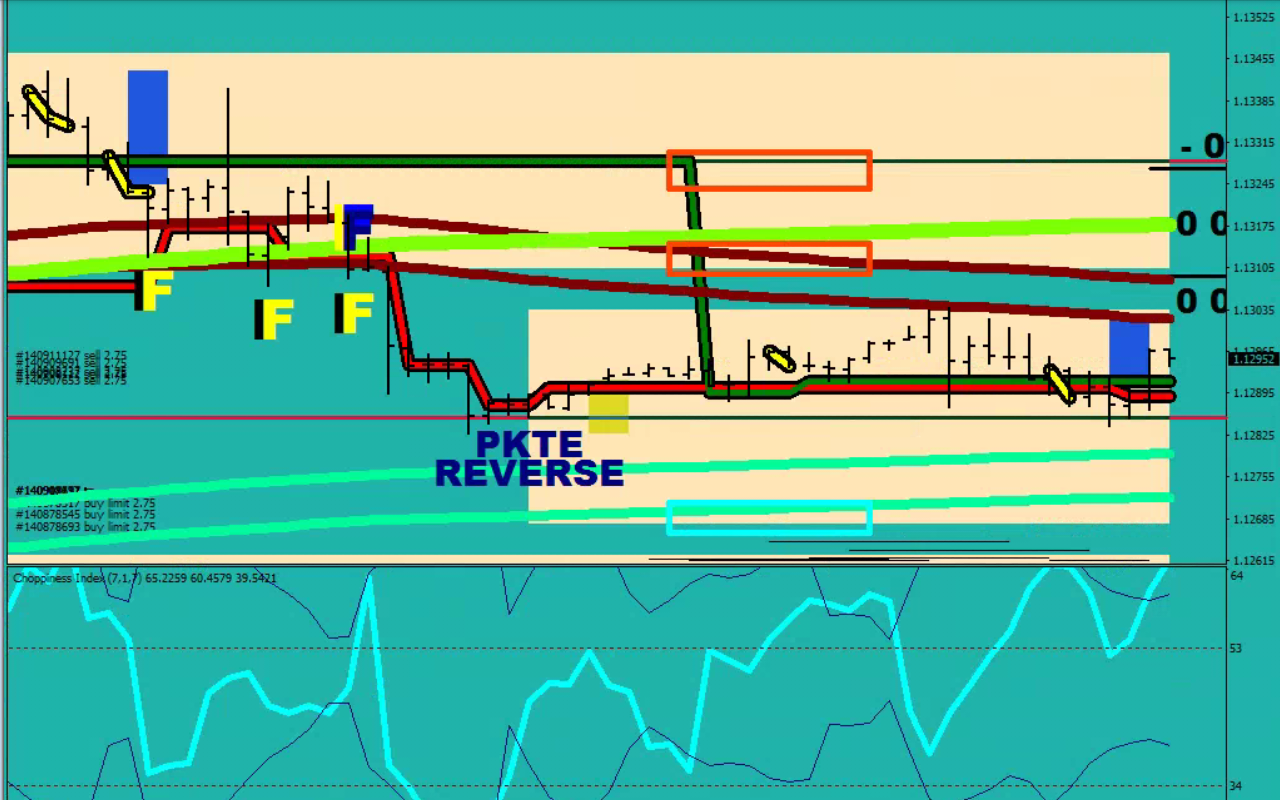
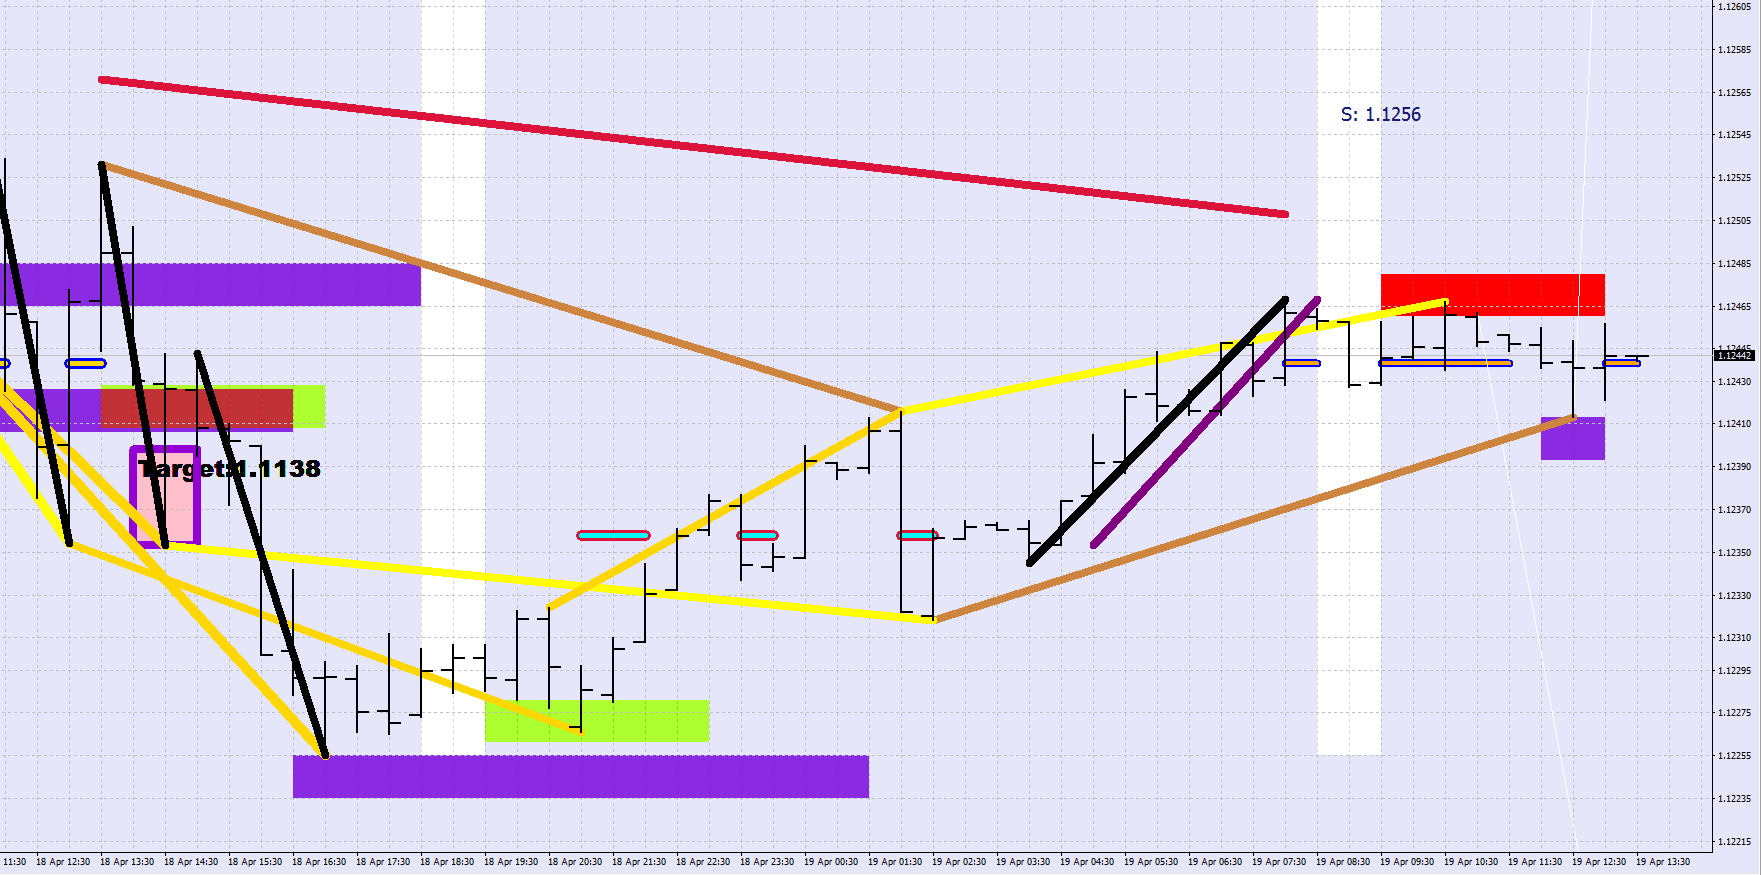
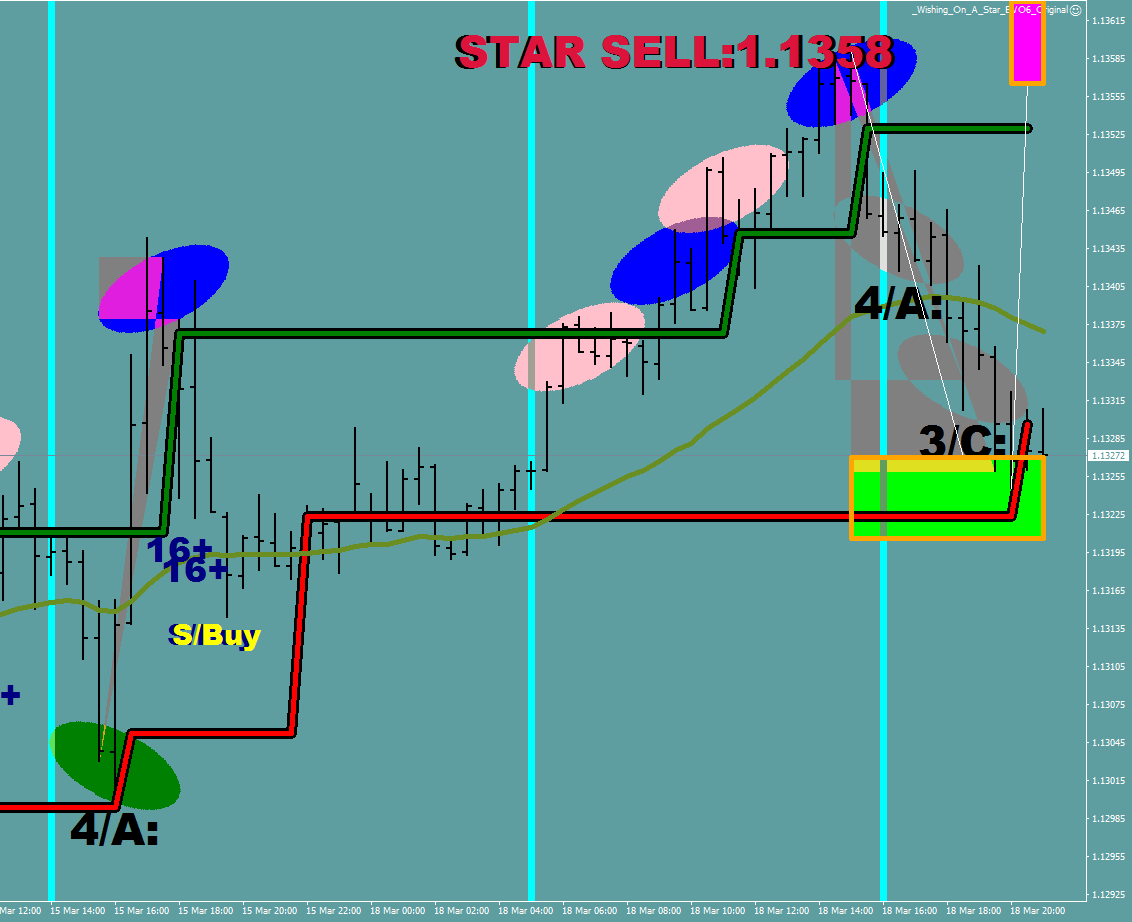
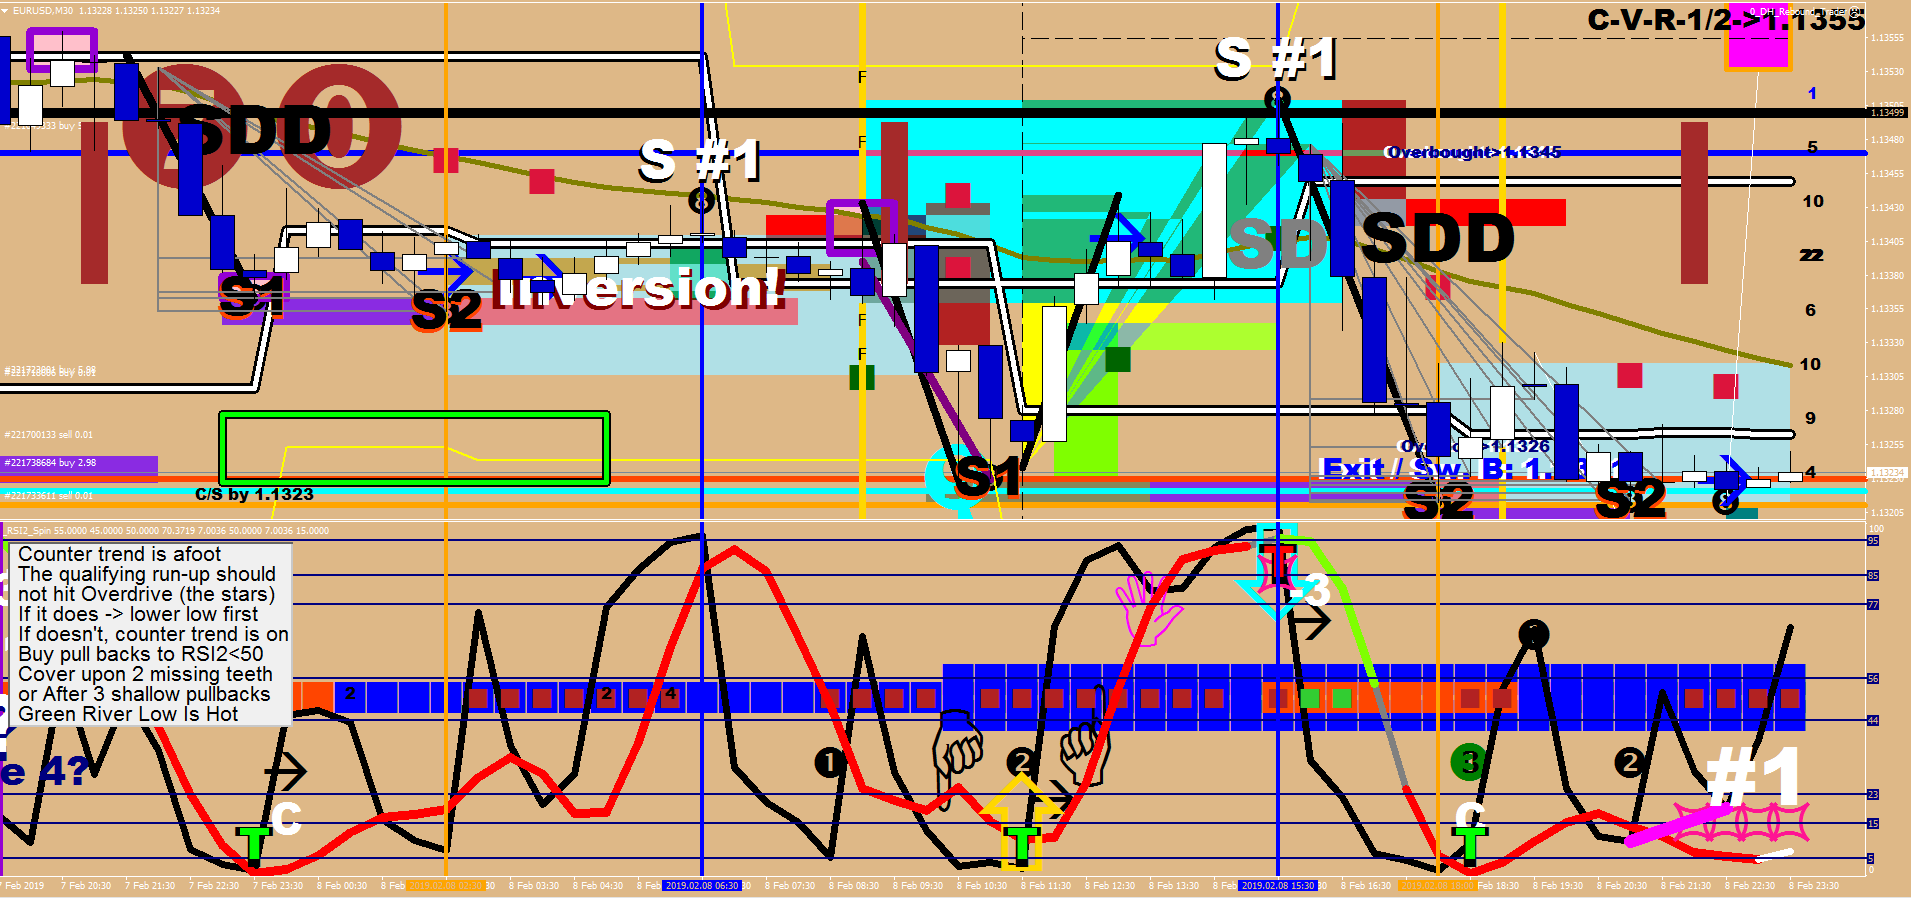
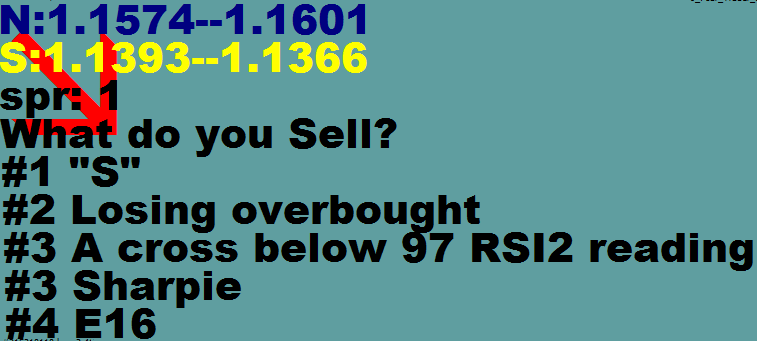
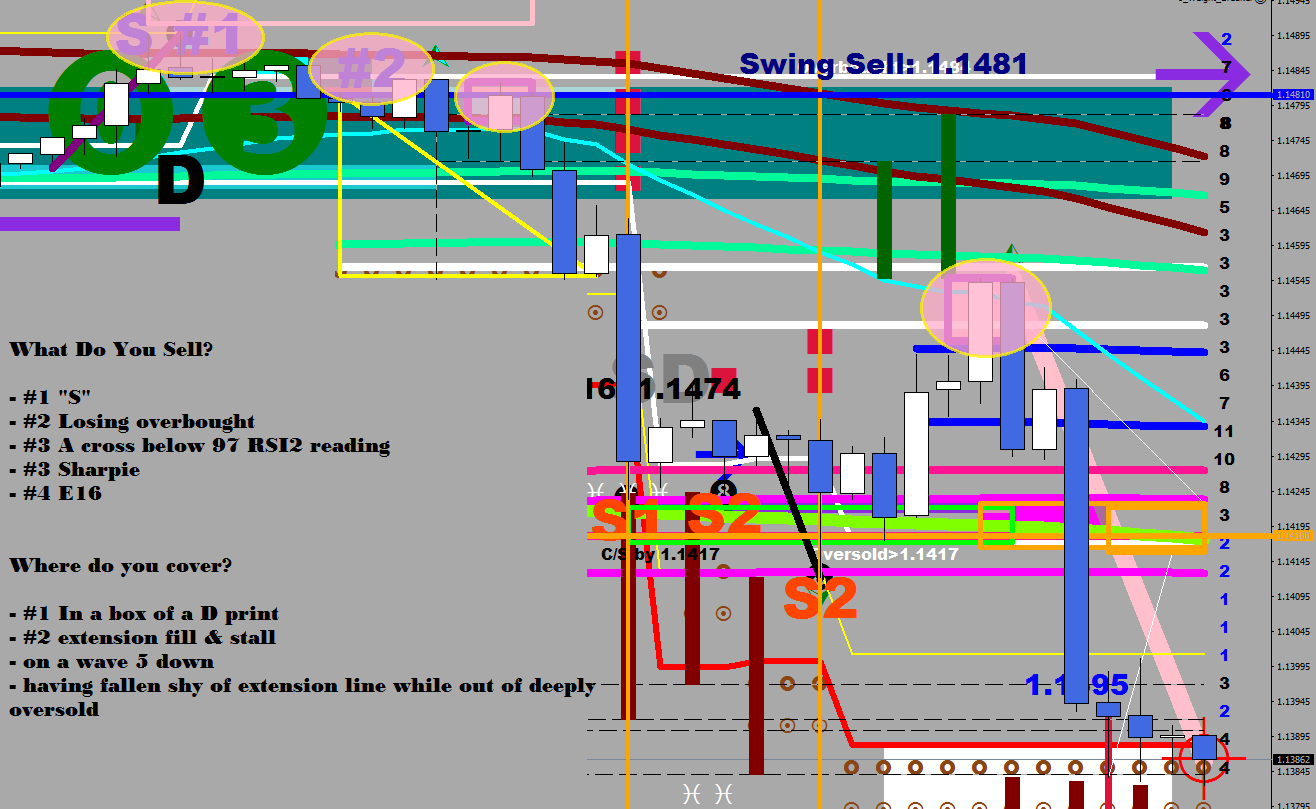
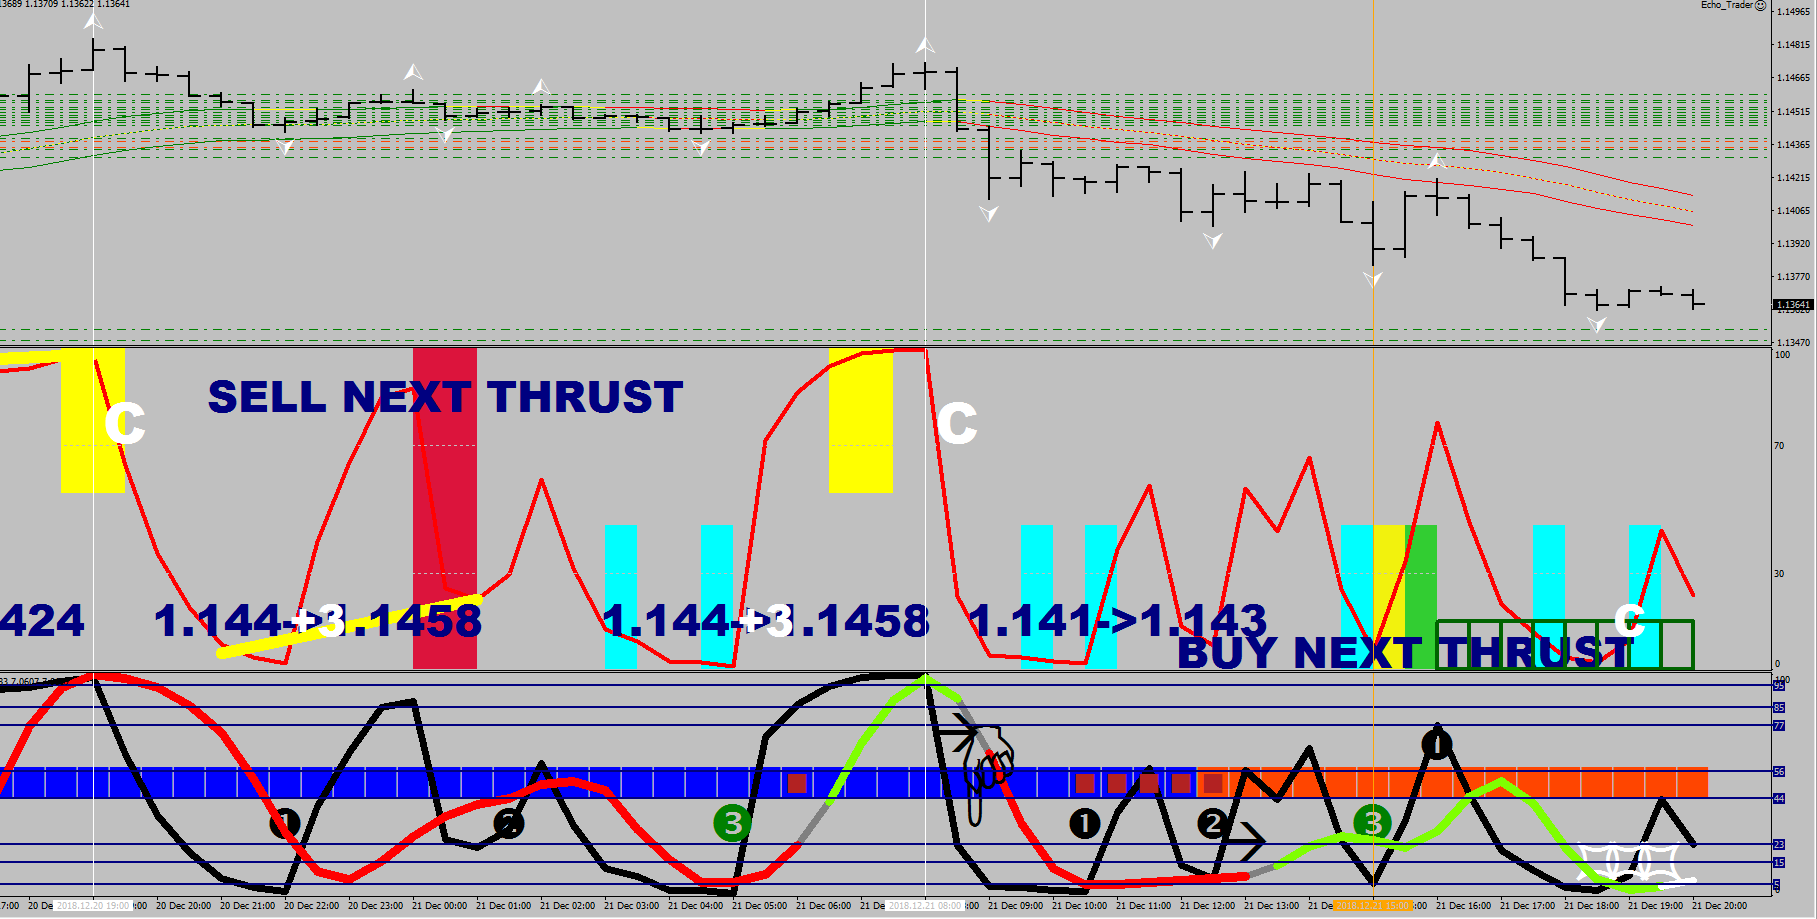
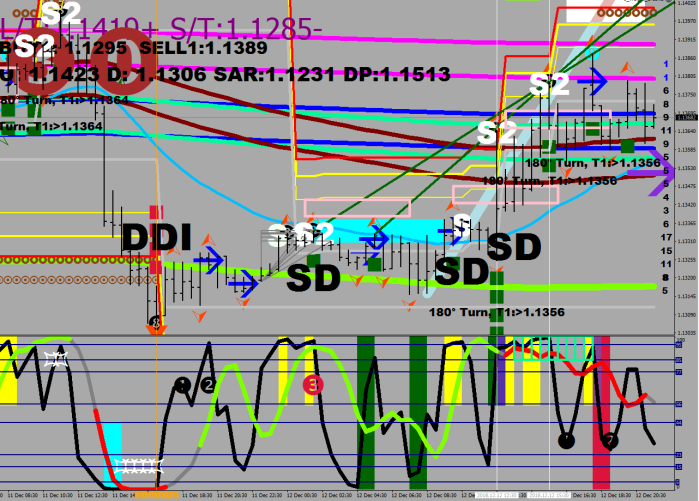
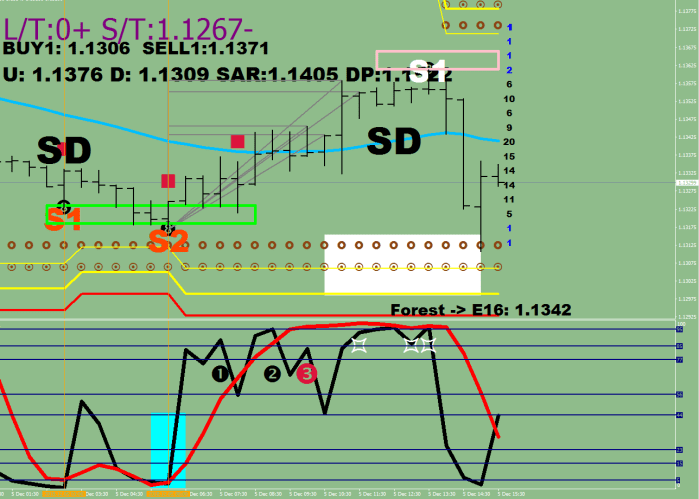
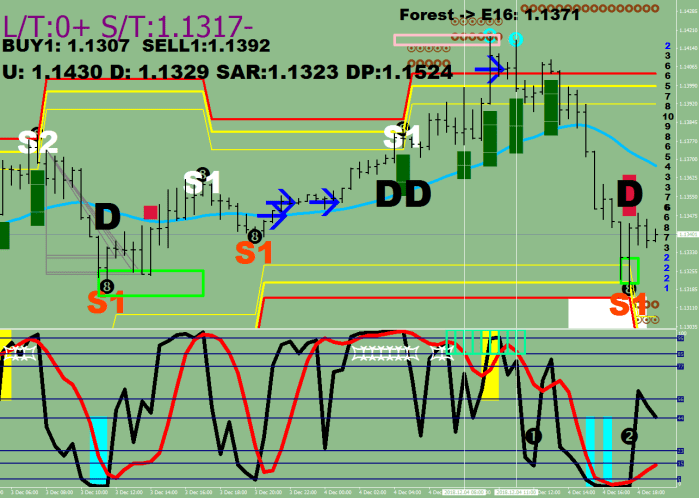
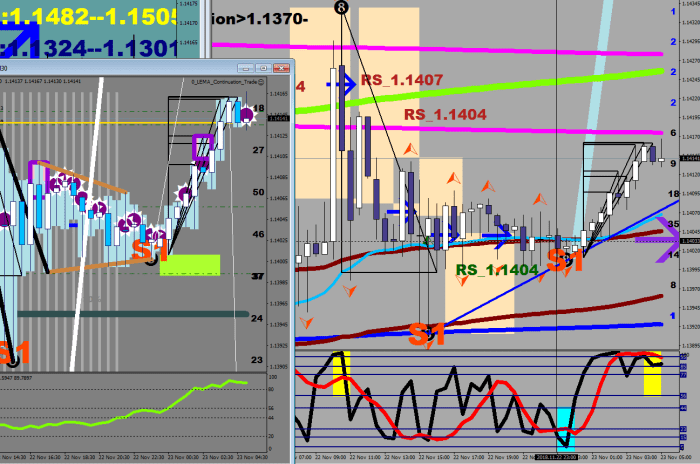
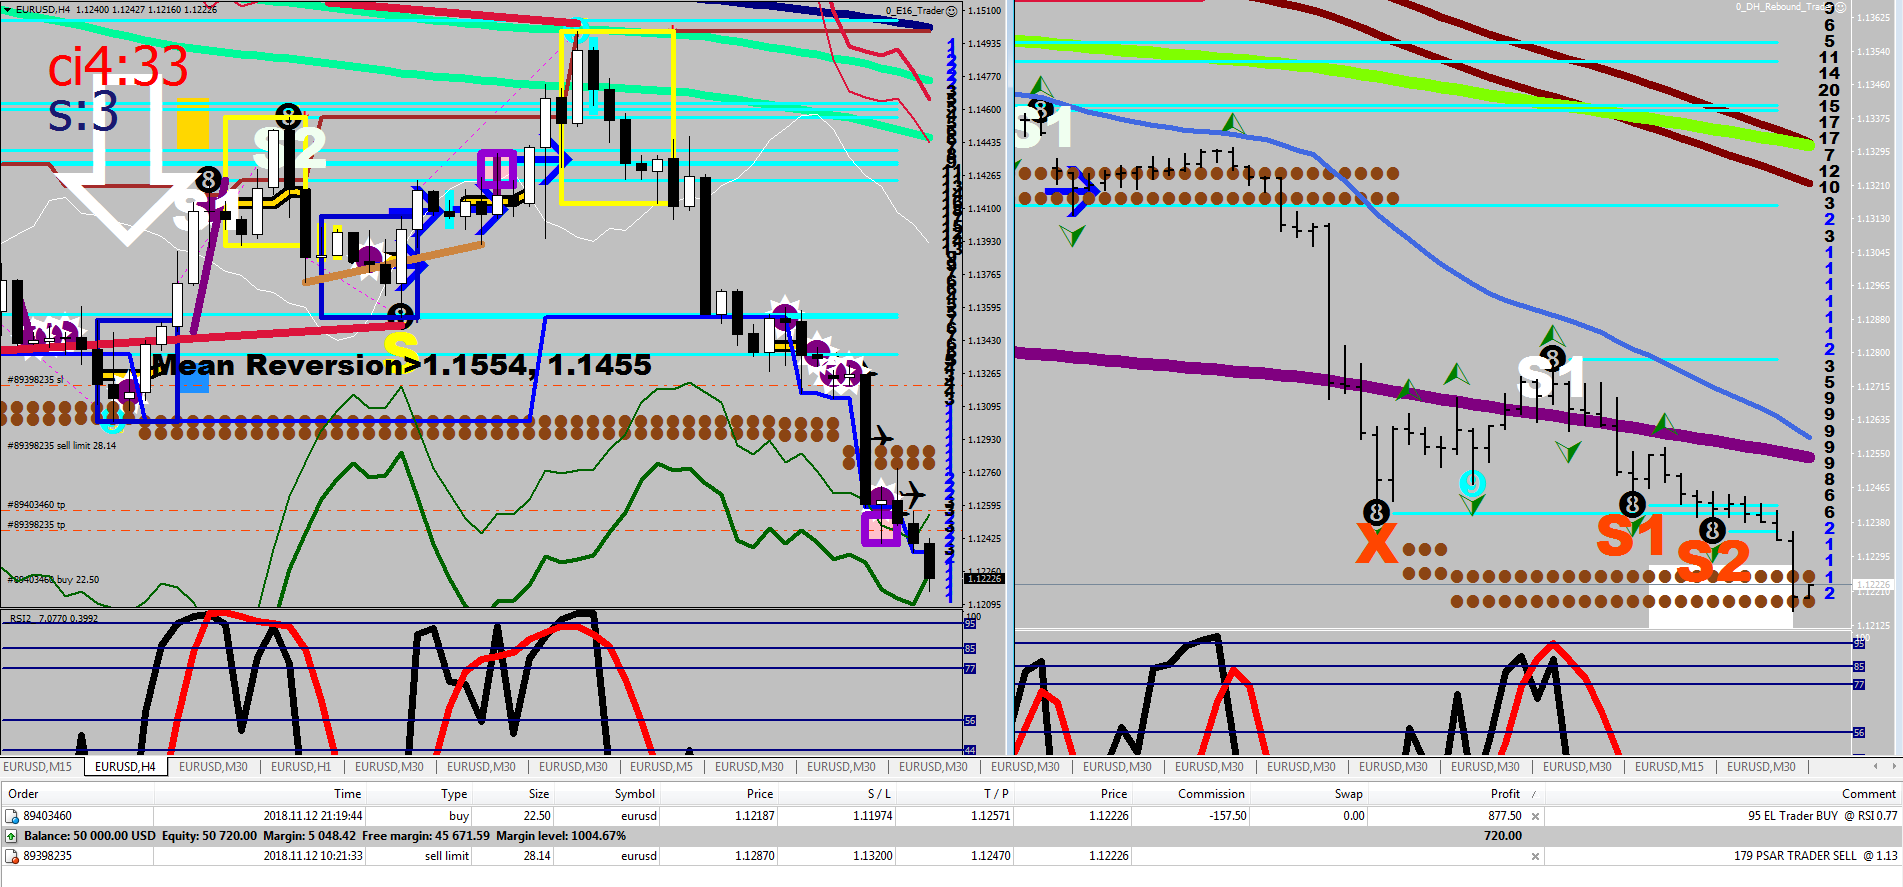
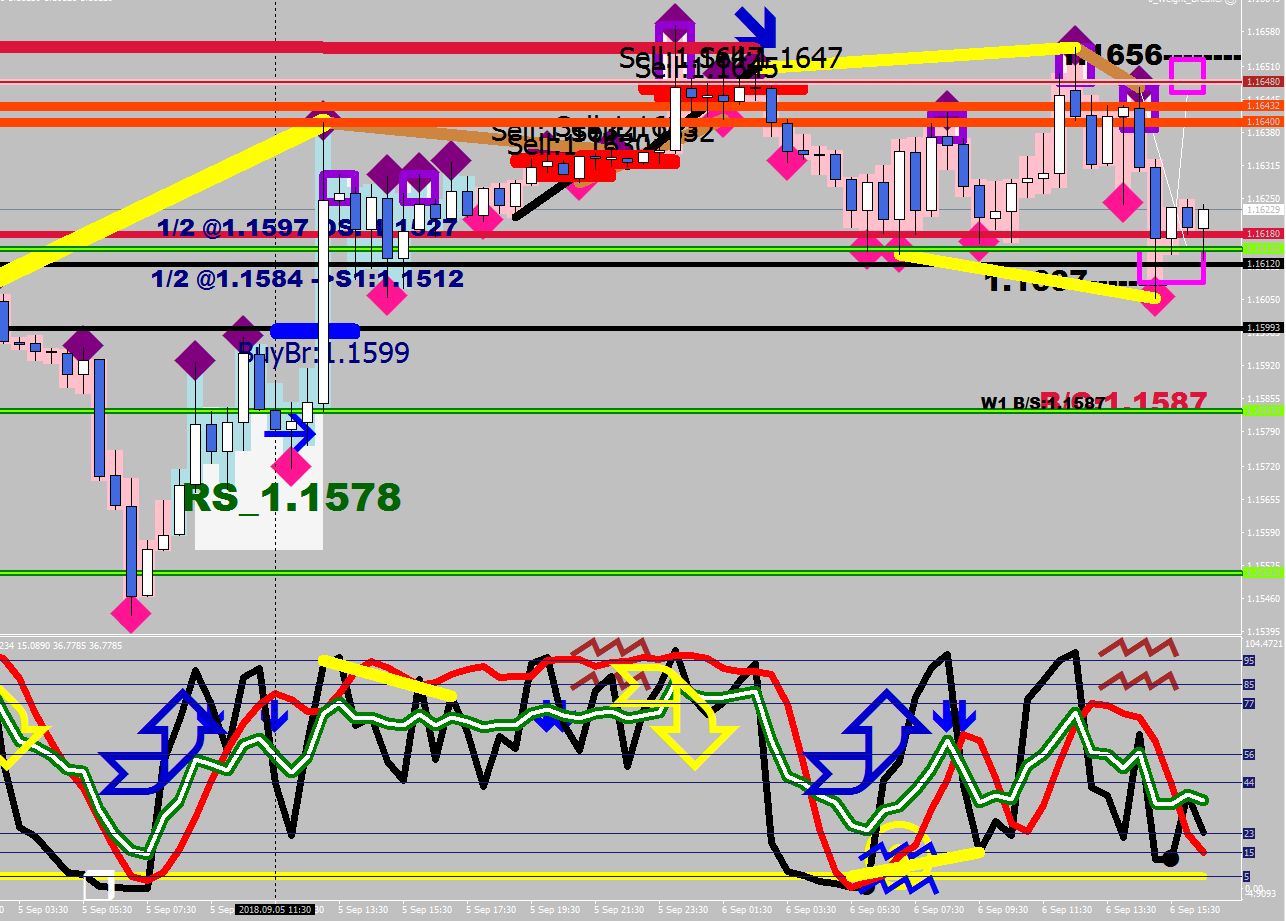
…below the Forest to E16 call, like I mentioned. The DDI should had resulted in a thrust. It was sold into instead, on 4 different run ups (3 got quick turn / sharpie high lights on the image below – purple edge pink boxes). Intentions are clear.

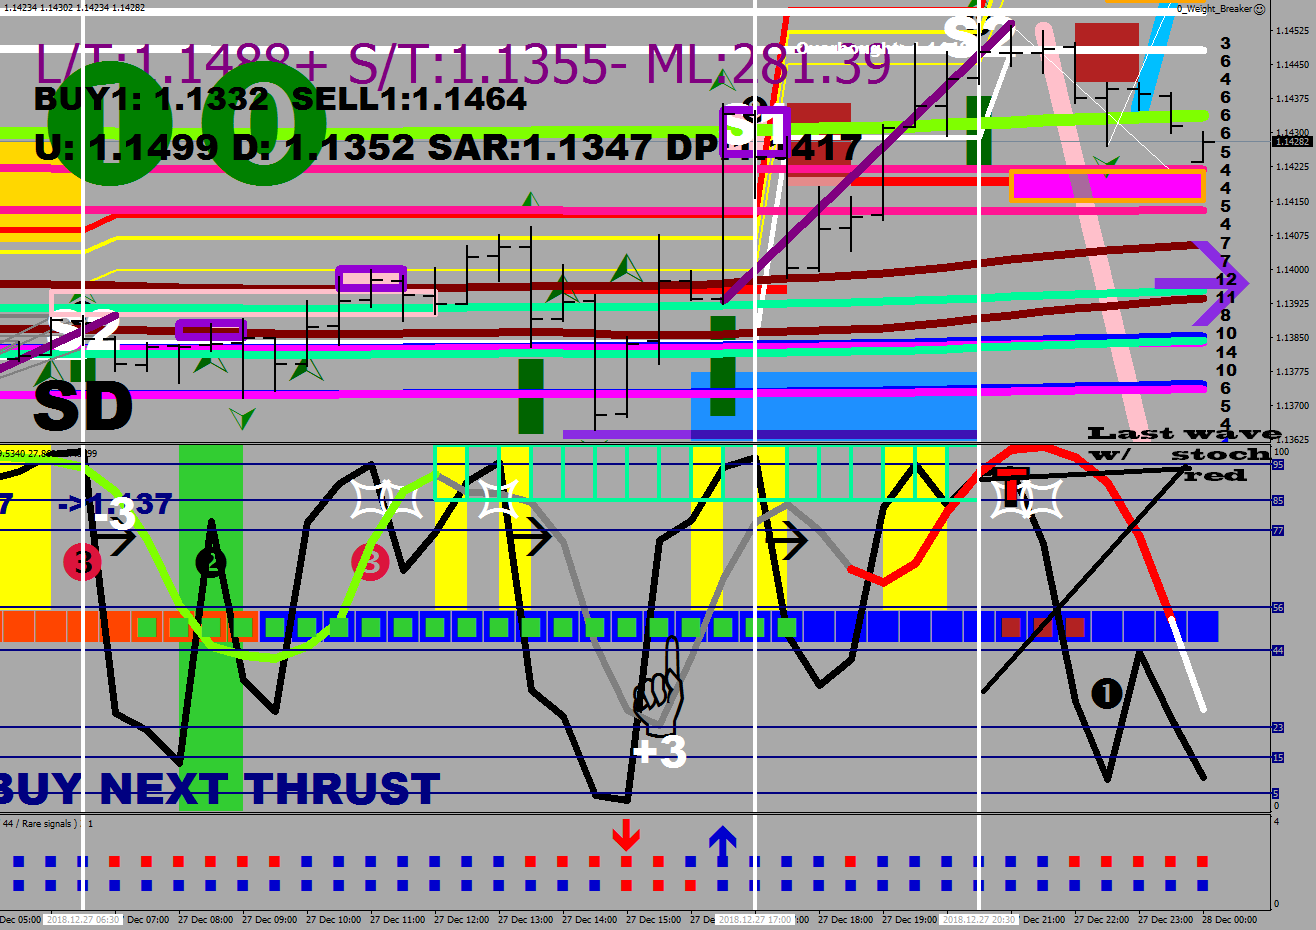
extract from 27/12/18
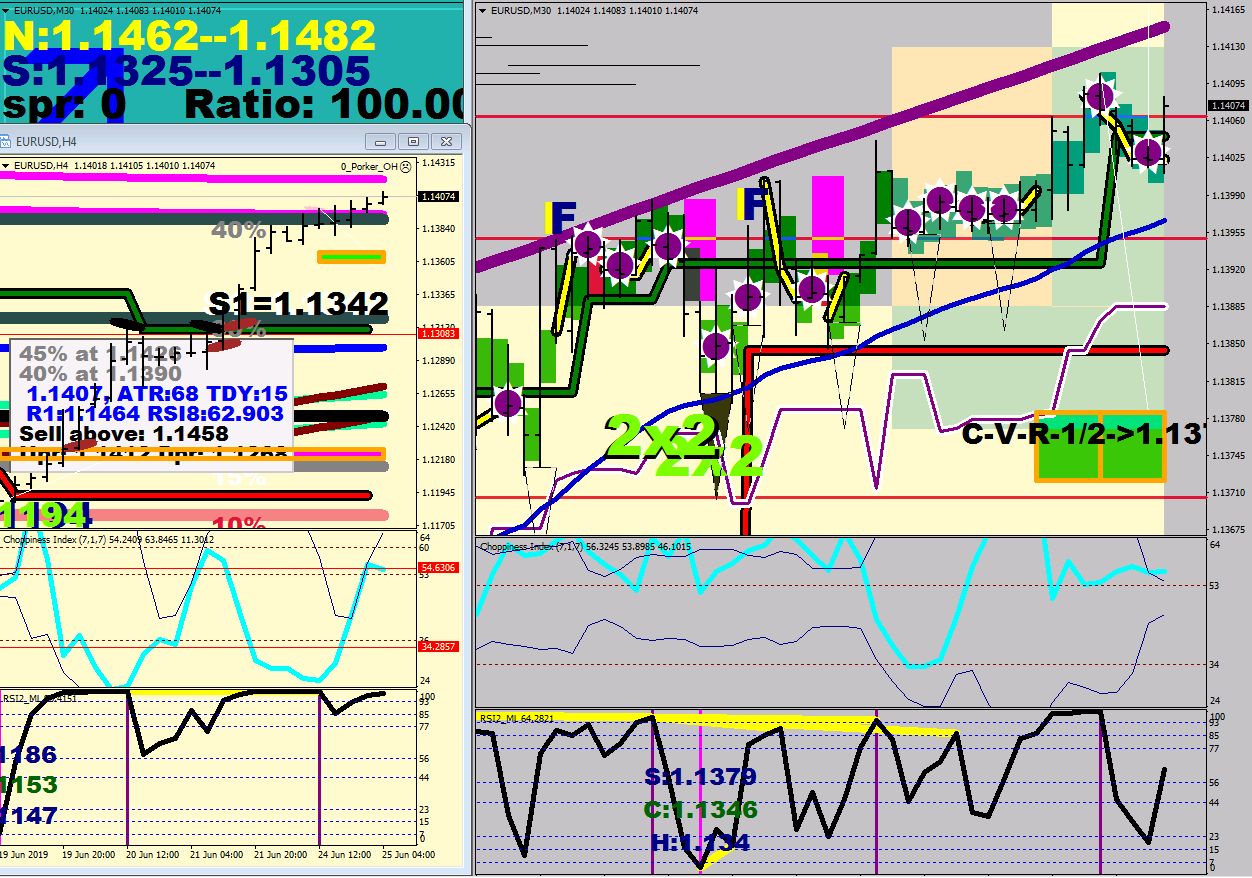
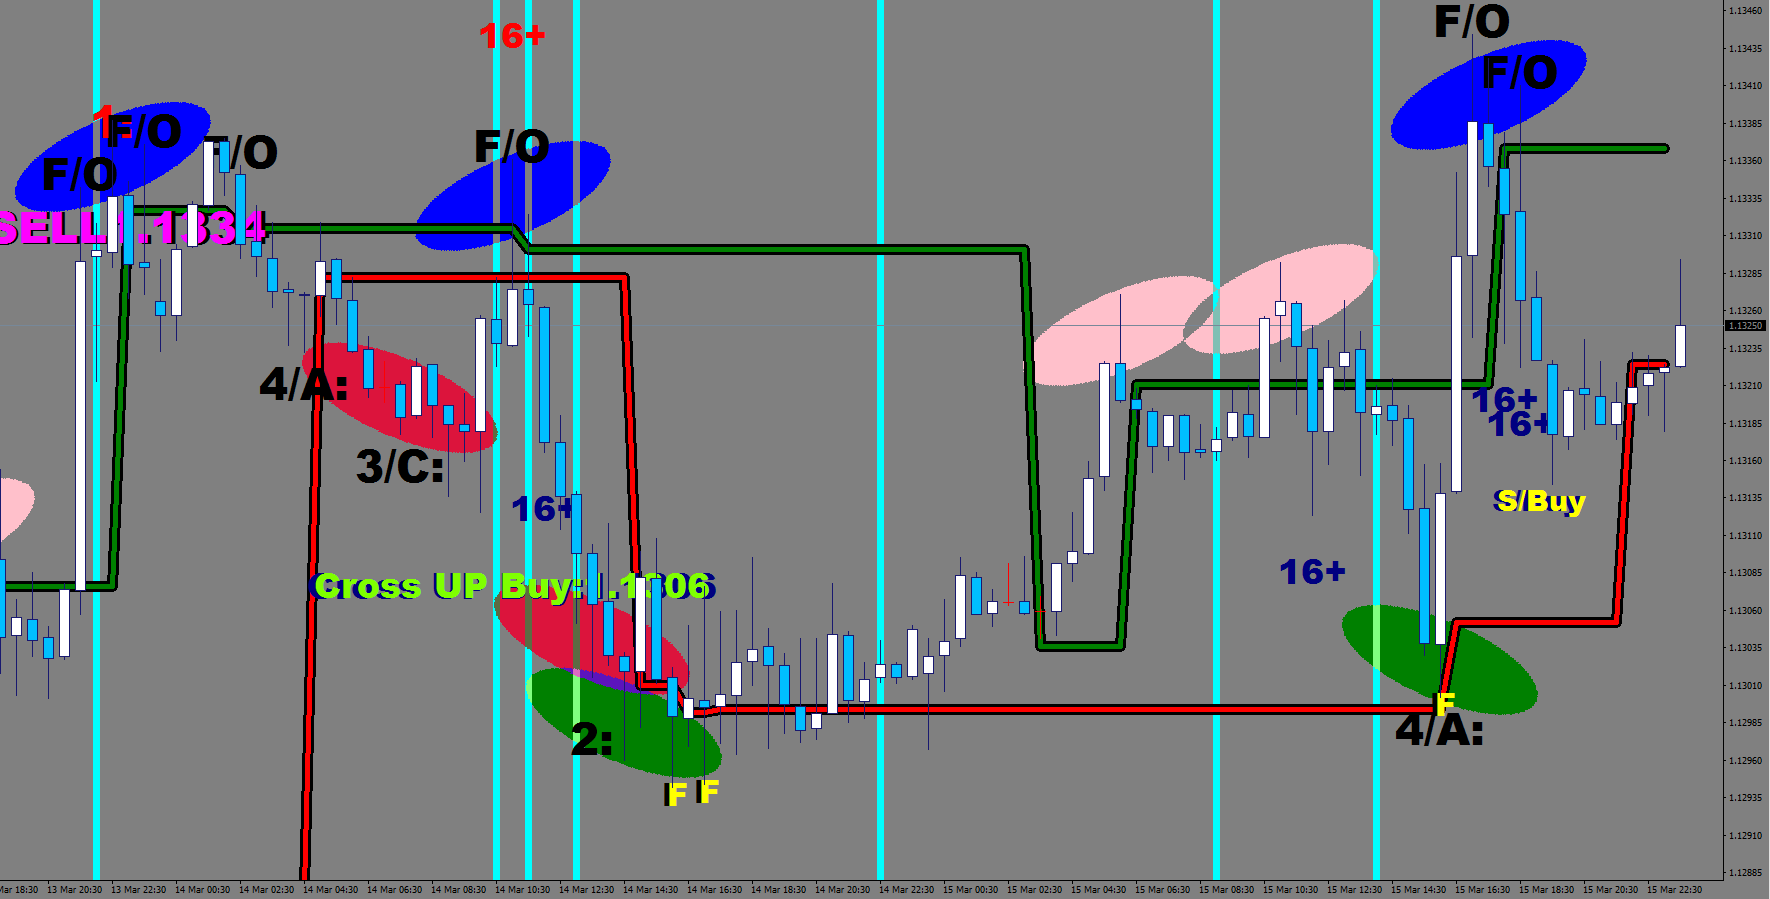
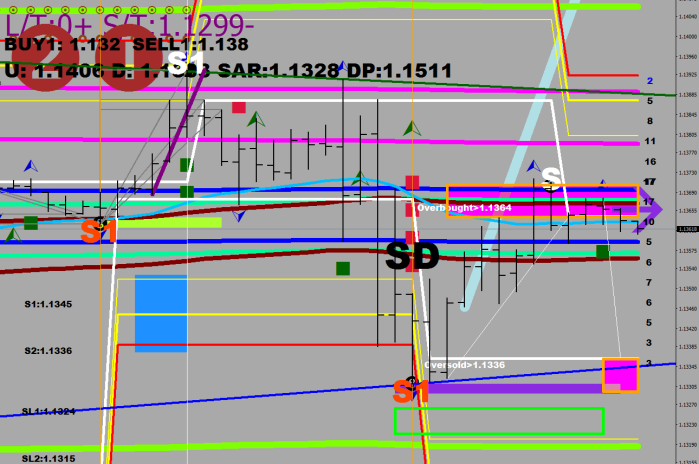
…Price hasn’t consolidated yet, and the SELL1 1.1464 was hit (see image). Another End Line print was made (a short one this time.) Oversold level got moved up by the dip’s fractal to 1.1433. Currently there is a Forest to E-16 trade happening. Market speed slowed to 4H. There is a DDI print now, which means that there may be a Crazy Ivan thrust to 1.15.
(A V-bottom was made earlier on 26/12 at 1.1342)
——————————————————————————————————————–
I am looking for a broker that has low raw spread on EUR/USD, can give me 200:1 leverage, has a commission that can leave something on the table at a 1 pip gain and is reliable (fills, pay outs, not carnivorous nature).
I had to eliminate LQDFX for it was blocking my hedging operations in 2 different ways: it had a liquidity issue for not letting pending orders to be put out in a close proximity, and had a very annoying 99 lots cap on sizing, which rendered my 155.09 lot hedging call non existent/
I am currently testing IC markets.
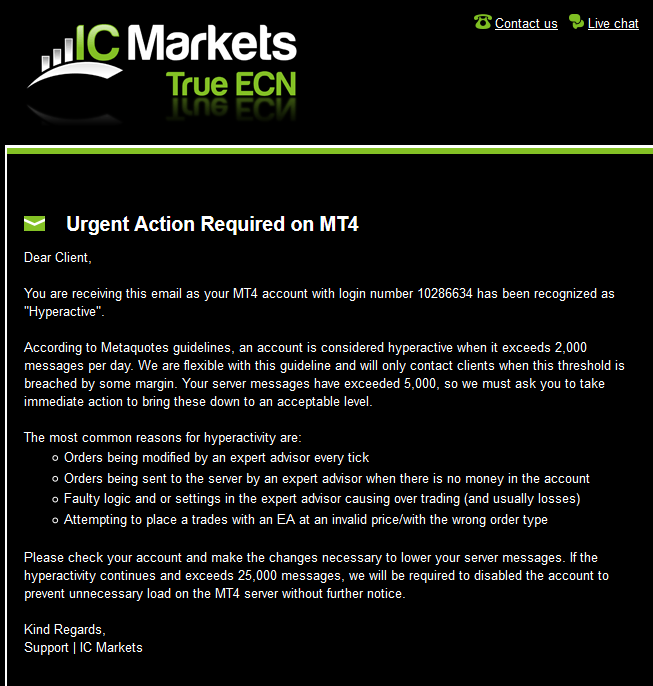
So far, I don’t like it.
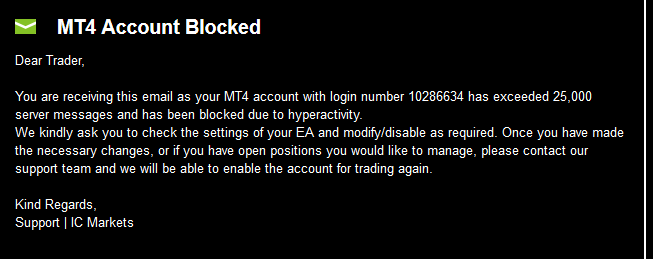
This broker had a 200 lots limitation – which was not the major issue by itself, but it kept on giving me 500,000 size demos instead of 50,000 and all my sizes are derived from the size of the equity, so there were orders that already got choked because of the lot size restriction with this uselessly large account size.
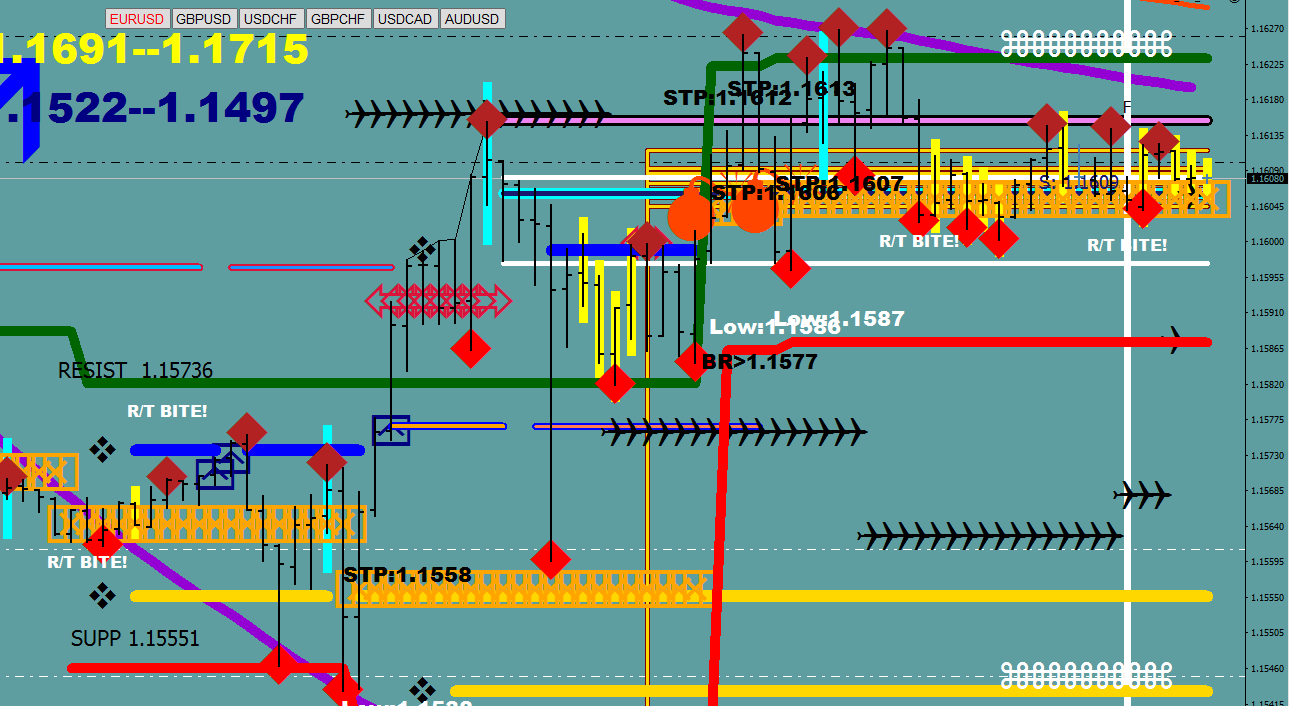
The following two images are being printed simultaneously by 2 different brokers. Please find all the 12,386 differences!


 14 days, 100% gains.
Everything you know is wrong…

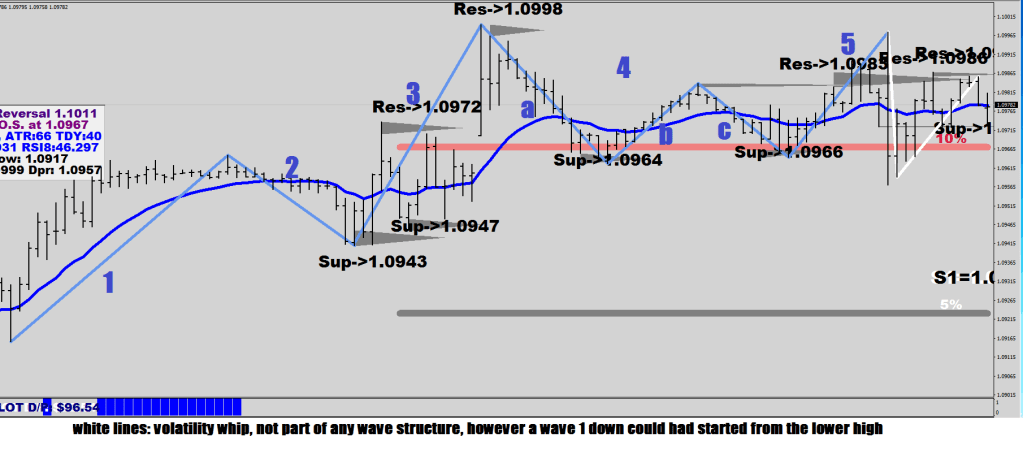
Not everything you see is a wave, in fact, the end of a move does not reach the status of a wave, ever.


& the 24h Market Profile is born (those numbers on the right, yes)


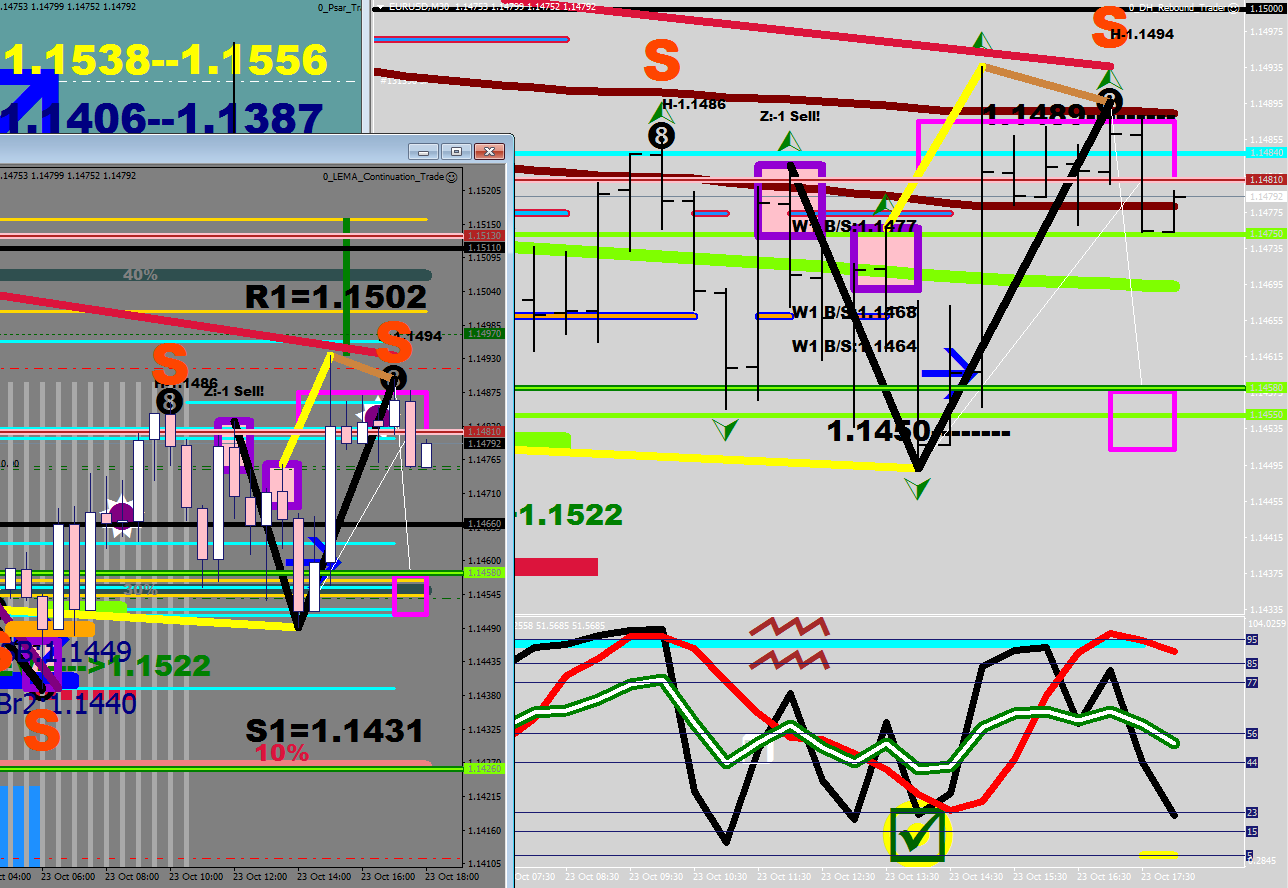
Daily Report 17-10-18
How much sabotage is not too much?
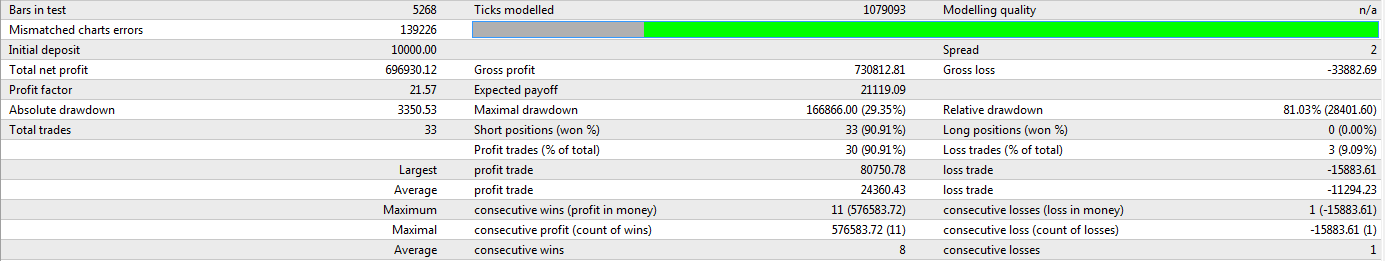
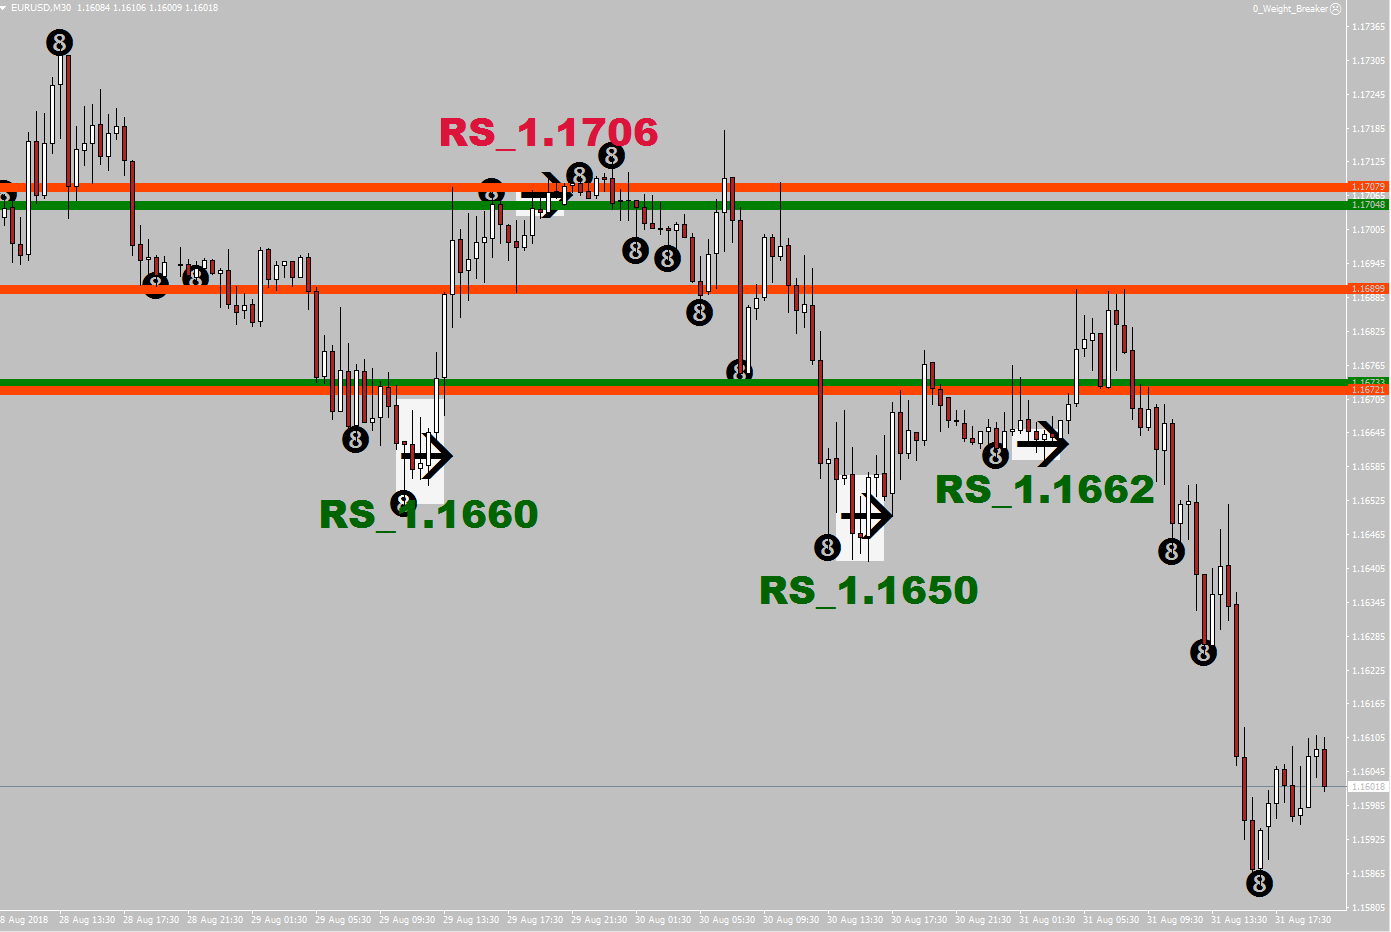
I already made the 96 End Line trader routine exempt from the 2.5% capping, but today there was another routine that would had gone to target if my cropper was not sabotaging it, and it could had made 7% gains by itself. From now on 93 Weight Breaker would get 7% cap along with the fore-mentioned 96.
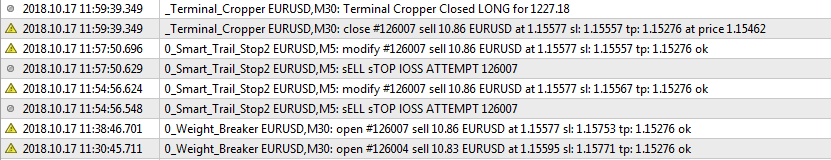
The other 2.5% gainer was a new routine that I just thought of yesterday and coded it right before it got its fill yesterday at 21:34 GMT. The first fill was stopped out with 1 pip, and it only showed a negative balance because of the Swap arriving for an Euro long at the 10PM re-balancing.
It now has a filter not to put out trades after 9 PM, which effectively rules out Sunday opens. I also added a minimum 4-sample size restriction.
5.07% is today’s gain vs the uncapped run’s 9.5% potential.
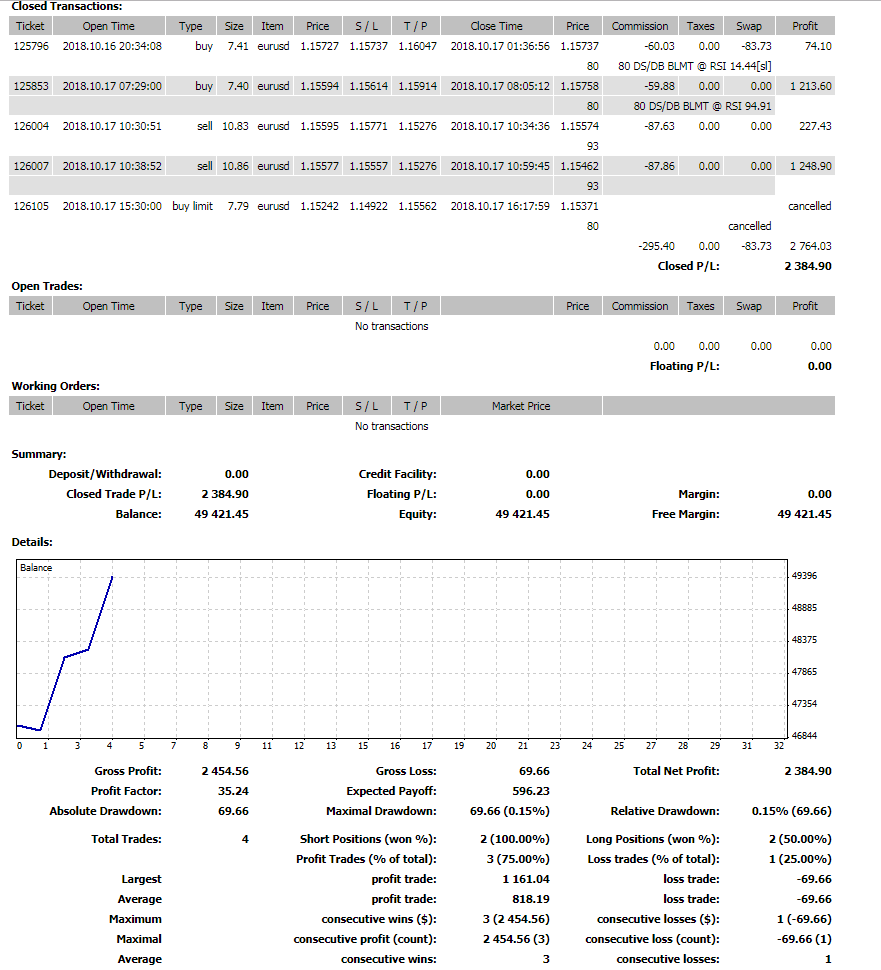
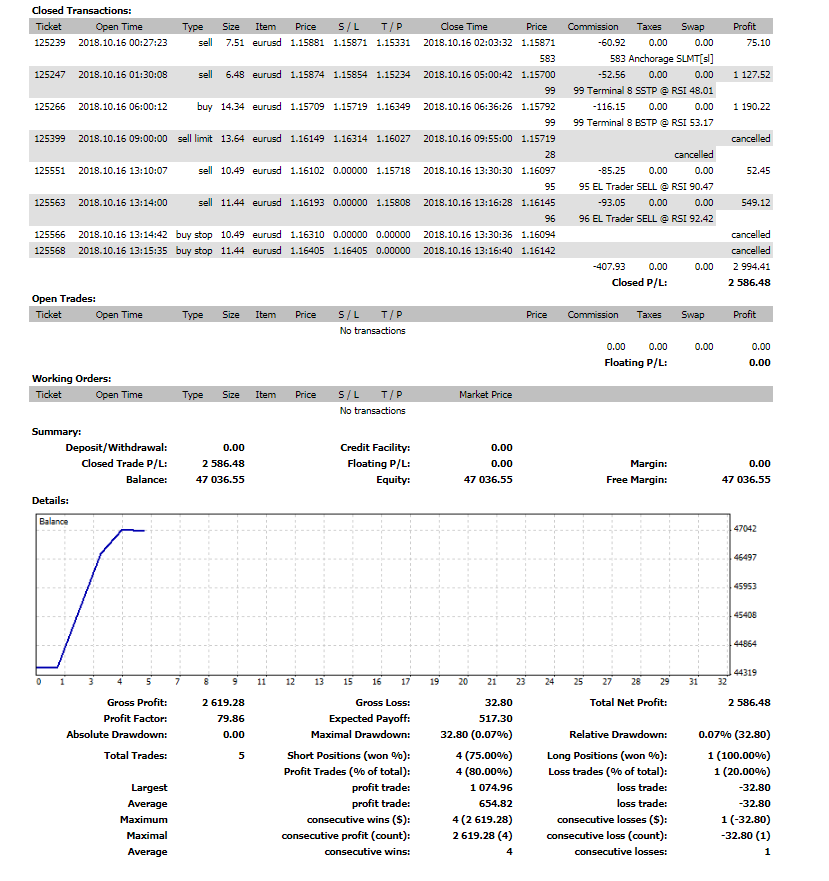
Daily Report 16-10-18
99 Terminal came across twice, in 2 different directions for capped maximum profit of 2.5% each by 6:36 AM GMT
Did not have to lift a finger, and I should had refrained from button pushing for the rest of the day as well, for the next two trades would had gone to the capped maximum and the bottom line would had come to a round 10% – which still was not the full potential. There was another 18 pips available if the 96 routine was made exempt from capping and it went to its target. Exception is now registered.
13%-14% was the full potential of the 5 executed trades.
I closed the day with 5.81% gains.
Daily Report 15-10-18
Today was a slow day.
I decided on writing a routine that exploits gaps above 1/2 Fluctuation size, and now this is part of the system.
The Closeline Ribbon (I lifted it off my shelves and dusted it down over the weekend) routine this morning was manually killed. I did not like the size, and slashed it to half since. I also increased the displacement.
The first trade of the day was placed by my
95 End Line Routine
After it locked in 1 pip first (that is still better than break even), it locked in 2 pips and ultimately was killed by the new cropper, for it exceeded 2.5% of the Account Balance with 1,078.56
The second trade was opened by my
99 Terminal 8 Routine
Less size, but the same play out; 1 Pips, 2 Pips and ultimately a crop – this time by a different cropper routine.
583 Anchorage was stopped out twice for 1 pip
and one time was killed manually at 1.5 pip – should have let it run.
One manual trade was placed, that brought the net gain to
1,665.83 or
3.917% of the opening balance.
90 Lema Buy was stopped out at 1 pip
and a second time manually for a loss of $9.88 loss to close out the day
Whilst the largest gain was 2.5%, the largest draw down never even reached 2%.
The close to 100% success rate is the expectation.
The art is not doing this once, it is doing this every day, regardless of what the market does.


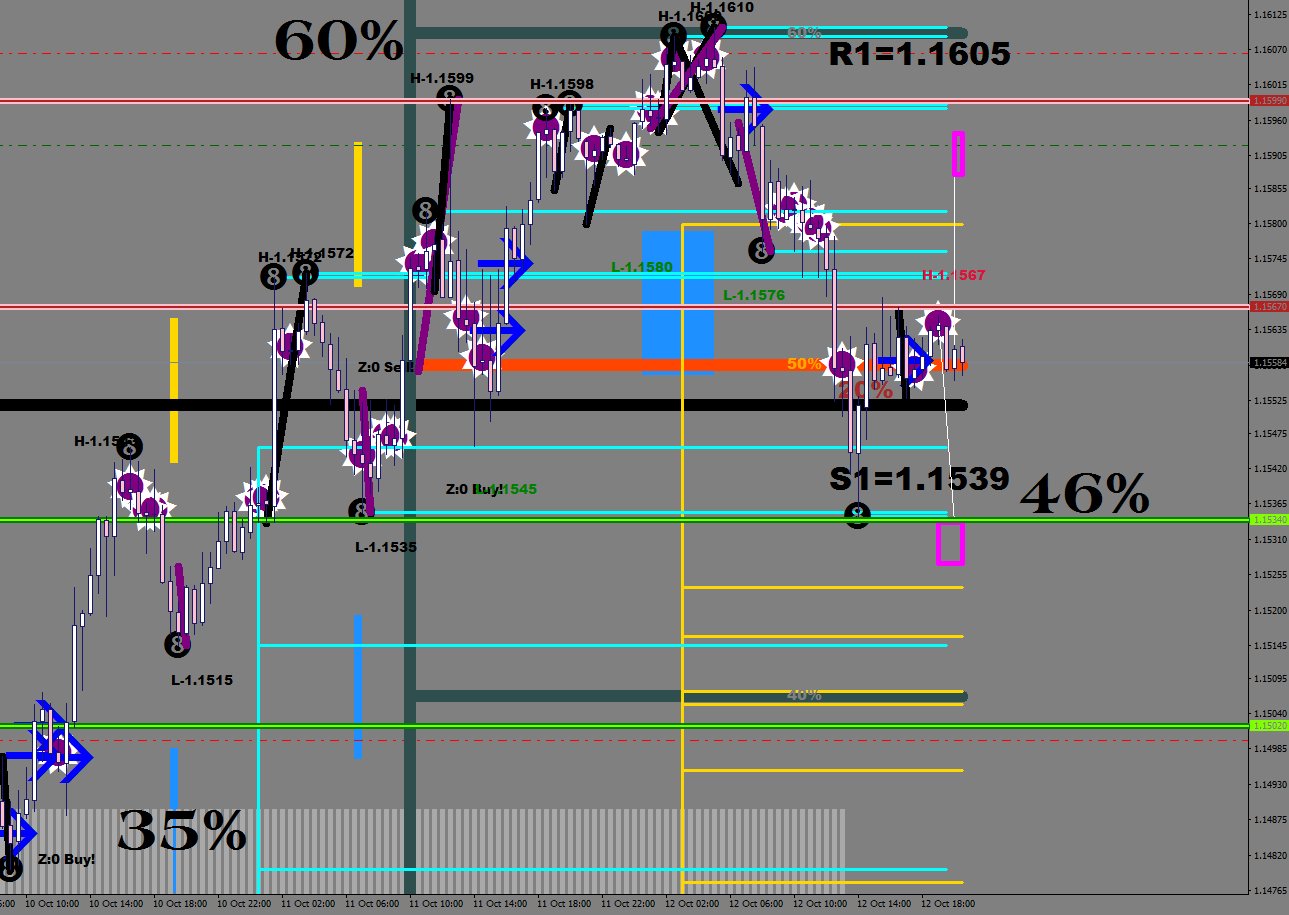
If leg A started at 35% and went to 60%, how high will leg C go to from 46%?
If your answer was Purple Haze, you were correct.

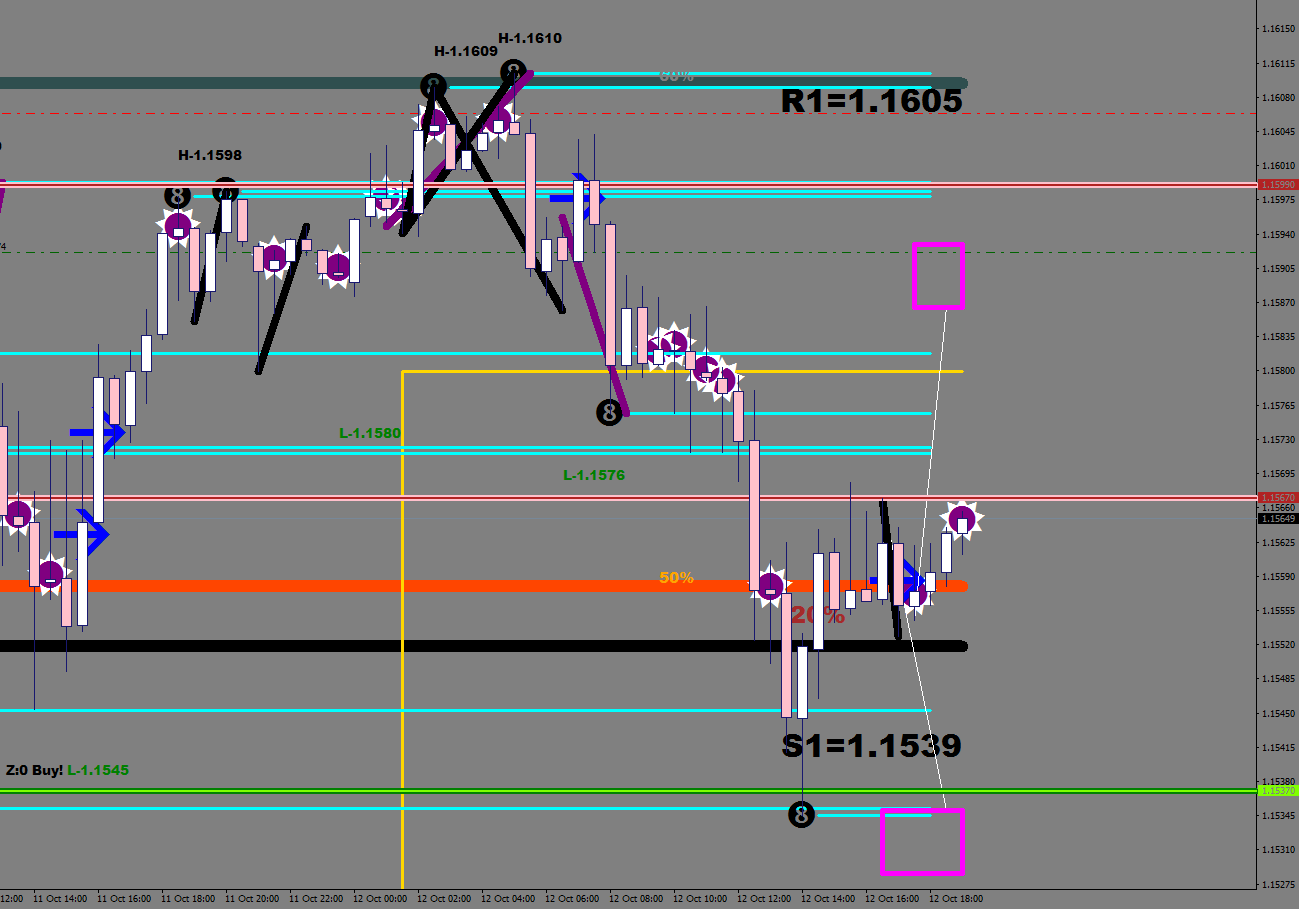

Purple Haze -> Guard Rail Marathon
Working on the book…
…your introduction to the quantum world: welcome to the concept where the market can make a lower low without making a break and can make a break without making a lower low. From now on, everything is relative.


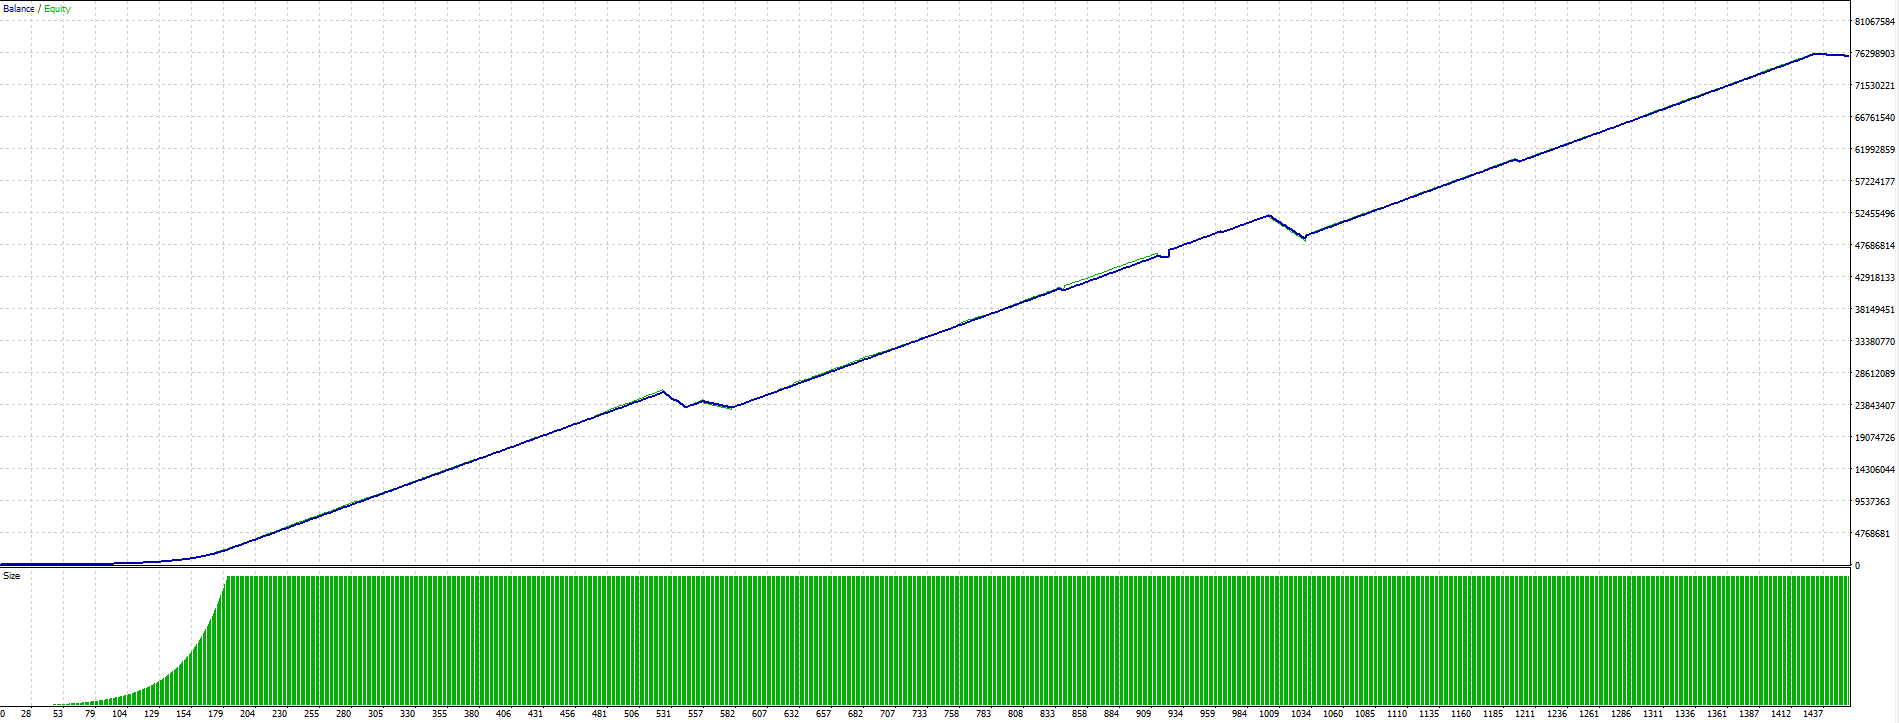

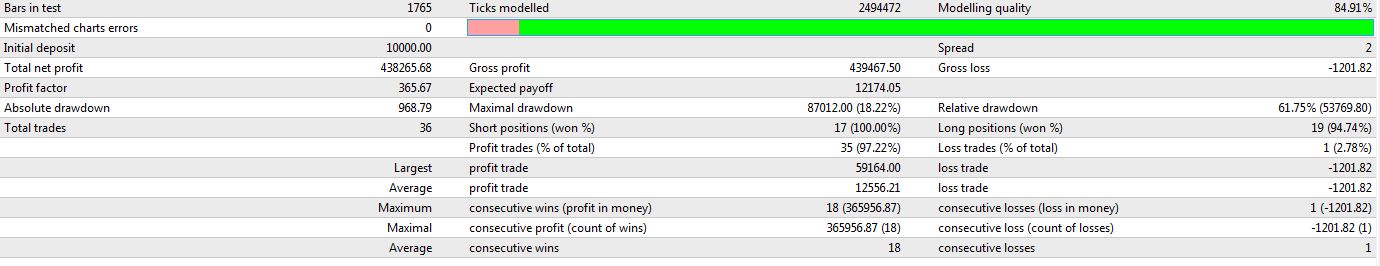
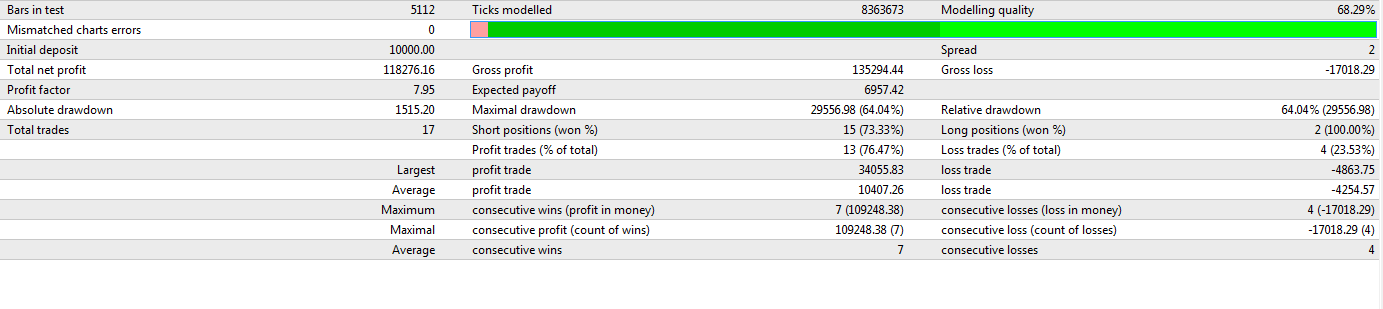
Profit Factor: 358

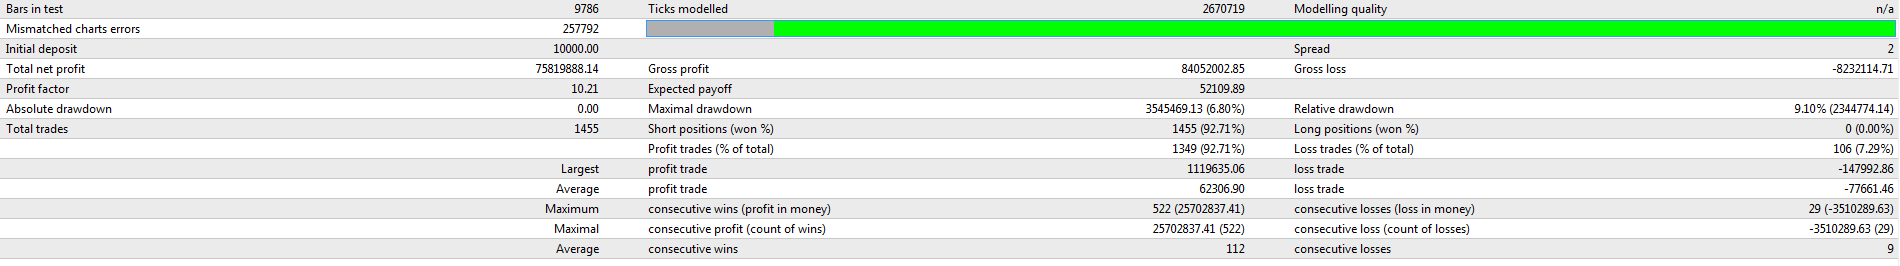
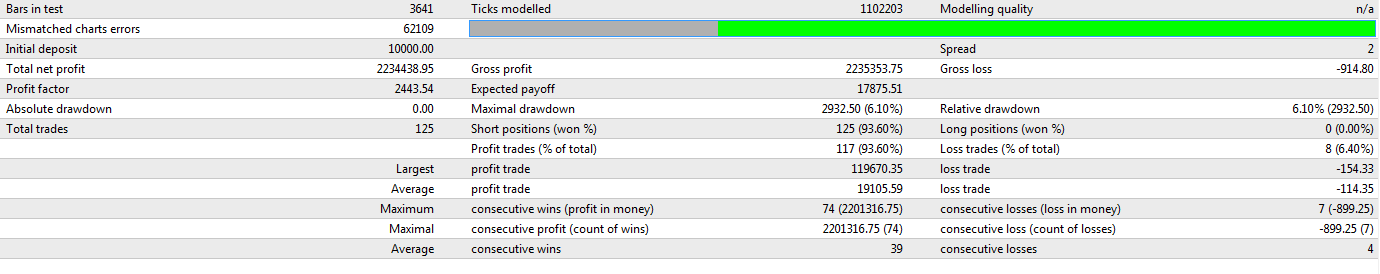
Profit Factor: 2443
999 lots limit obeyed

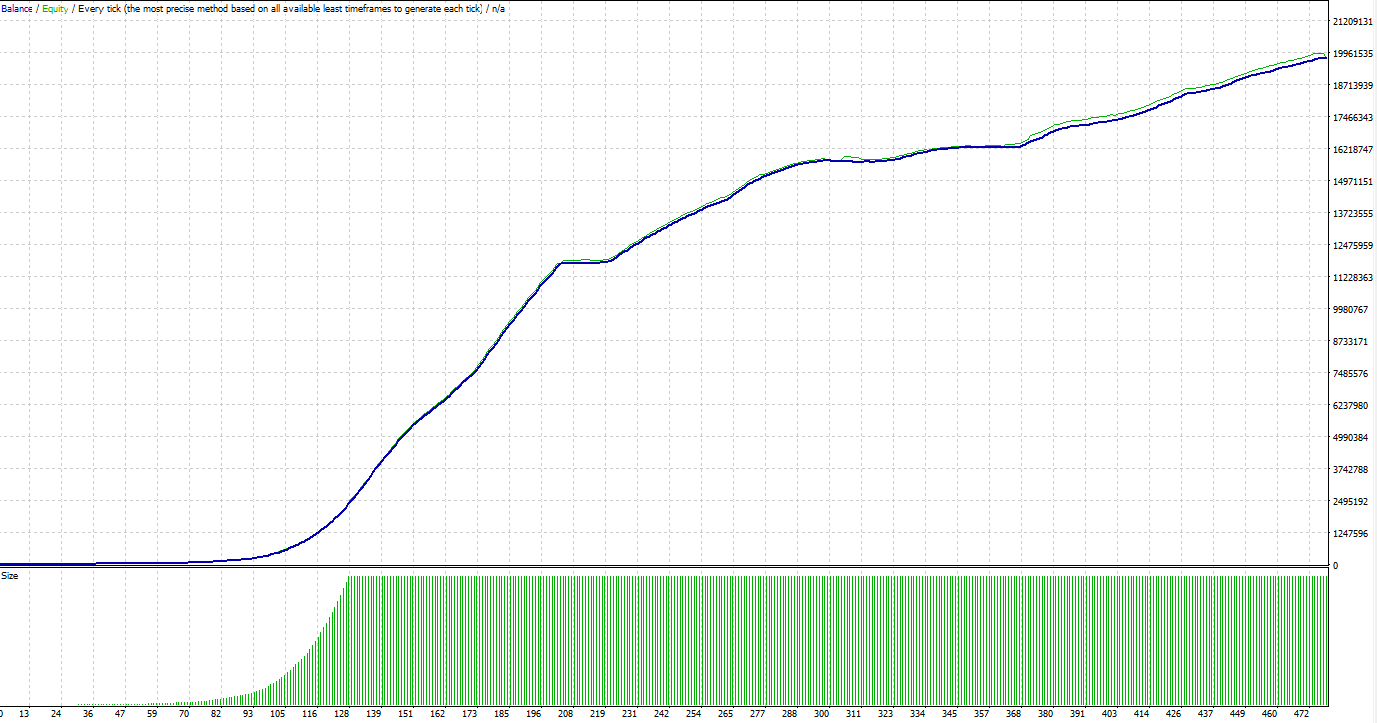
Profit Factor: 299


Despite of the malfunctioning trail stop, 8%+ gains again.


Anchorage Wild UGD fine tuning in progress.
Historical data loaded…
Testing…
5-months’ performance
88 Luftballons is being married with the Sync/Async plots in order to find H&S terminals.


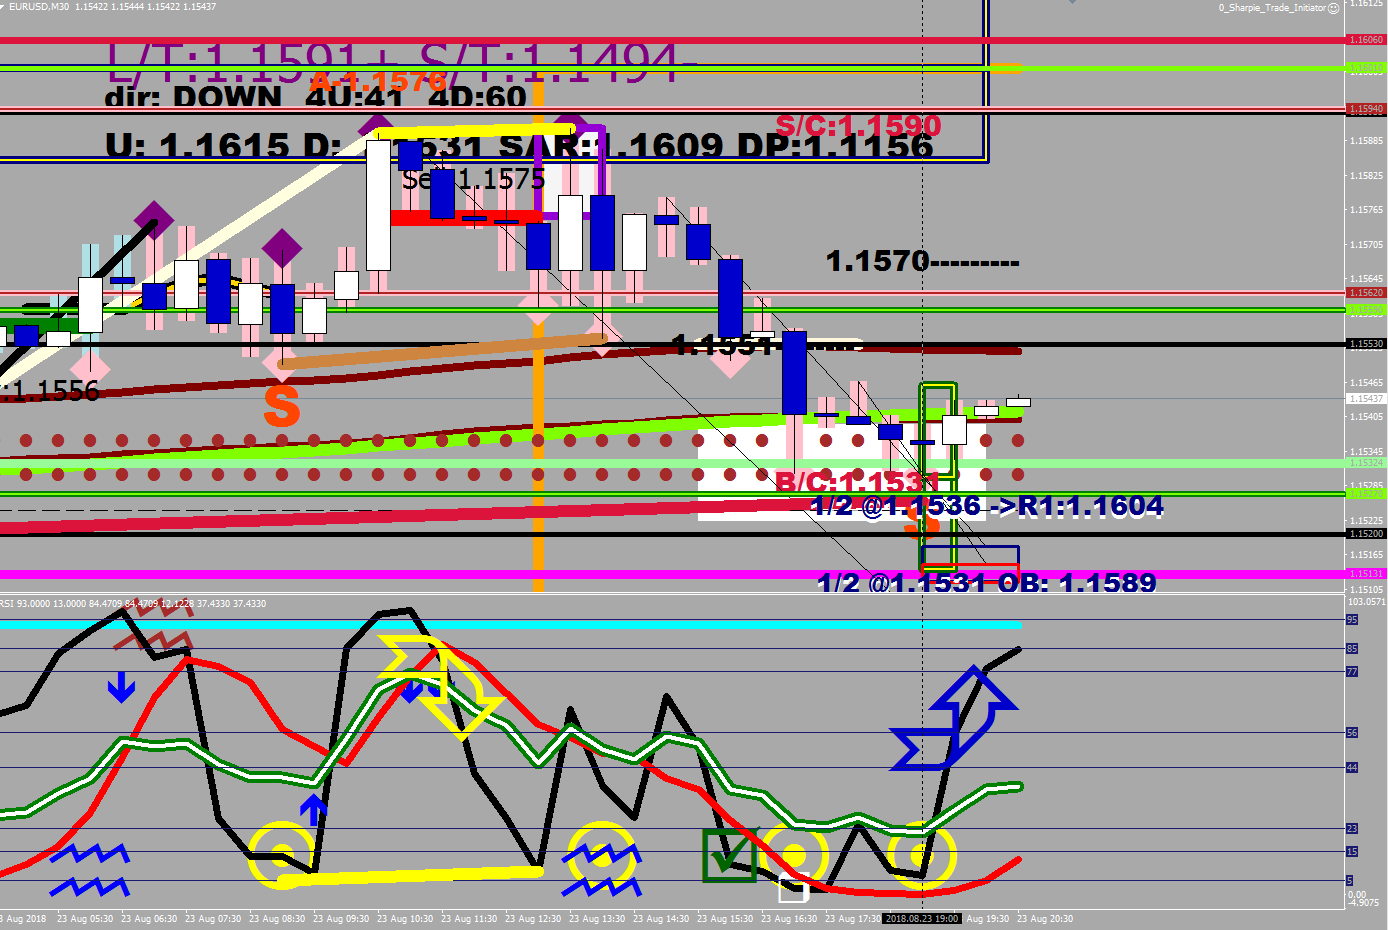


Calm and collected look, how to achieve it?
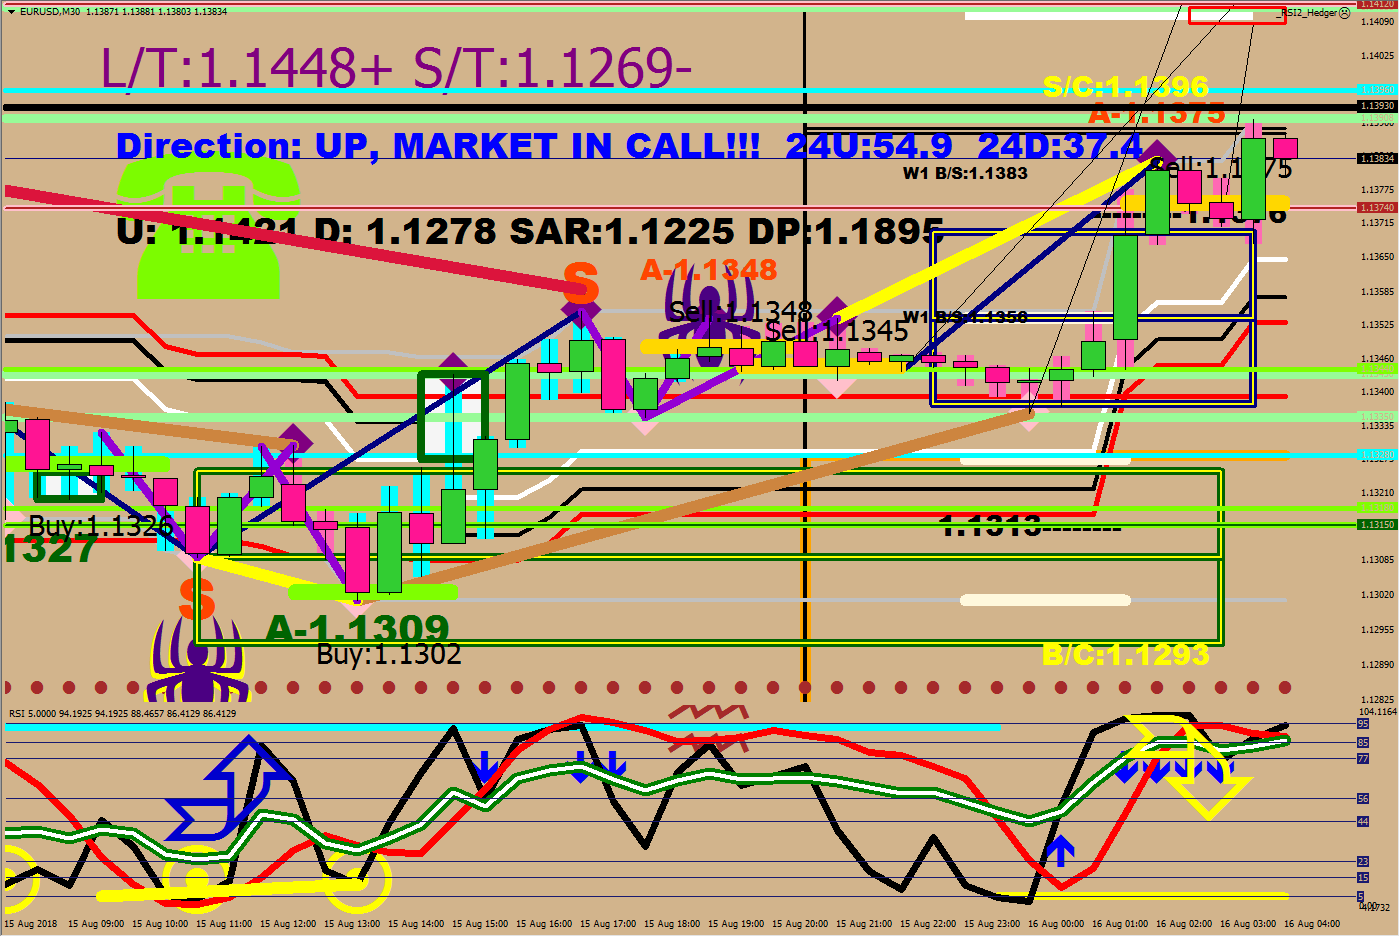
Market in Call
Sharpies, buy and sell shadings would be part of the God Awesome Indicator.

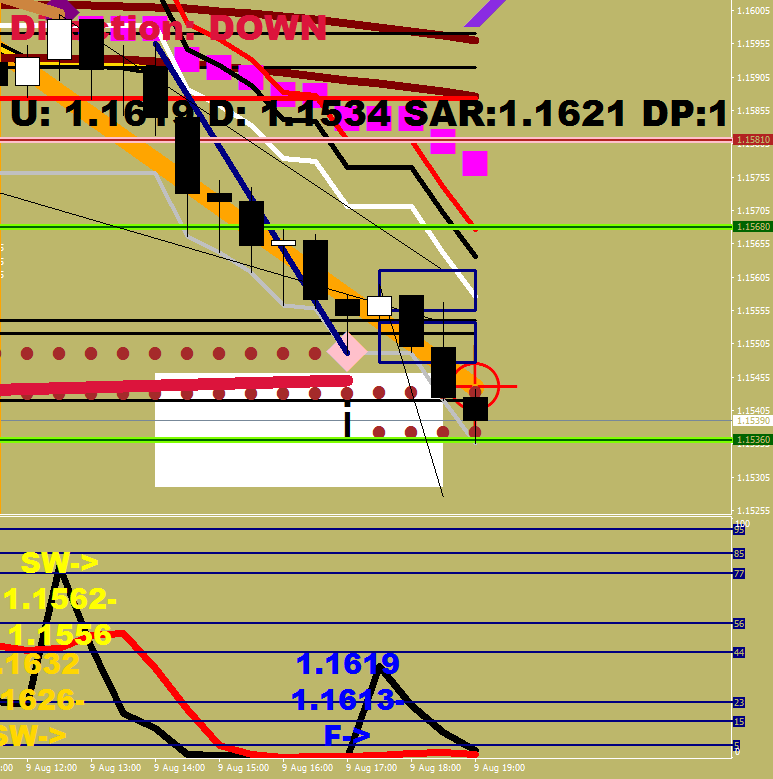
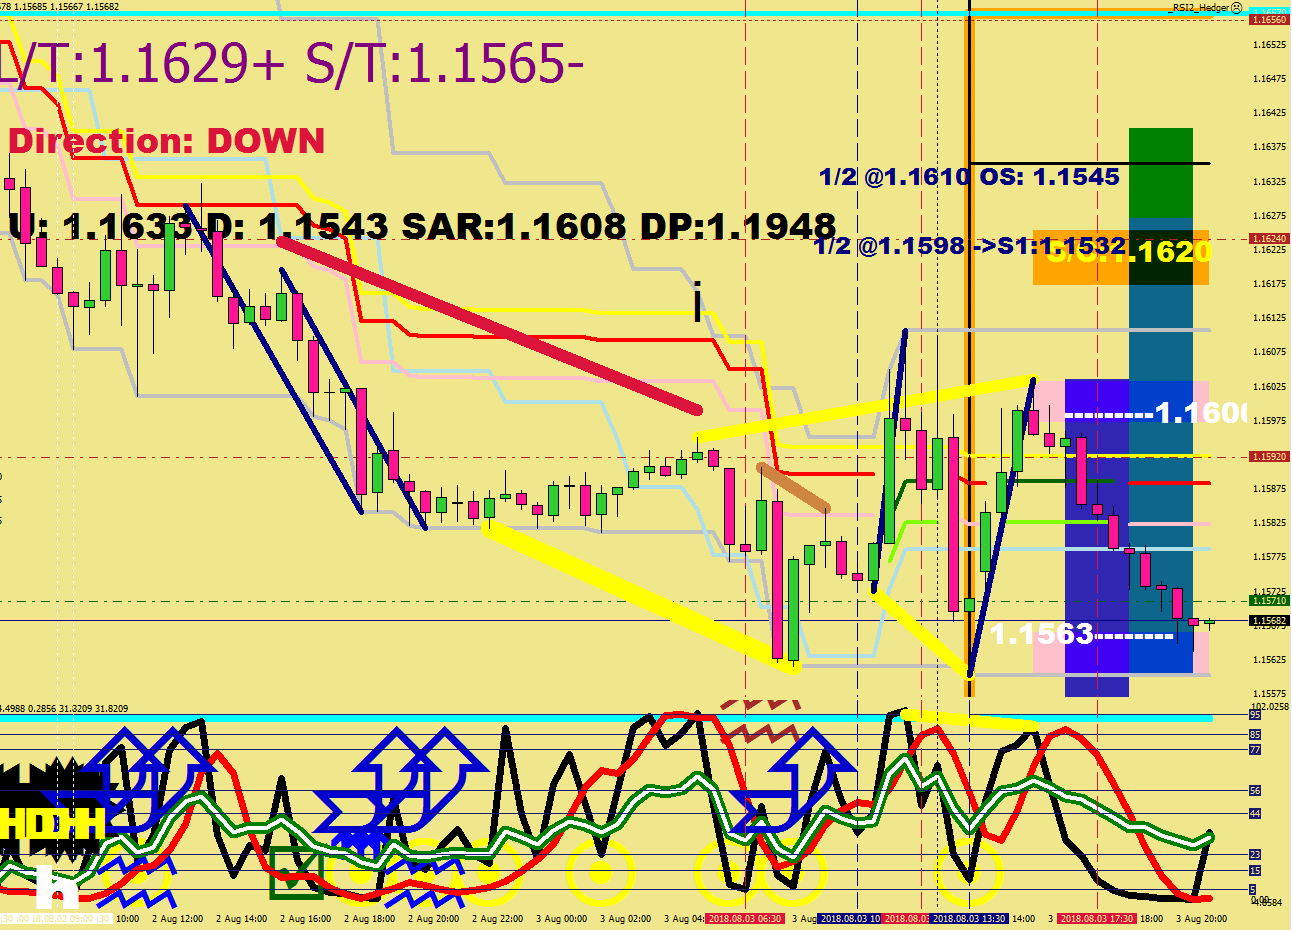
Until you get an up move that is greater than 33 pips, the direction shall remain down

The Short Wave sets the direction.
The No Break terminates the move.


3rd attempt coming up at the Green River.

Charm time.
Downside terminated for the 3rd time. Short wave + no break = reversal.
Working on the “God Awesome Trader”…

A classic picture to the archives:
“Sleight of chart direction”
No break happened.
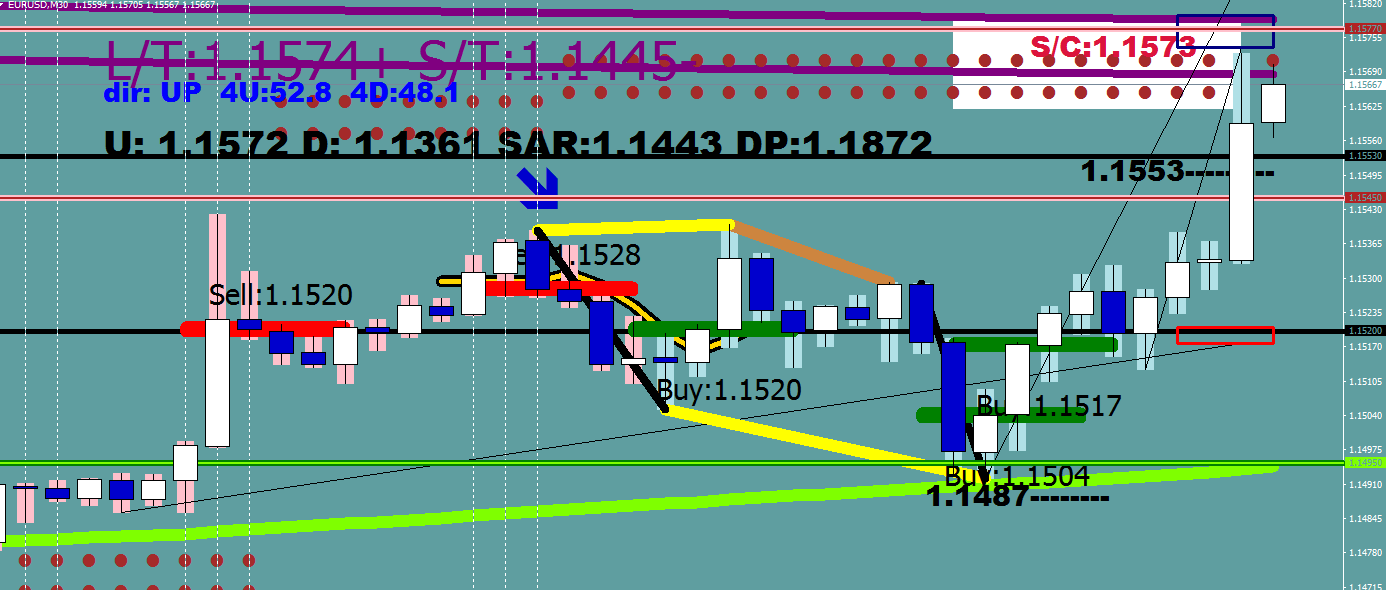
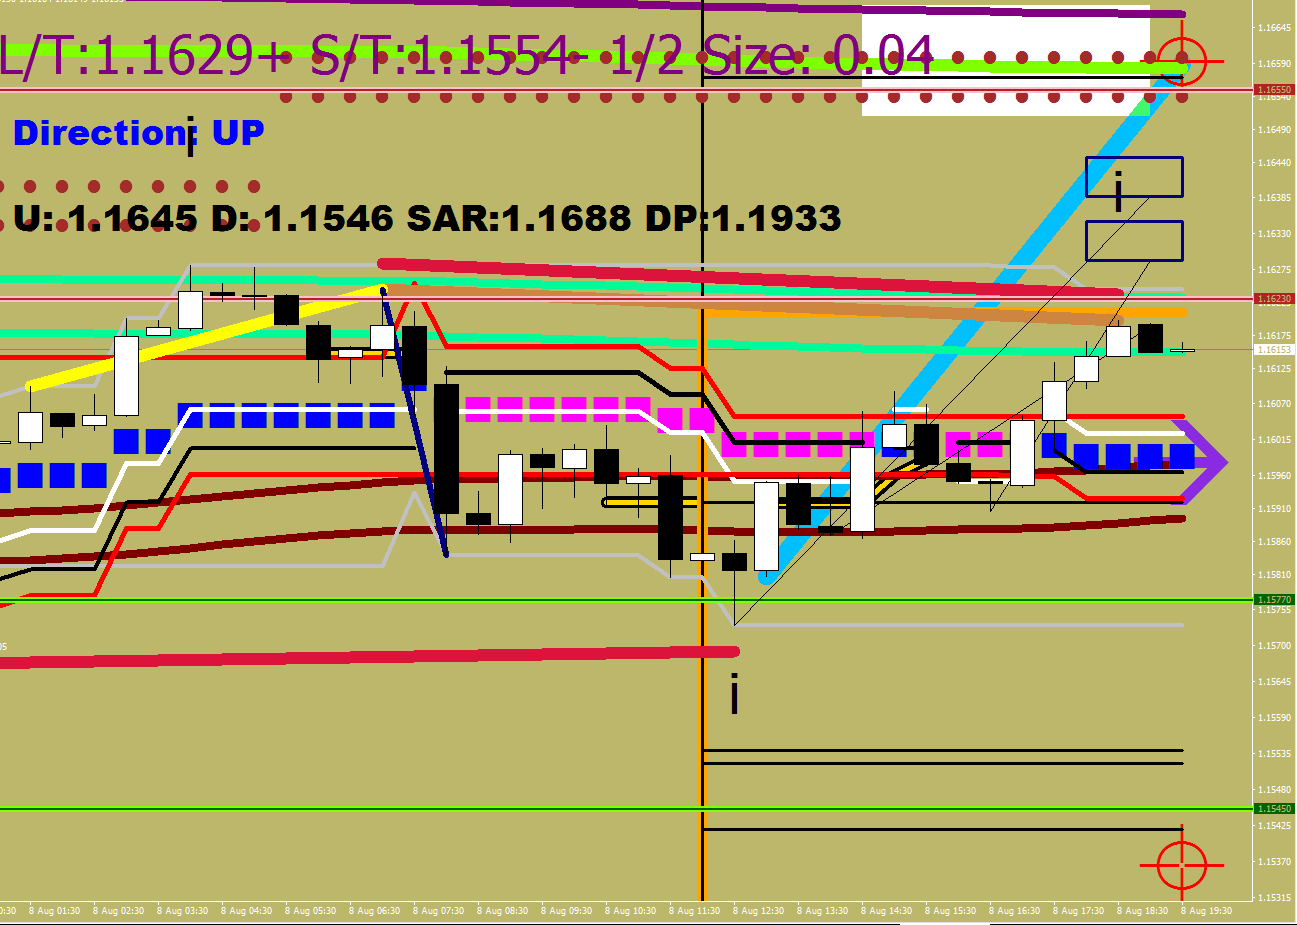
A-1.1539 may get a back test. Direction is up.
Cyan line=pivot.


After the short wave, you want to see a no break for a reversal.
1.1568 is the peg, 16-32 pips it can go below it without a break.

Just to show – things I’m working with currently:
8,12,18 ticks charts, DOW, DAX, Crude


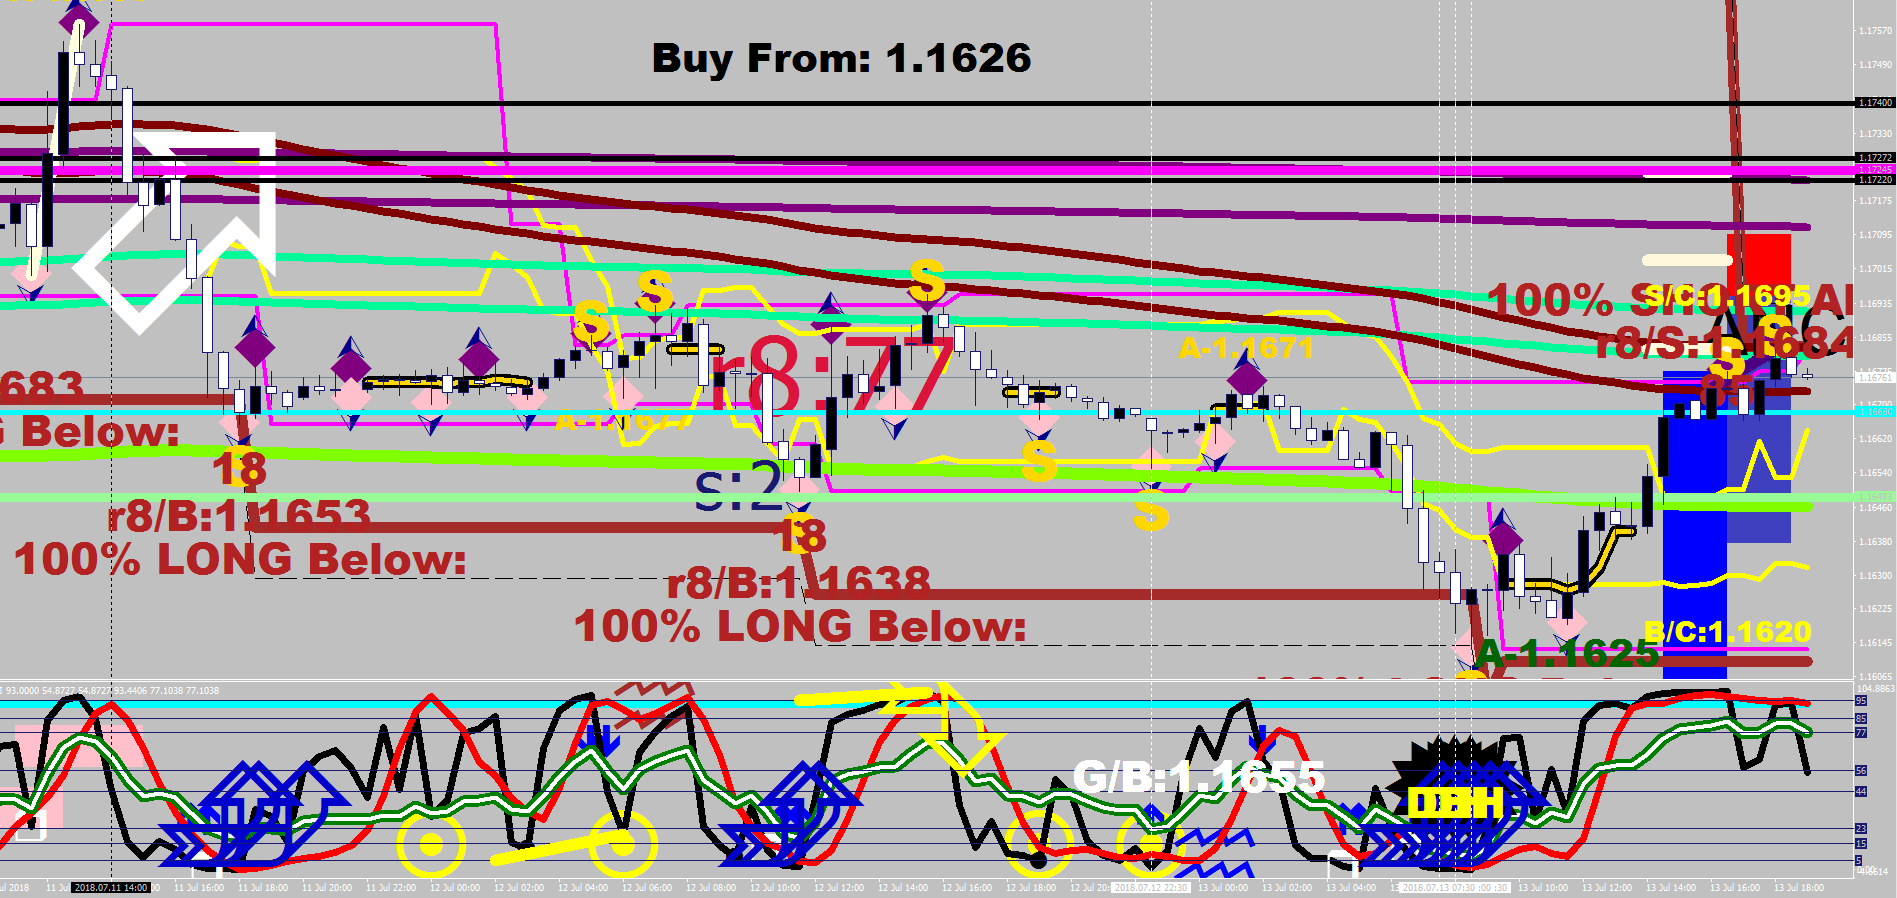
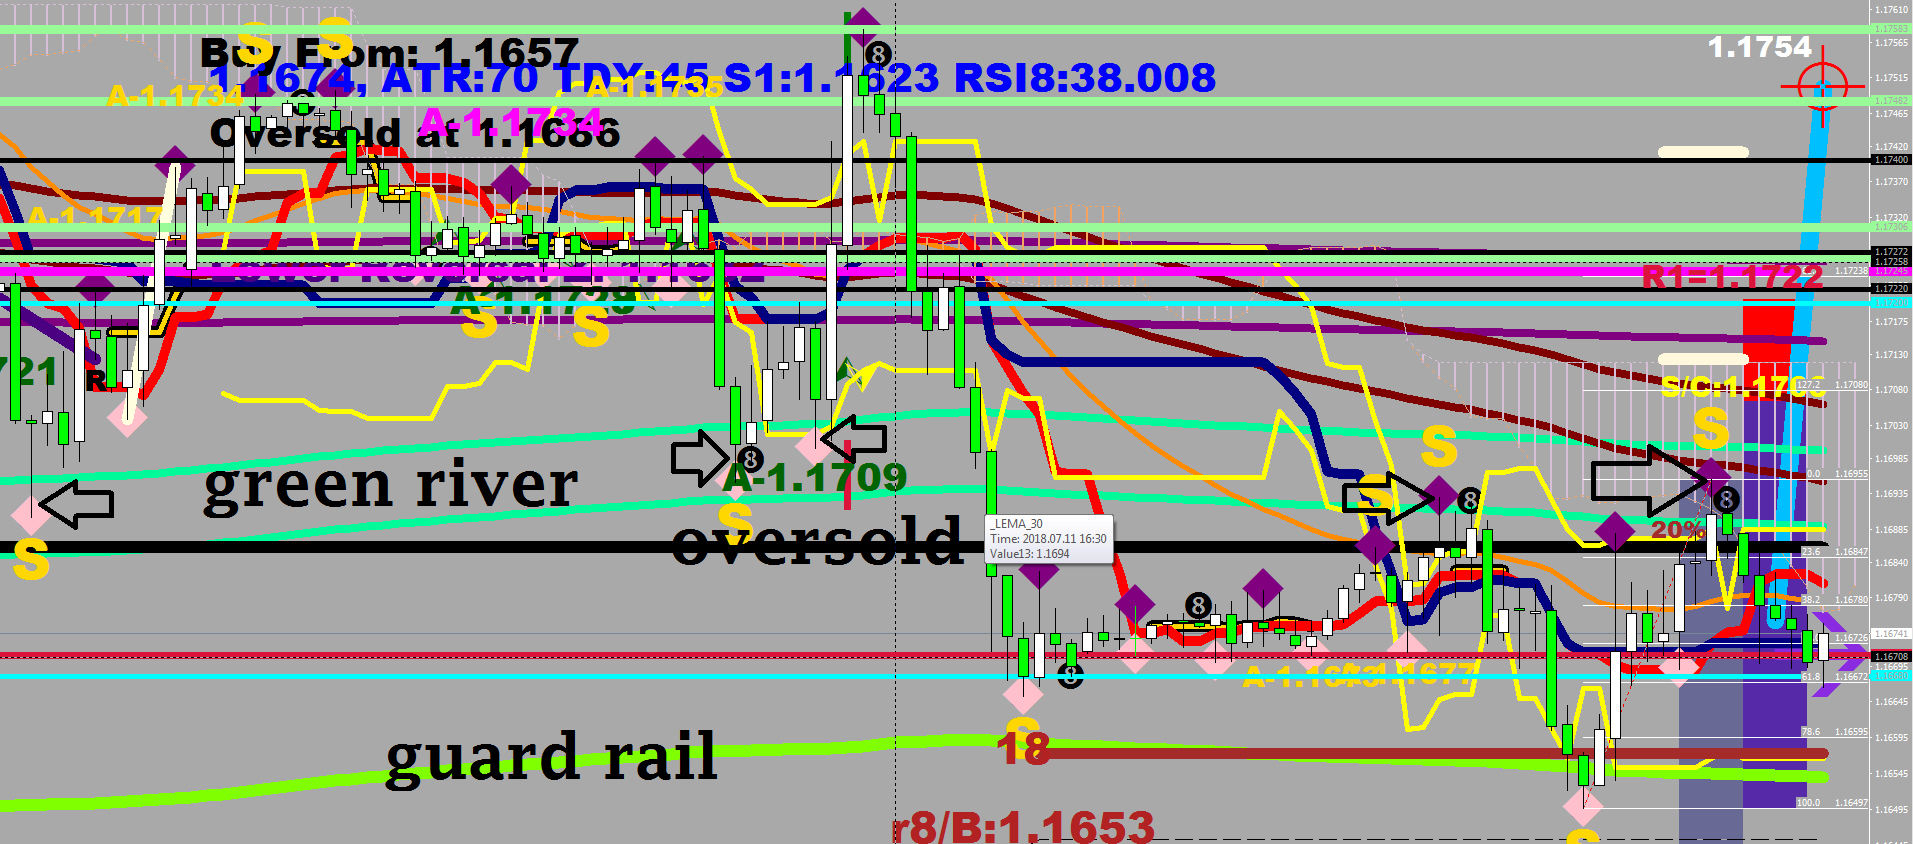
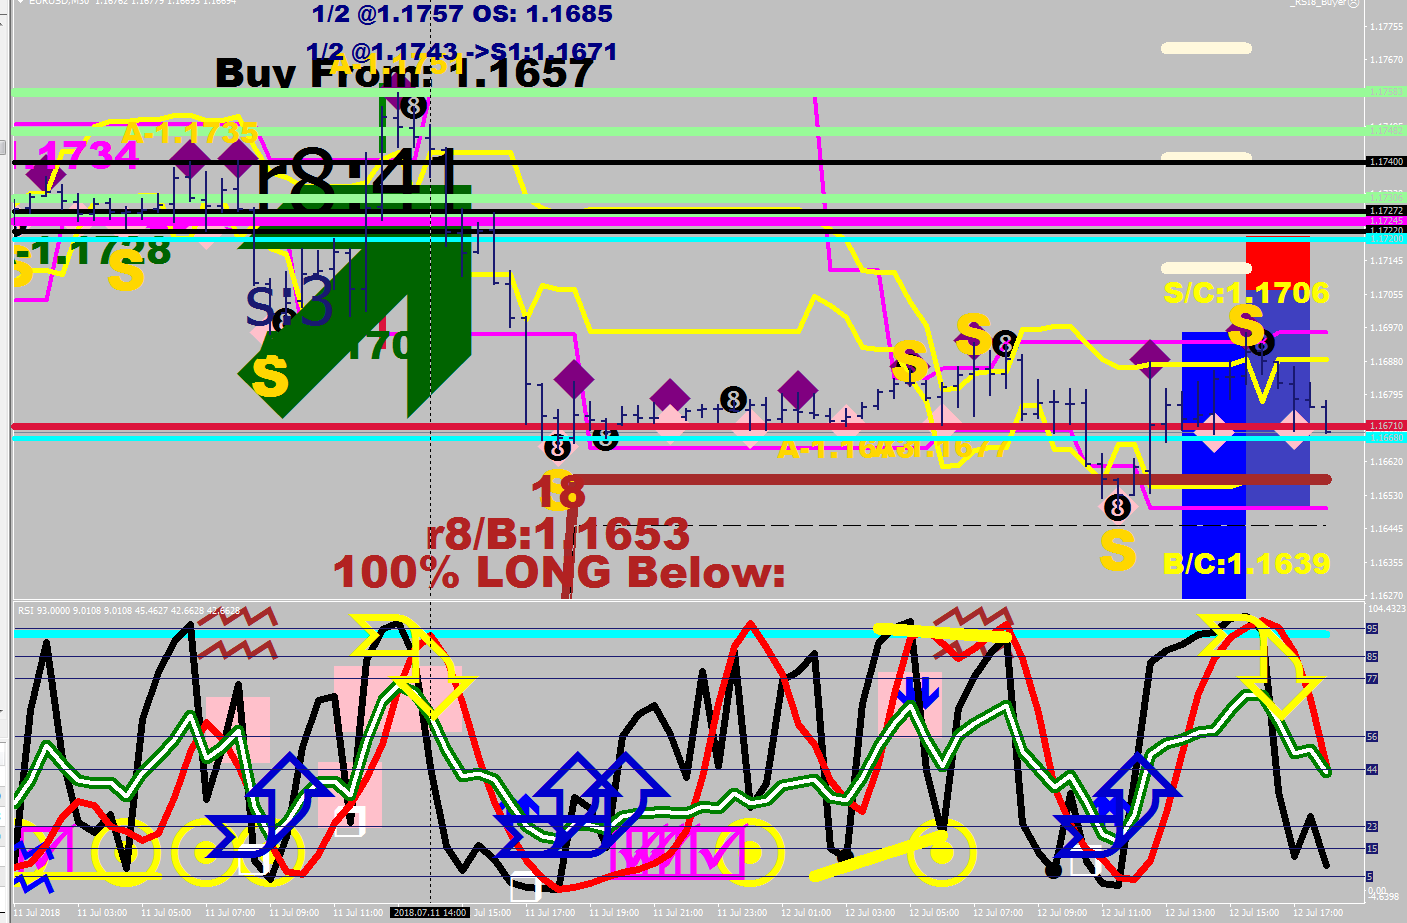
Want to see another RSI8 below 20 – 1.1657 – for faliure, 1.1640 for continuation
Here is what I think happened: they secured a coast move by a small gap up by keeping it to its fluctuation range.

Once the gap fills, you would see a move up to the 38-40 line just to fail.
Lower High with higher stochastic (red line) divergence.
Last swing size: 38 pips – failed break out.
If you measure the last push down, it was 39+ pips. Coincidence.
There was a Maroon Sell…
If you are wondering of the swing size 82, it is 66 (progression) + 16 (coast)
Wait for a 40 swing for an upside failure
Let’s see if you’re brave enough to test my cyborg routines…
An-Alfa-Beta versions as follows:
Add a ratio hedger just in case with 0.65 setting – and an RSI cropper to start. The RSI cropper is smart enough never to crop the ratio hedger’s hedge.
There is also my_Kijun-sen_Stop_Loss_Fitter
To make the arena more busy.
Projected distance…
Broker friendly version: orders spread out, less drawdown, no excessive orders.

Anchorage 1st pass
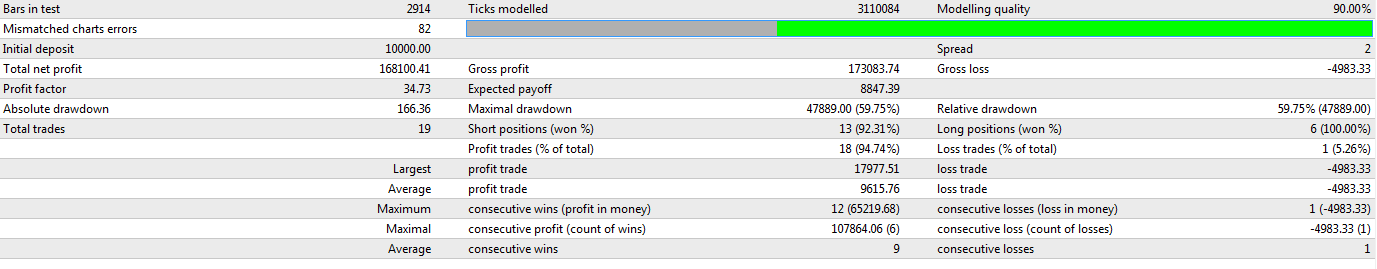
Okay, one more thing to show you: pushing the boundaries of what is even possible, here’s a 34.73 profit factor for you:
What is a reversal? A verified divergence.
How do you verify a divergence? By the break of the 4-sample high/low printed coming off the A-sync swing.

Divergence ~~ Sync – Async sequence.

Projected distance vs. MACD divergence – which one would win? Also the fact that the 30-min LEMA middle was hit, and then the 30 min Lema Cloud upper edge;

the downside projection of 1.148x becomes a possibility here.
I haven’t coded anything in TOS for a year now, so it was nice and new editing my UFO script. It was looking for a power move on 2, 3 samples, but if I allowed for a 1-sample, it would show that the projection was basically filled.

Here’s projected distance adjusted to 80% ATR

There is no qualified Async high yet.
See how random the market moves are?!

Soaking silly – was someone’s comment. People don’t know what to appreciate.
Lower reversal zone bottom hit. Wedge it or not…

RSI <9!
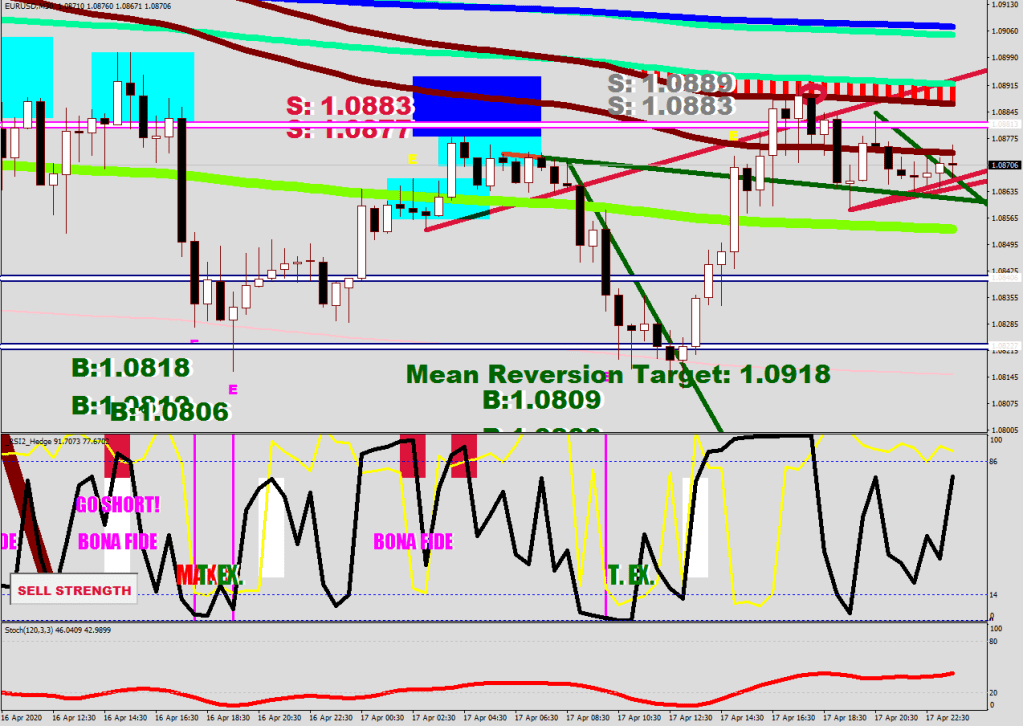
The first selling exhaustion got the move started. The second is ending it.
Selling is still strong. Check the new release under “When Volatility Dries Up.”
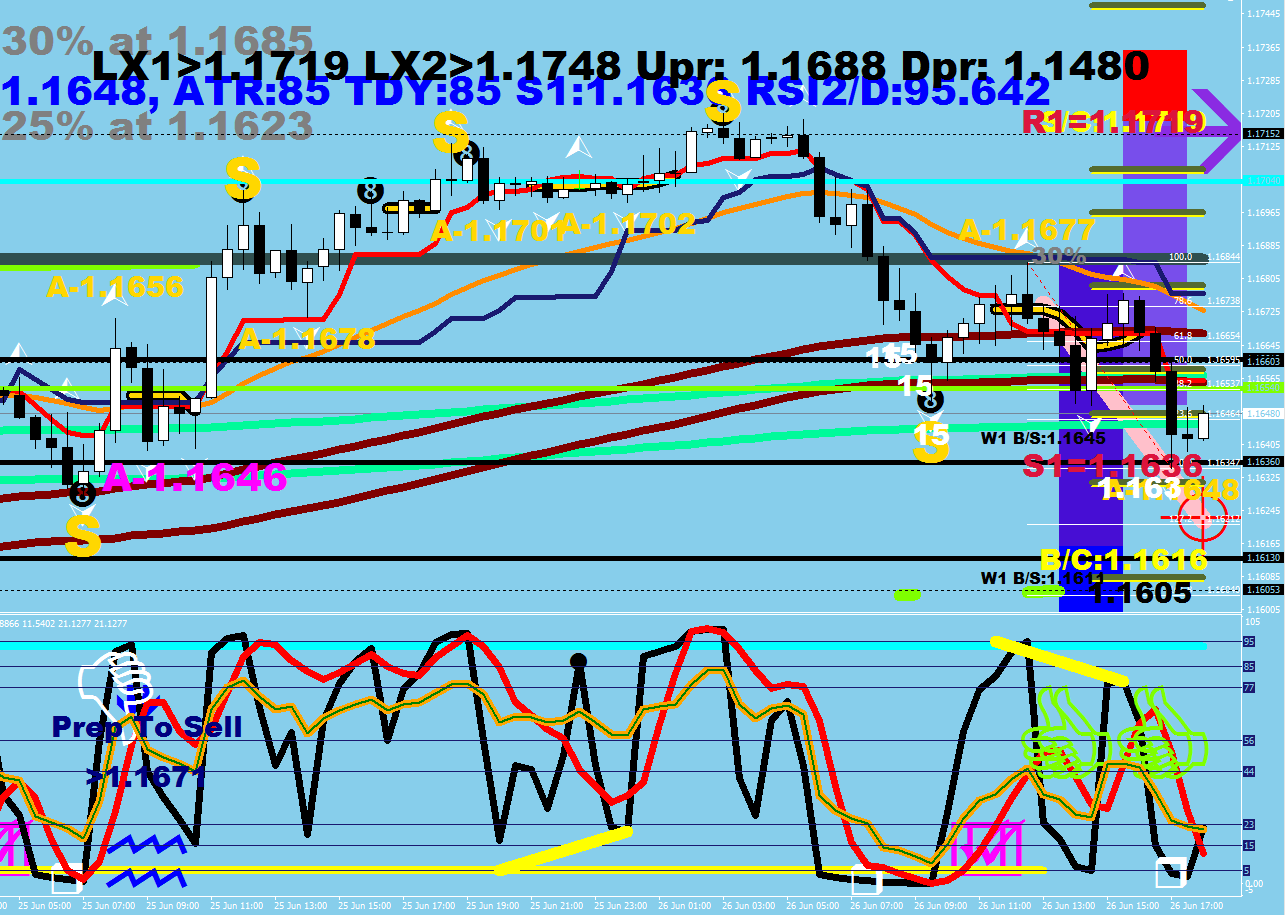
Celebrating 85 years of RSI – “A cut above”
I would buy the back test of the last Async high @ 1.16175 ->66-75 target

2 Sync highs so far.
…and they changed their mind…

Professionals at the bottom this time
Adjusted some on the Sync-Async plots

Yes, there was a Genuine/Sell signal as well.

All root points are Async. Heads may not get any plot at all (other than a divergence plot).
Sync means: prepare for a turn.
Async should be a terminal point, so if it breaks, you must go with the direction.
2 Asyncs coming off a Sync high are a continuation low.
Lots of Syncs in a sequence: this is a wedge.
Also, from now on more emphasis on the EXIT level.
S/X= Sell Exit

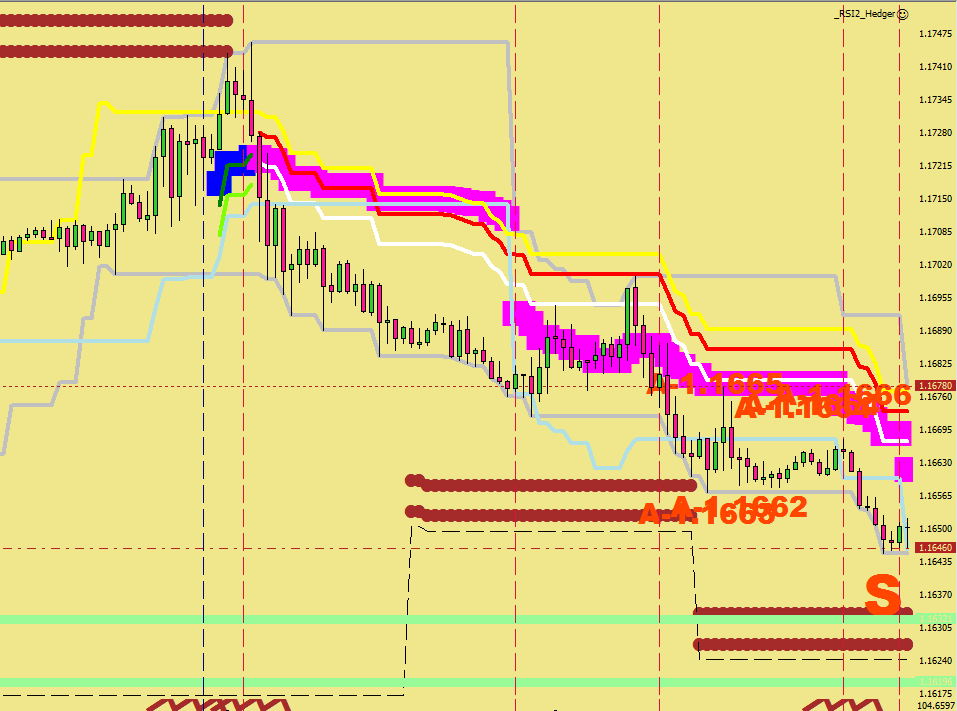
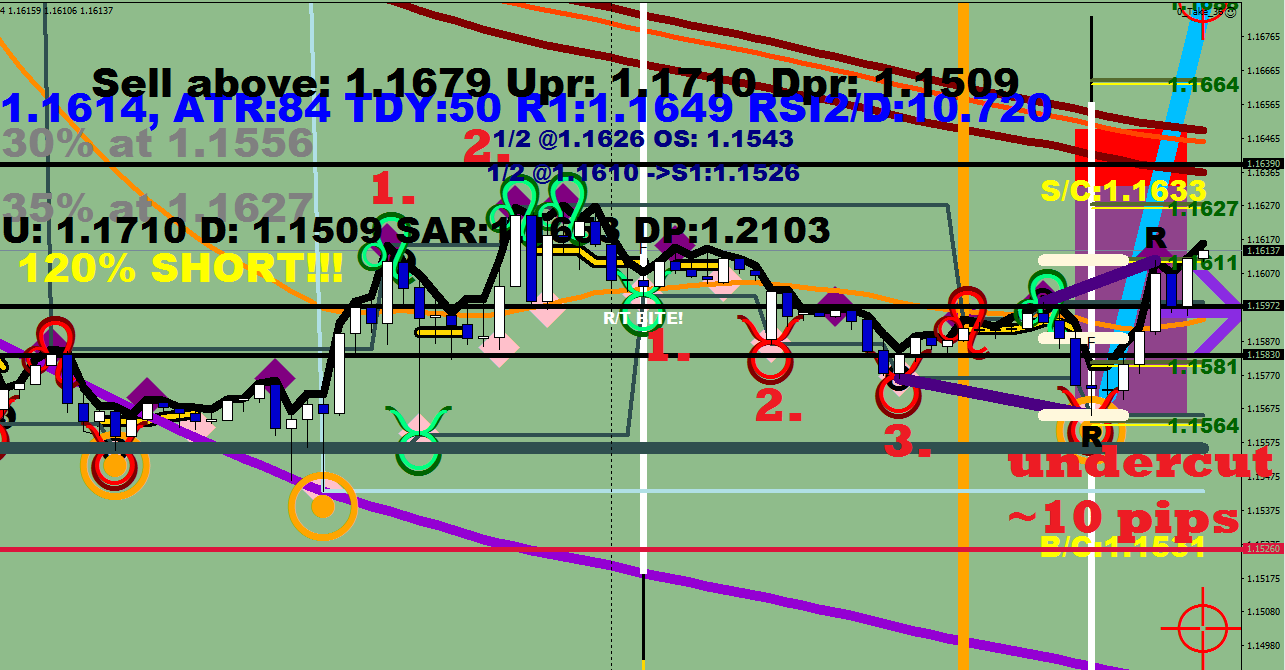
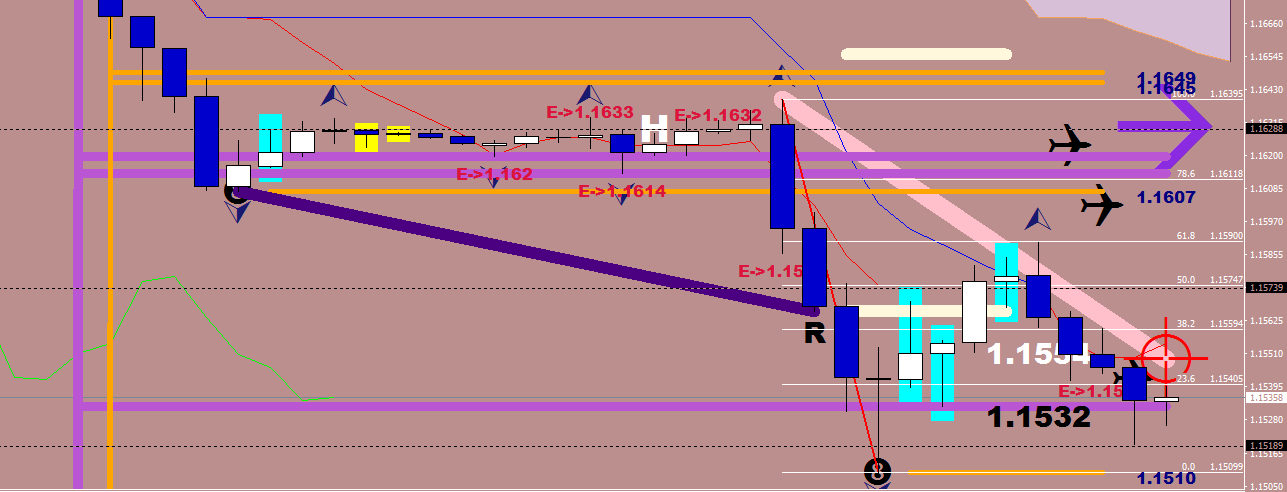
The next consolidation weights are at 1.1627 and 1.1664
Mr. Maroon in touching distance. Overbought neckline at 1.1633


Lots of back testing during this weekend.
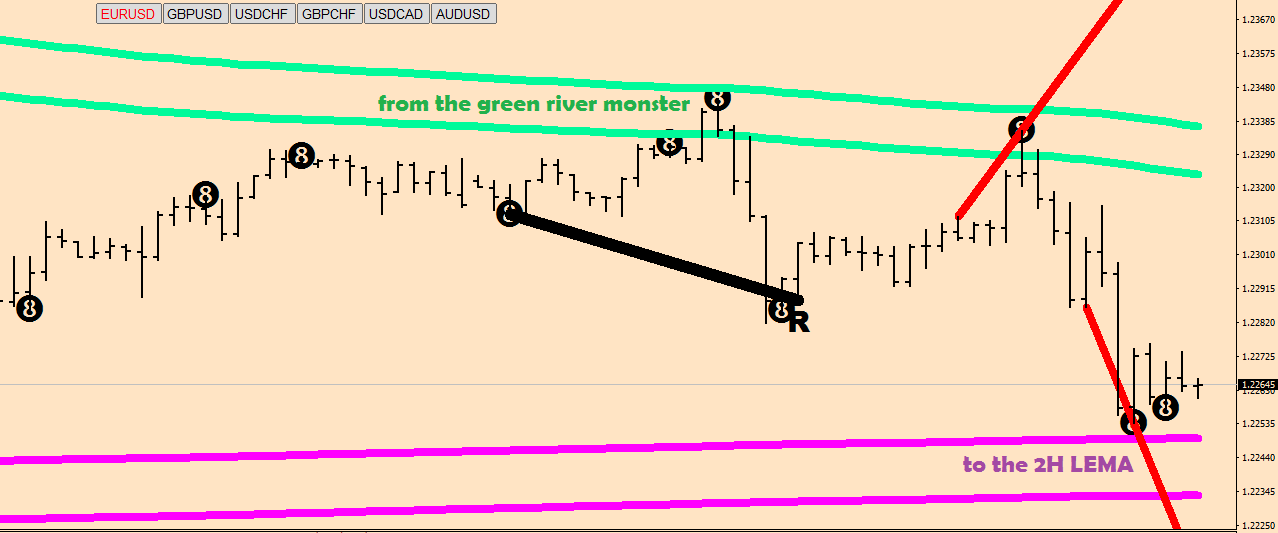
I had to come up with a routine for trading around the Green River, and I ended up with two. I found the 2H Lema act as sort of a polarity switch: above it, the break outs prevail on a first attempt, below it the limit orders work out at the same level relative to the Green Monster.
Here is GREEN RIVER MONSTER BREAK – that works above the 2H LEMA


& GREEN RIVER MONSTER – that works below the 2H LEMA


Professionals on the tops…
Do you see any 4h pro volumes yet? I certainly don’t.
What is a head & shoulders?
It is an In Sync – A/Sync – In Sync sequence
Back test anyone?


ABC correction over with

Inside the cloud is neutral


The last swing & the progress:

3 dojis up,
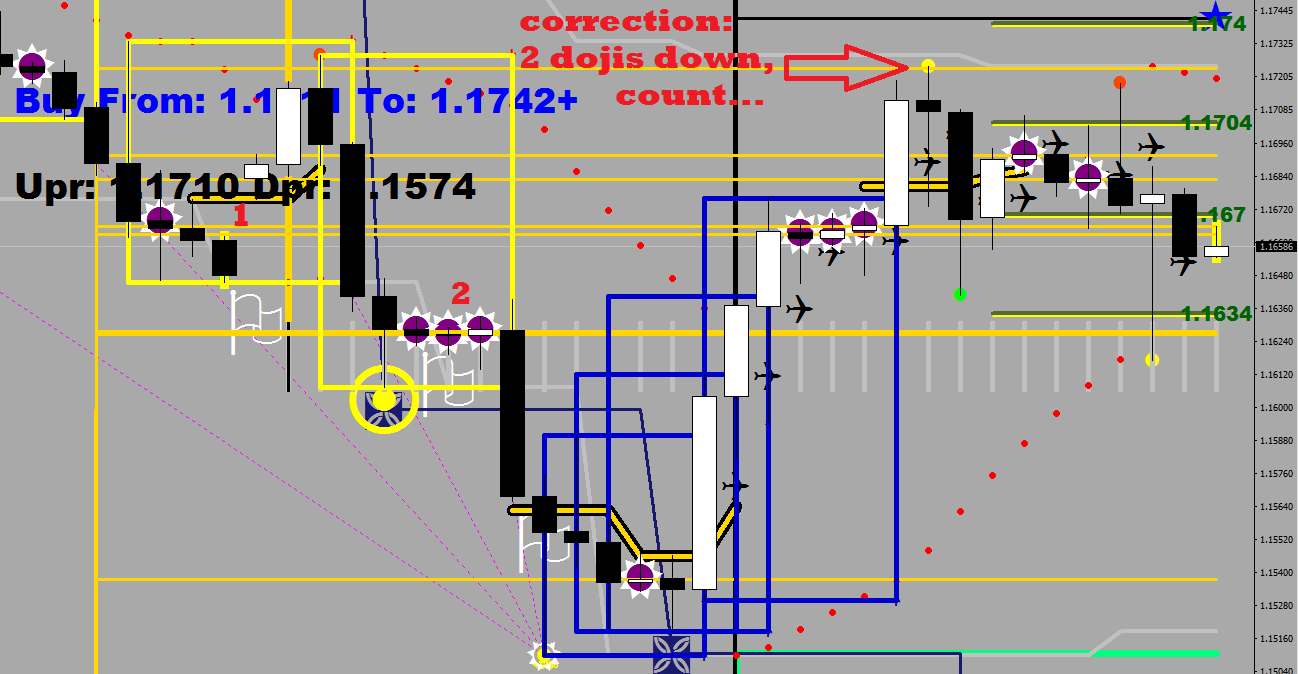
2 down.
This is how you progress.
By the way, my PSAR Trader did not walk into the minefield yesterday. And I did not even have to make any corrections. It simply deleted the order before price could hit it.

I intentionally picked less than 4 hours for expiration. 5 minutes before the next print it was cancelled as you can see.

You are above the 1H cloud – think twice before you short

Nothing reversed today as hard as USD/CAD

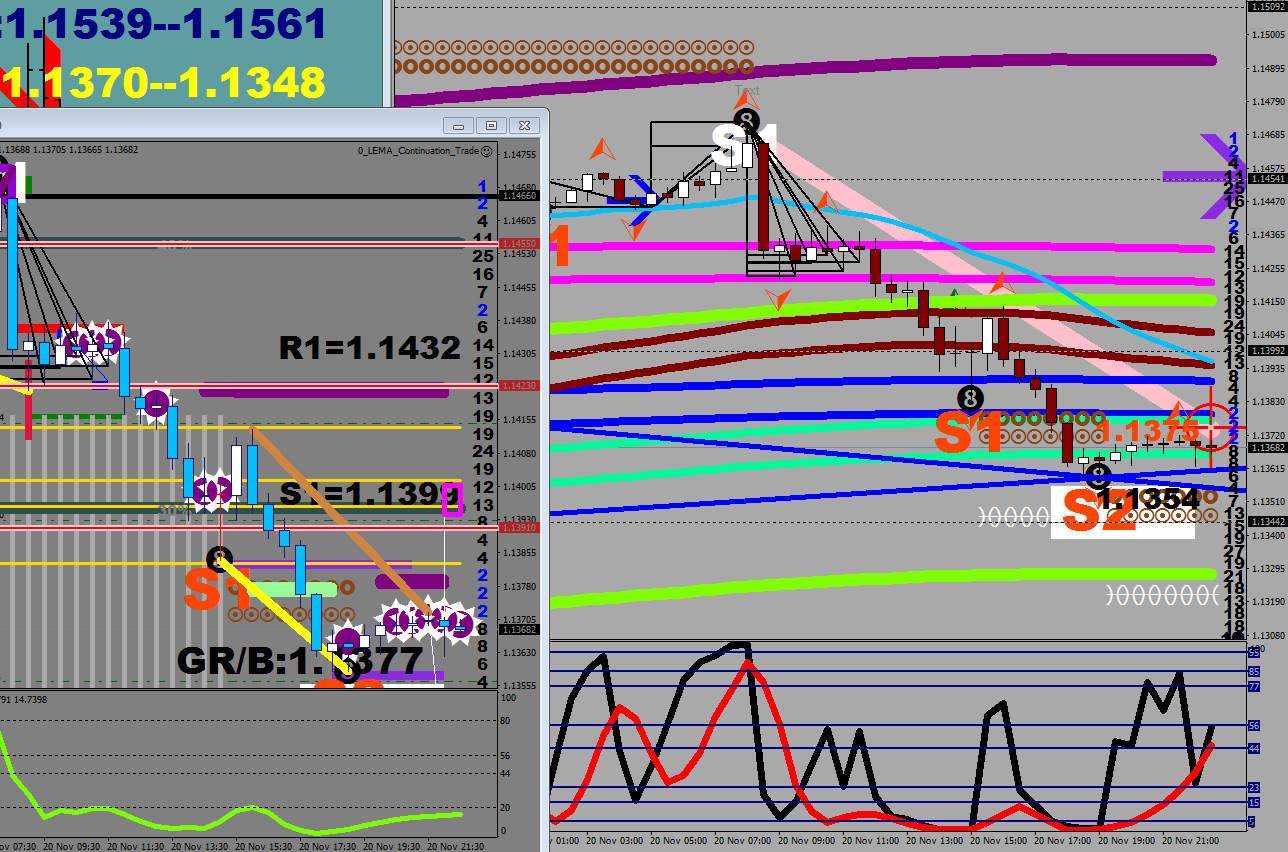
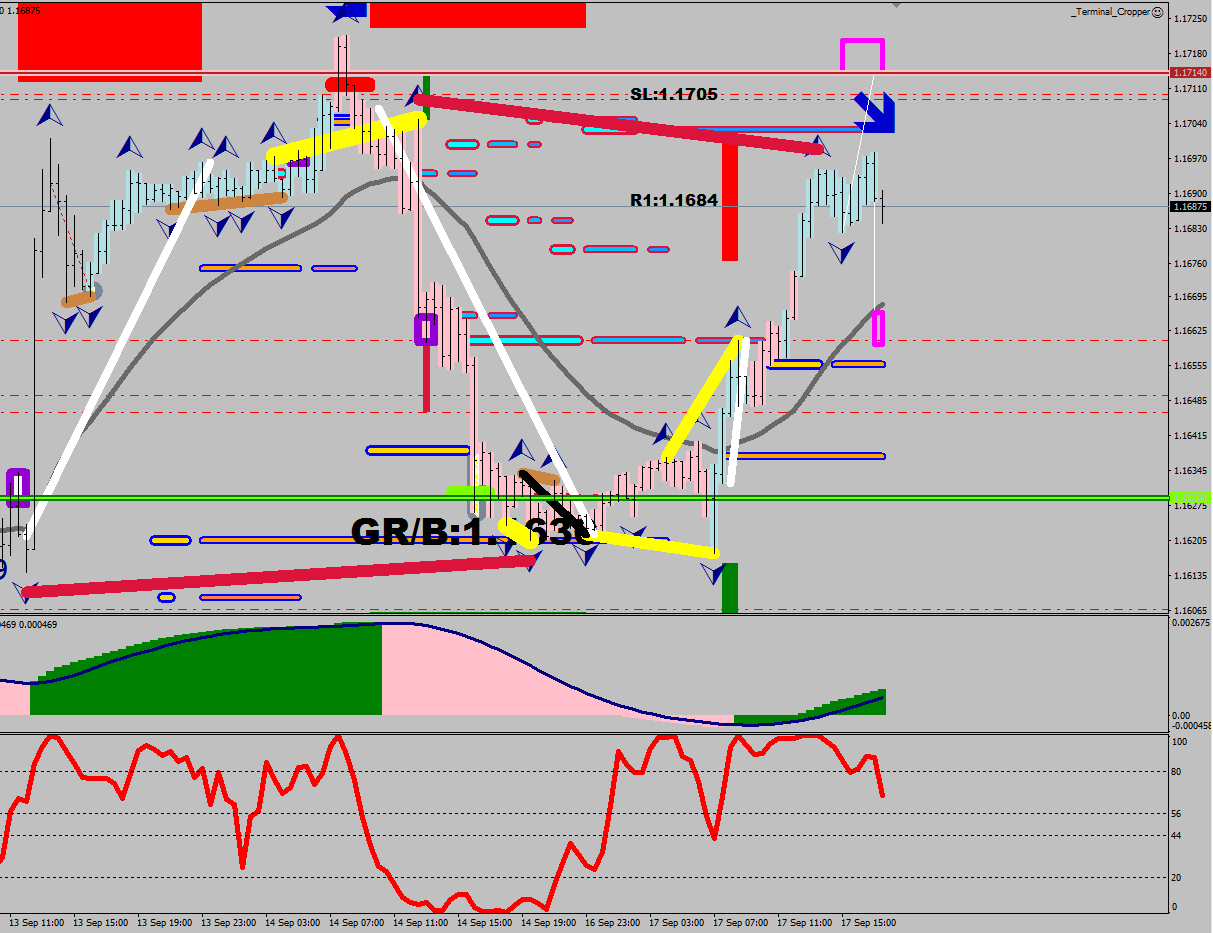
G/B stands for Genuine Buy.
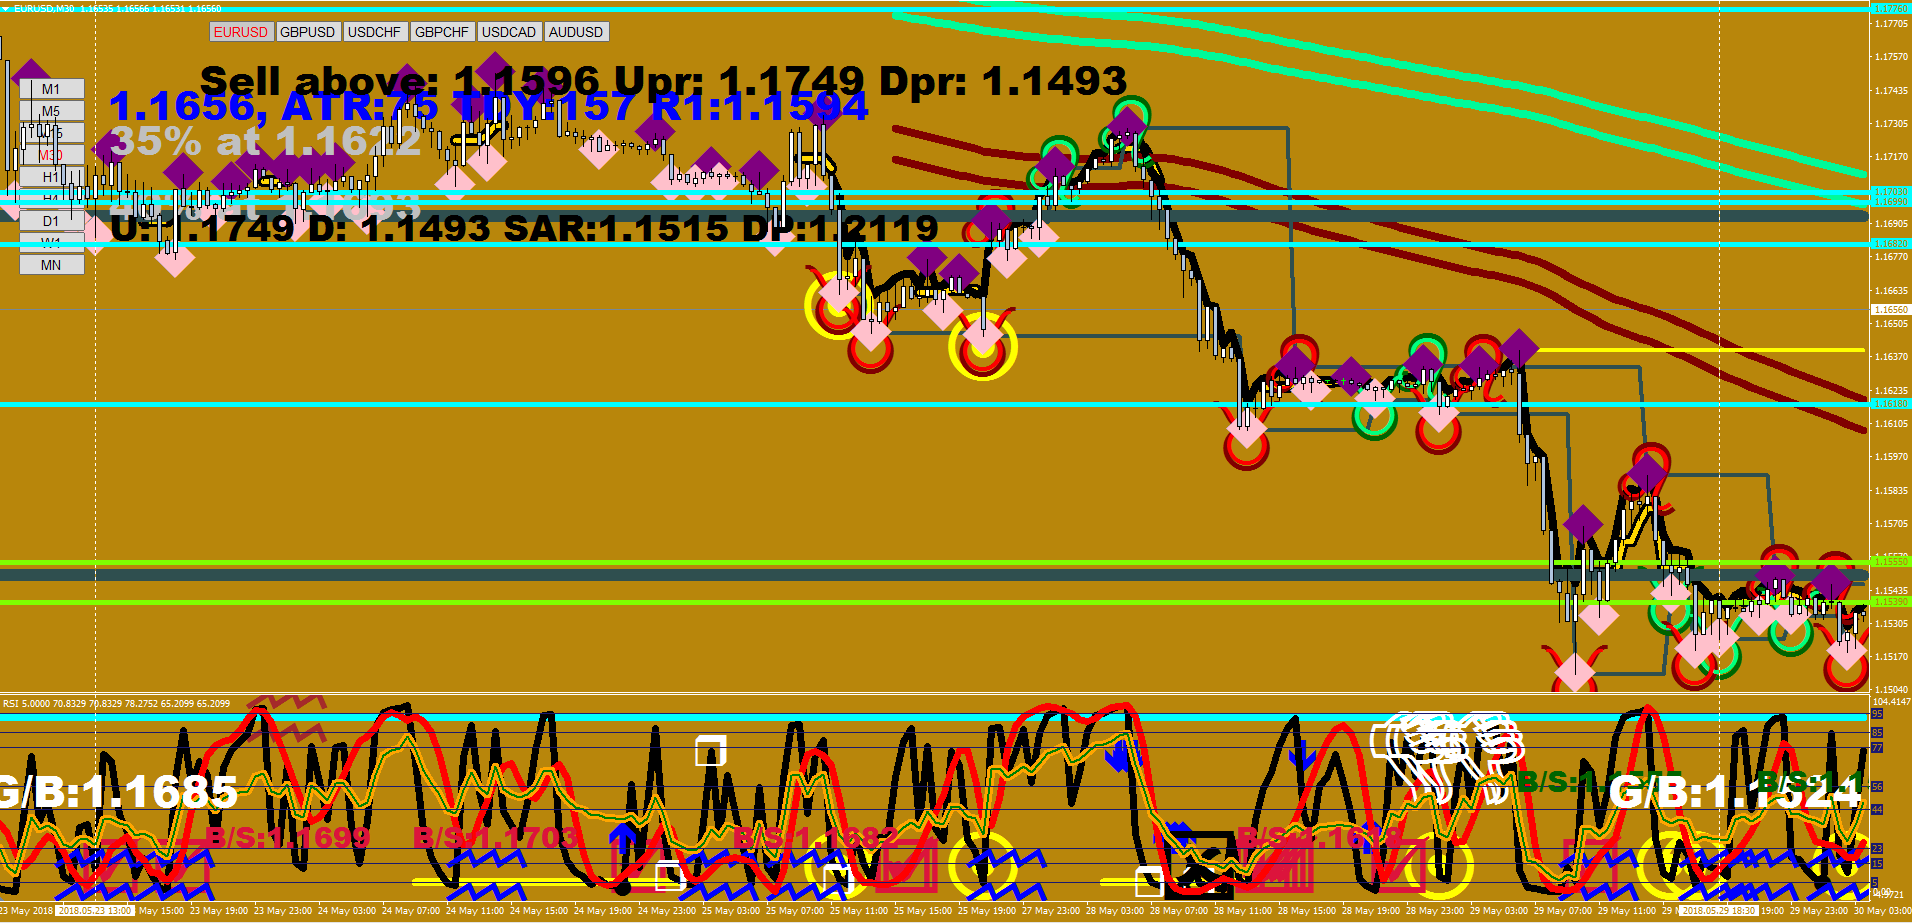
White dots show the swing low that you should buy the undercut of.
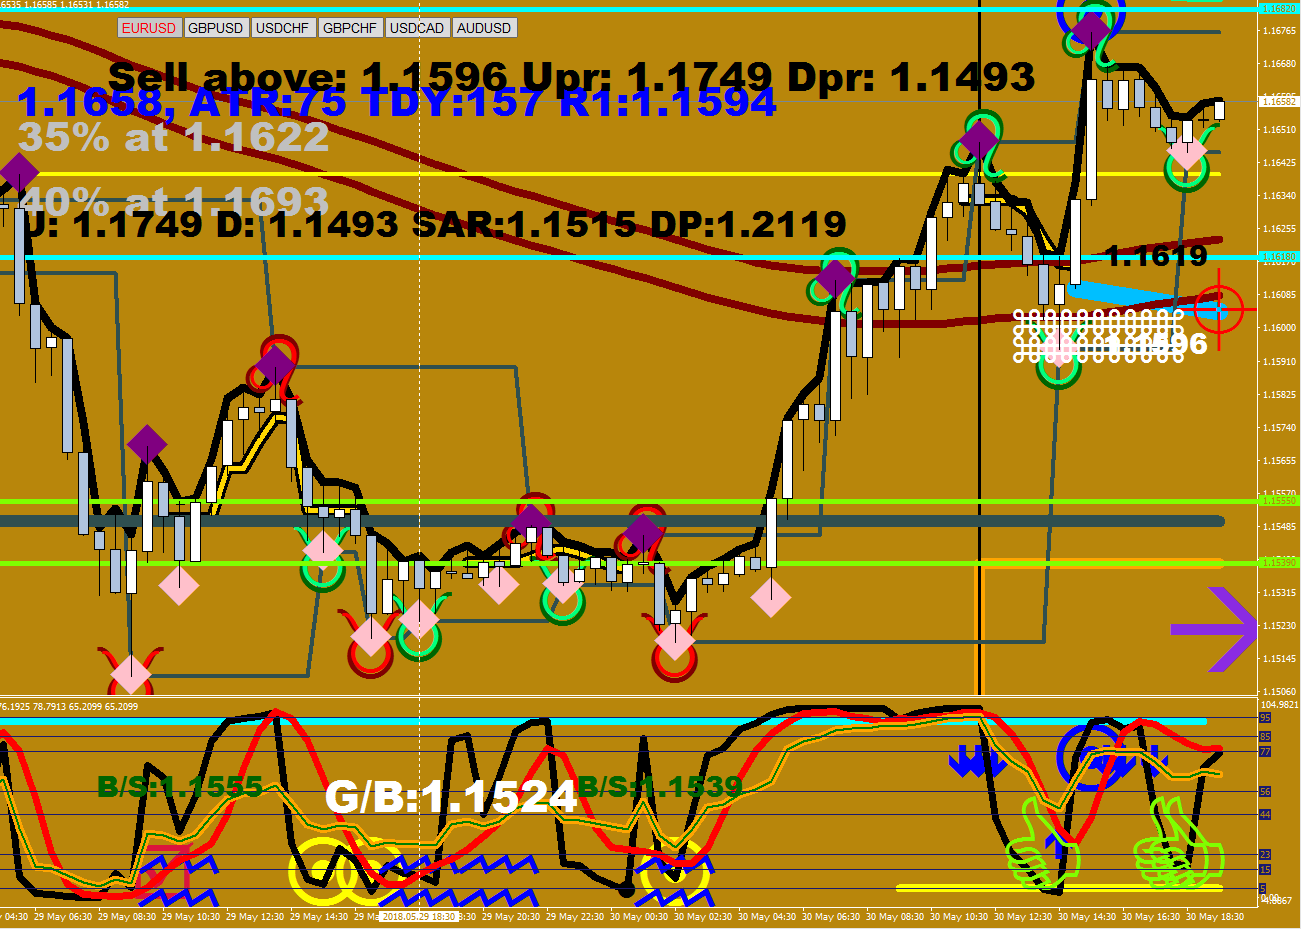
Genuine Trader – strong filters for now, but it sure has its place in my new algo package, Mr. Psar, meet Mr. Genuine…
Gotta check back later, I’m curious if today’s trade would had gone fine… Don’t have the data for it yet.
This is a breakout backtest. Period.

Wave 5 ended up being an ABC

Lots of professional activity
Violation of Mr. Maroon = Shot Over the Bow = Wave4
The level was on the screen all along.

Undercut, double pump, RSI nearing 15, getting there…


The red shading is the low volatility area, price choked when it tried to surpass it because of lack of orders. The next attempt at it would be the 4th.
DH has just showed up.
Propping up “88” for sale on someone’s request.
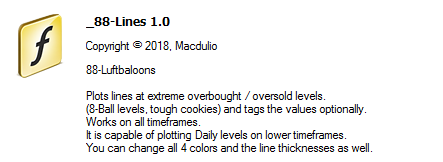

Even I’m not sure of the current color combination 🙂
(the thick, currently Orchid lines are the daily levels)

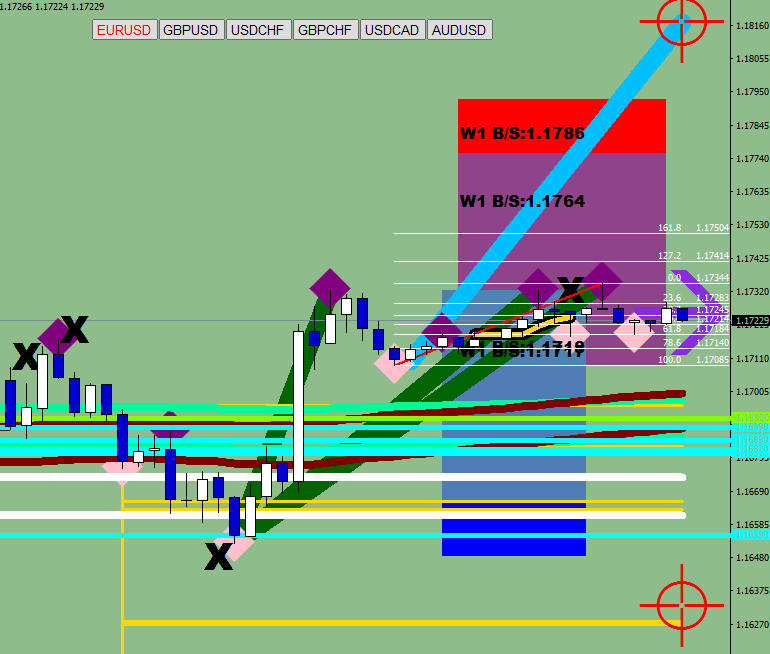
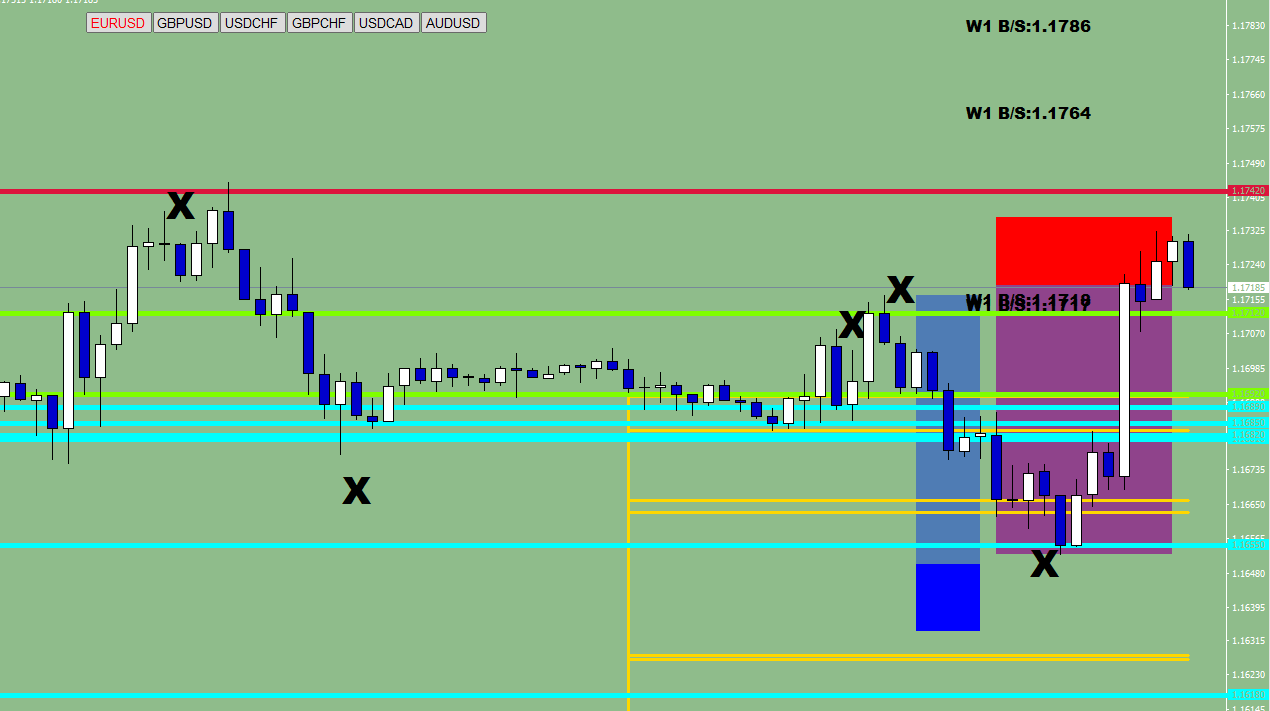
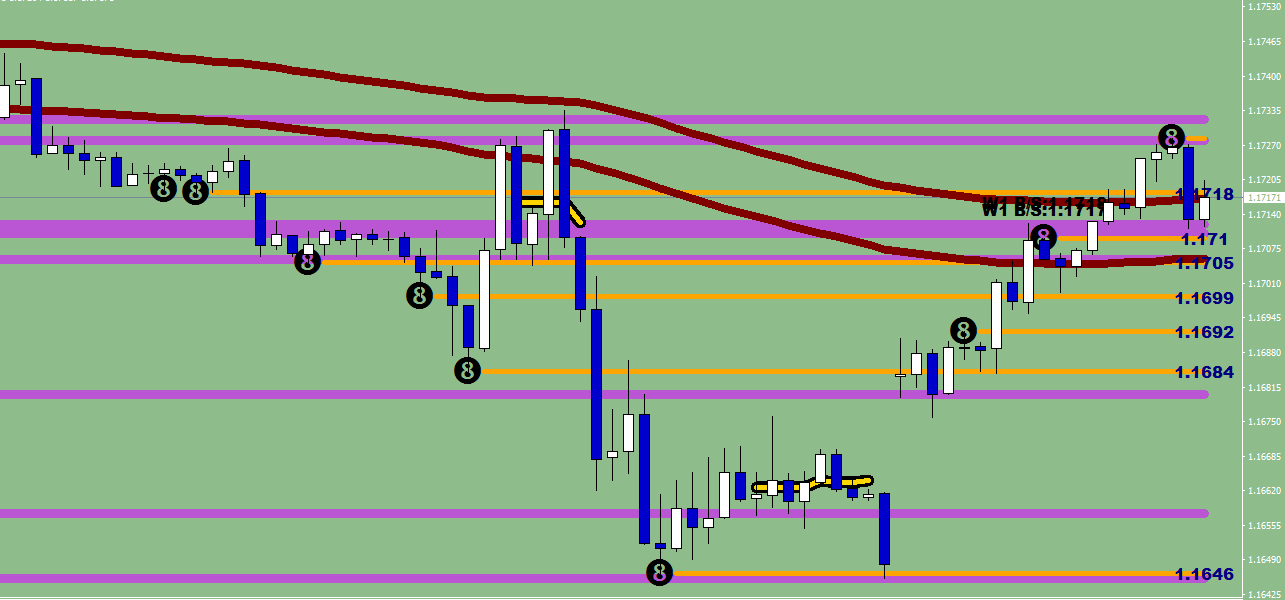
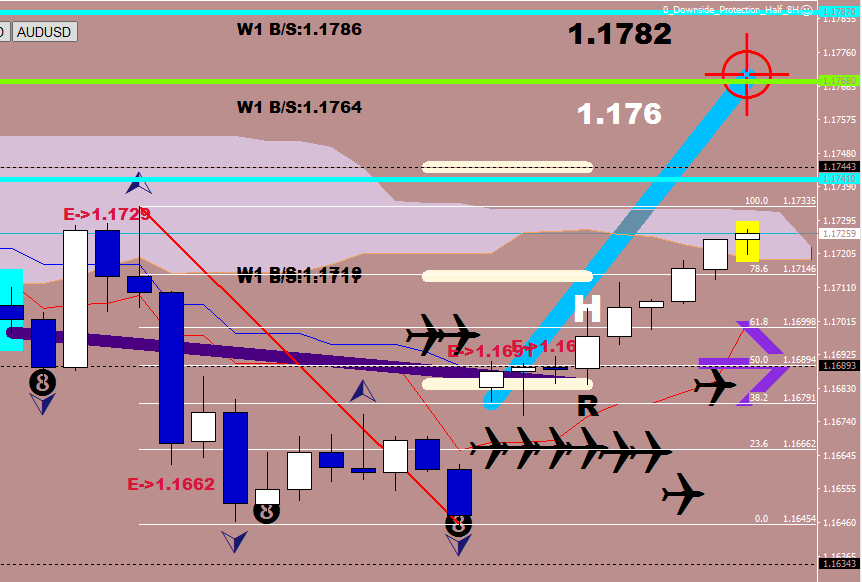
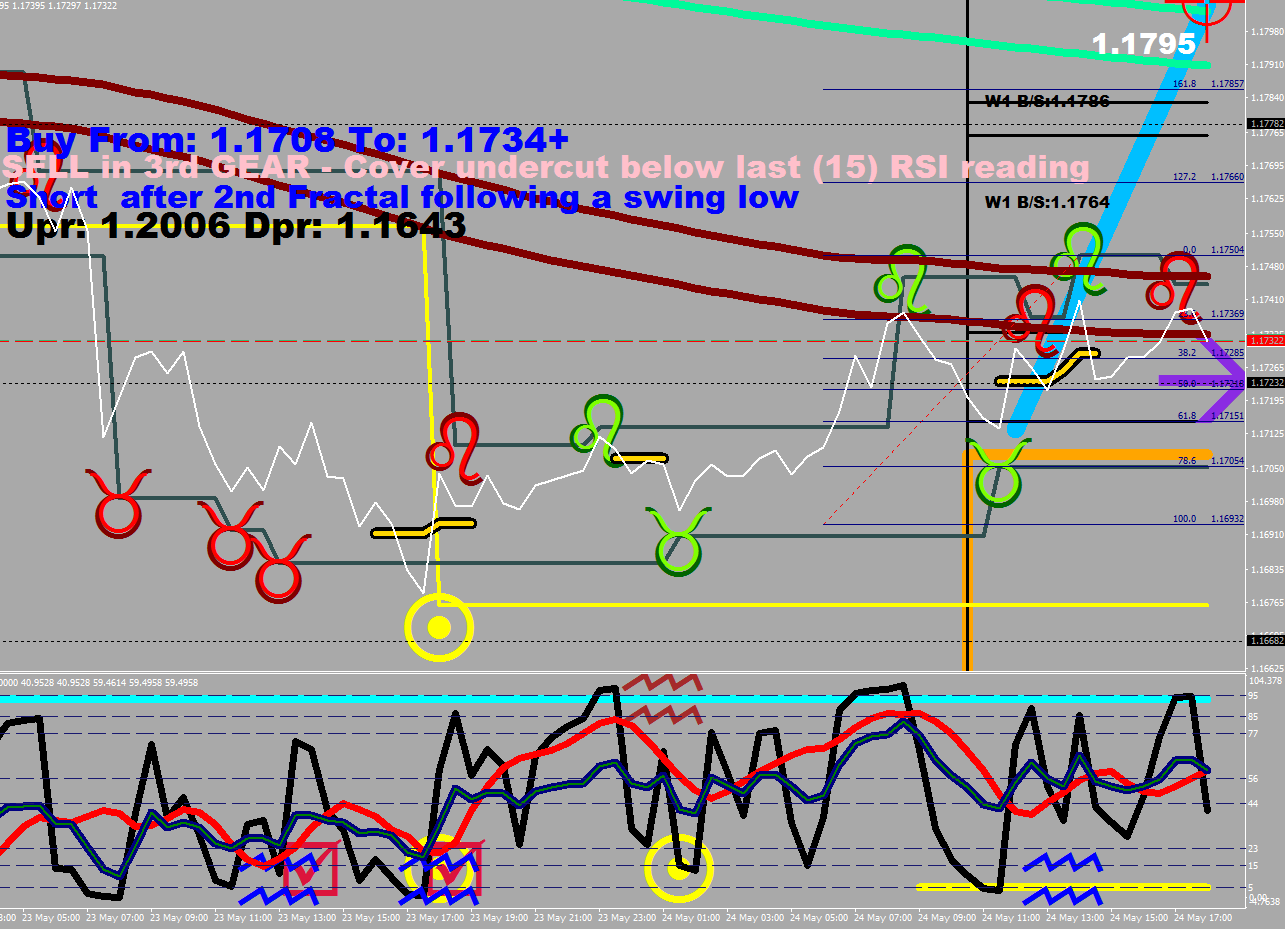
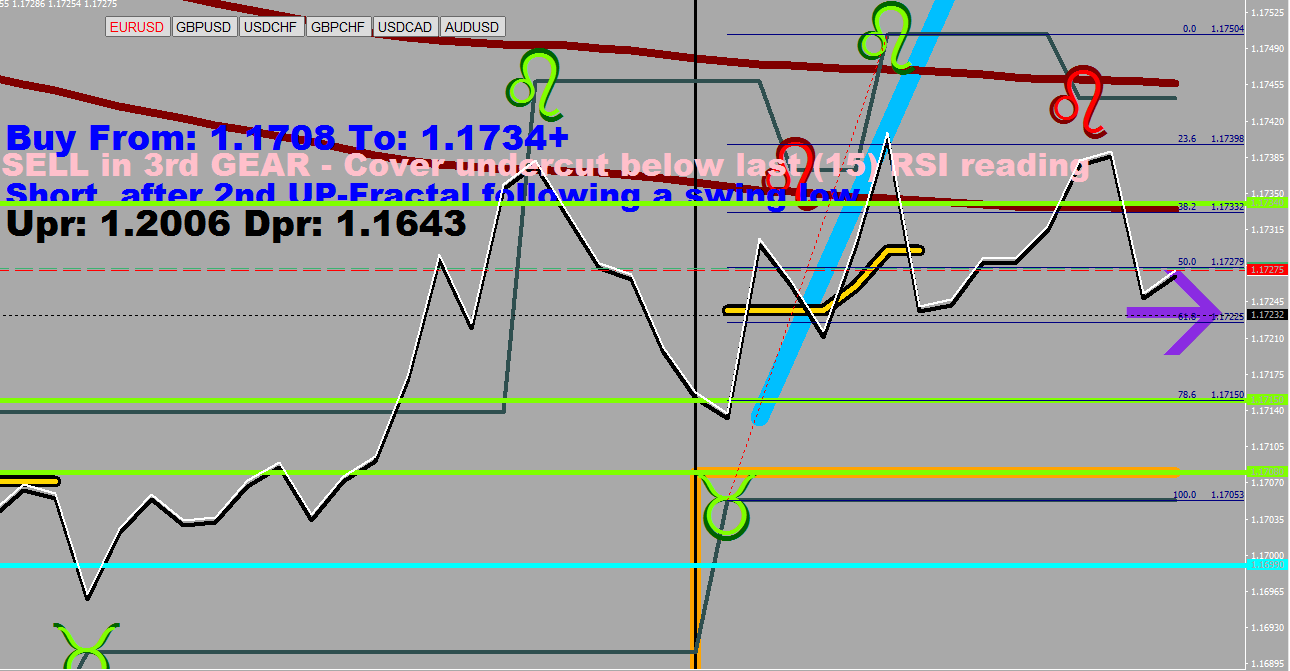
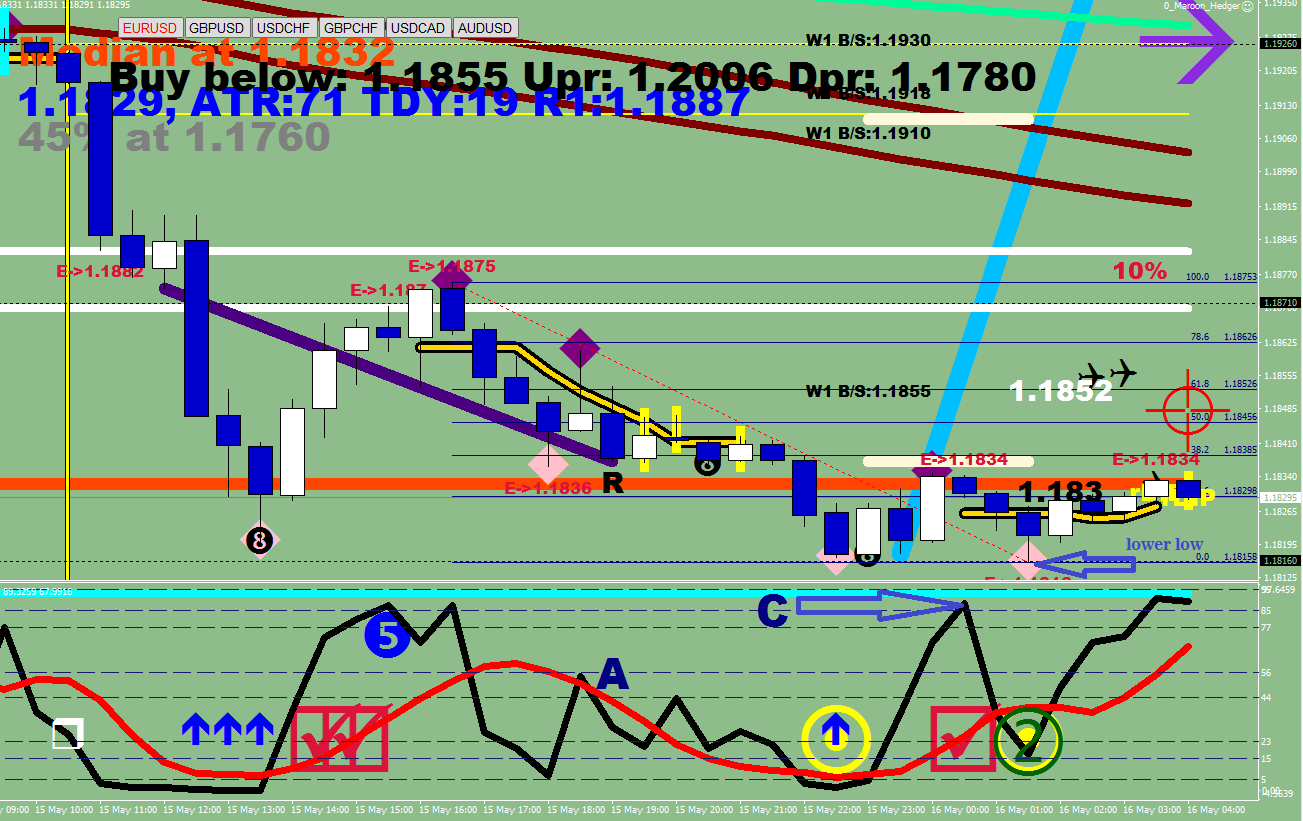
There is some Wave1 defender action here: a penetration up to 15 pips was sold. If this is going to be a higher swing low, bulls would have 3 more swing highs granted.
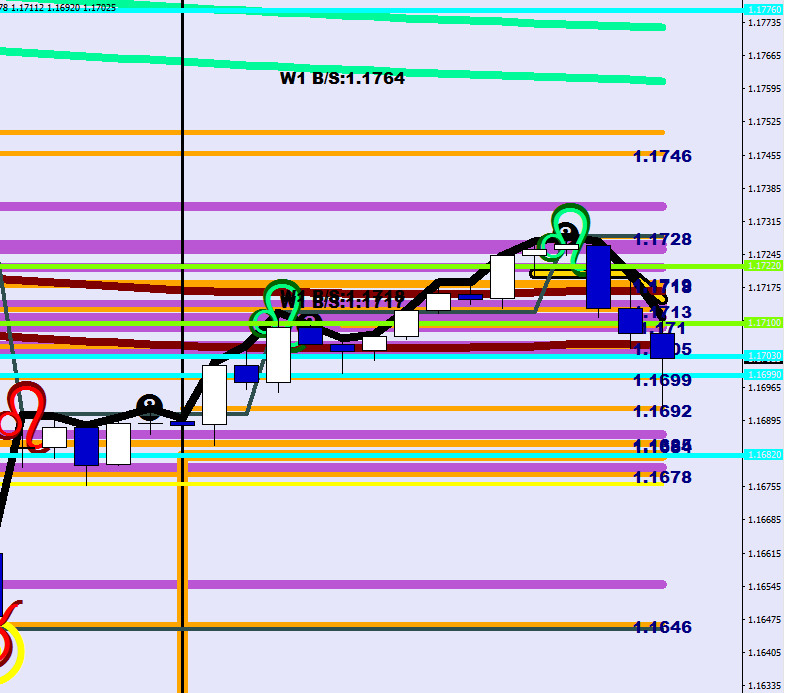
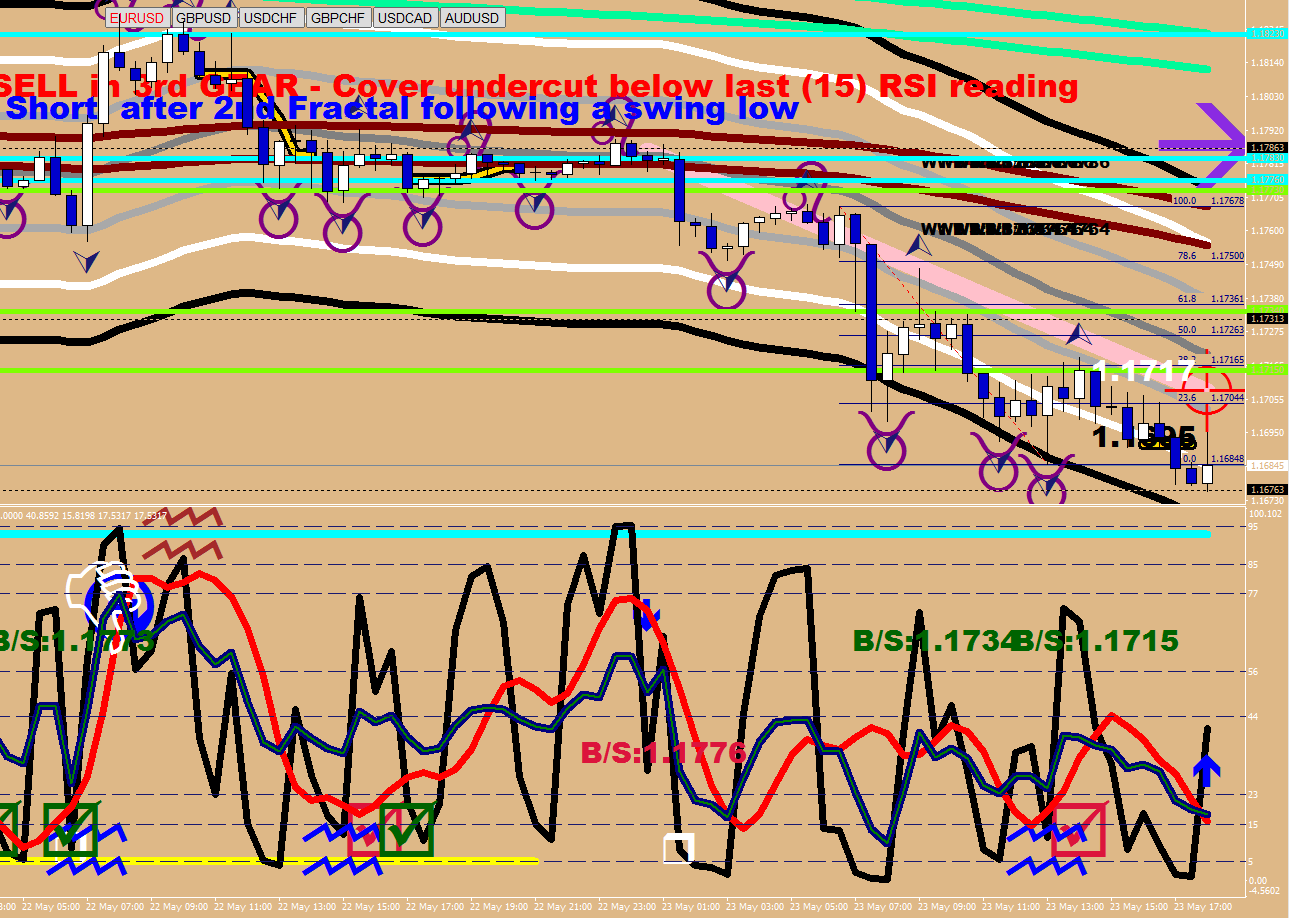
The next Wave1 defense line is gonna be at 1.1764 + up to 15 pips, in the Green River – this would be a sell up to reaching a 30-min 8 sample oversold RSI (an ABC correction).
The correction from above would probably be met with Wave1 bull defenders (1.1718-1.1714). Staying above the hourly cloud would yield 3-5 days more of upside action.
I watched this over the weekend – not on Friday though.
The purpose of the Analysts is to mislead you. They point in the wrong direction and get you paranoid. 1.14, sure. This was the gap-up back test. They had to get rid of dollars and/or wanted Euros on Friday, and so they utilized the media to have people get paranoid for what was to come over the weekend. Nothing. News have no relevance. Levels, conditions, intentions. The Futures contract serves the purpose perfectly: you cannot see what happened a half a year ago in the garbage data it provides. Gap up? Where?
Whoever sold on Friday in the second half, can now be squeezed. That’s all there is to it.
Found the match too:
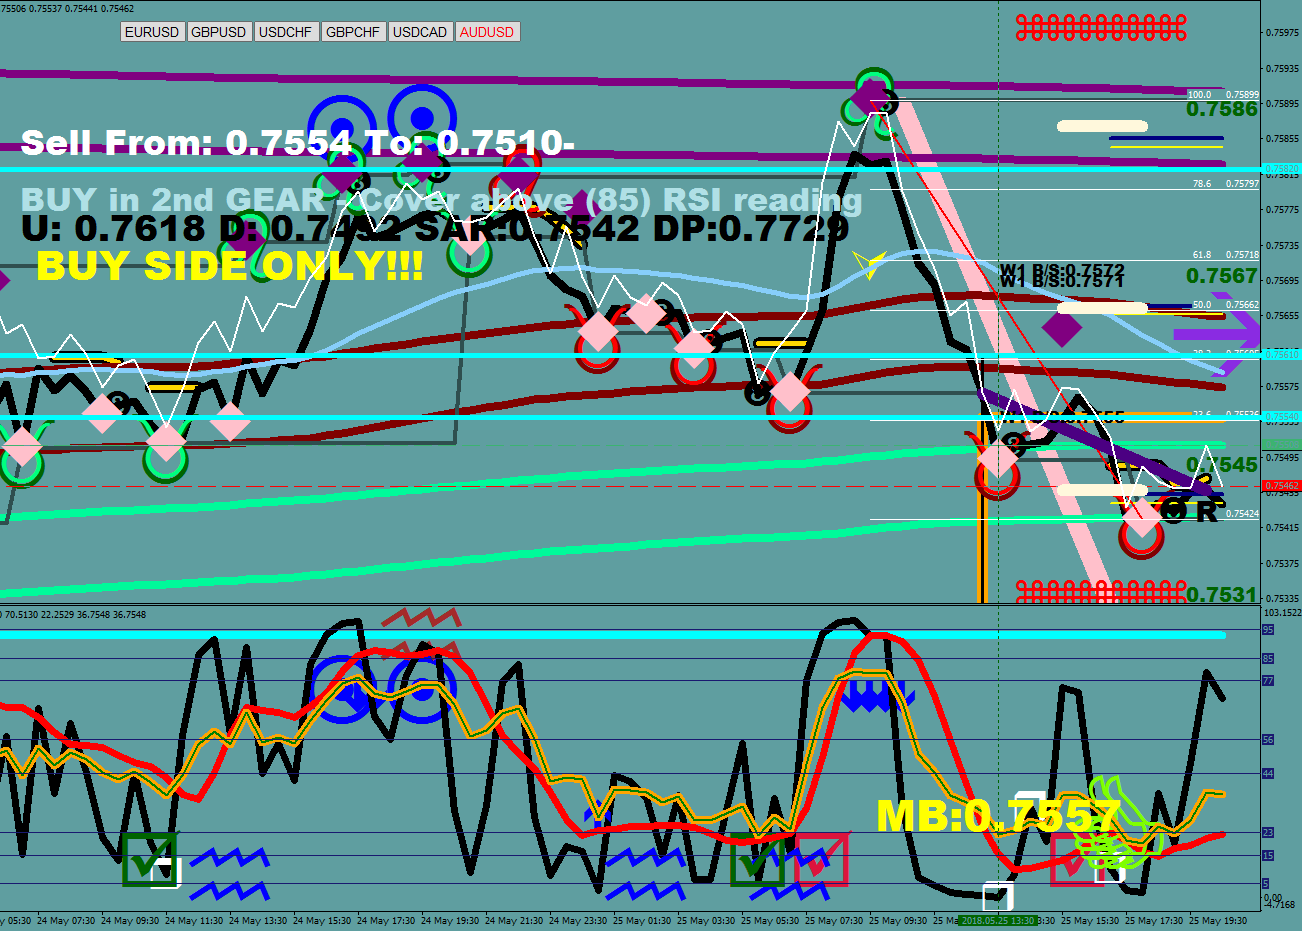
AUD/USD is already a buy
PSAR Trader Expert
ex4 – $299
mq4 – $399
my co-operation – pirceless
25 Stop/40 Target setting
E16 Trader – not currently marketed
Under development – article later:
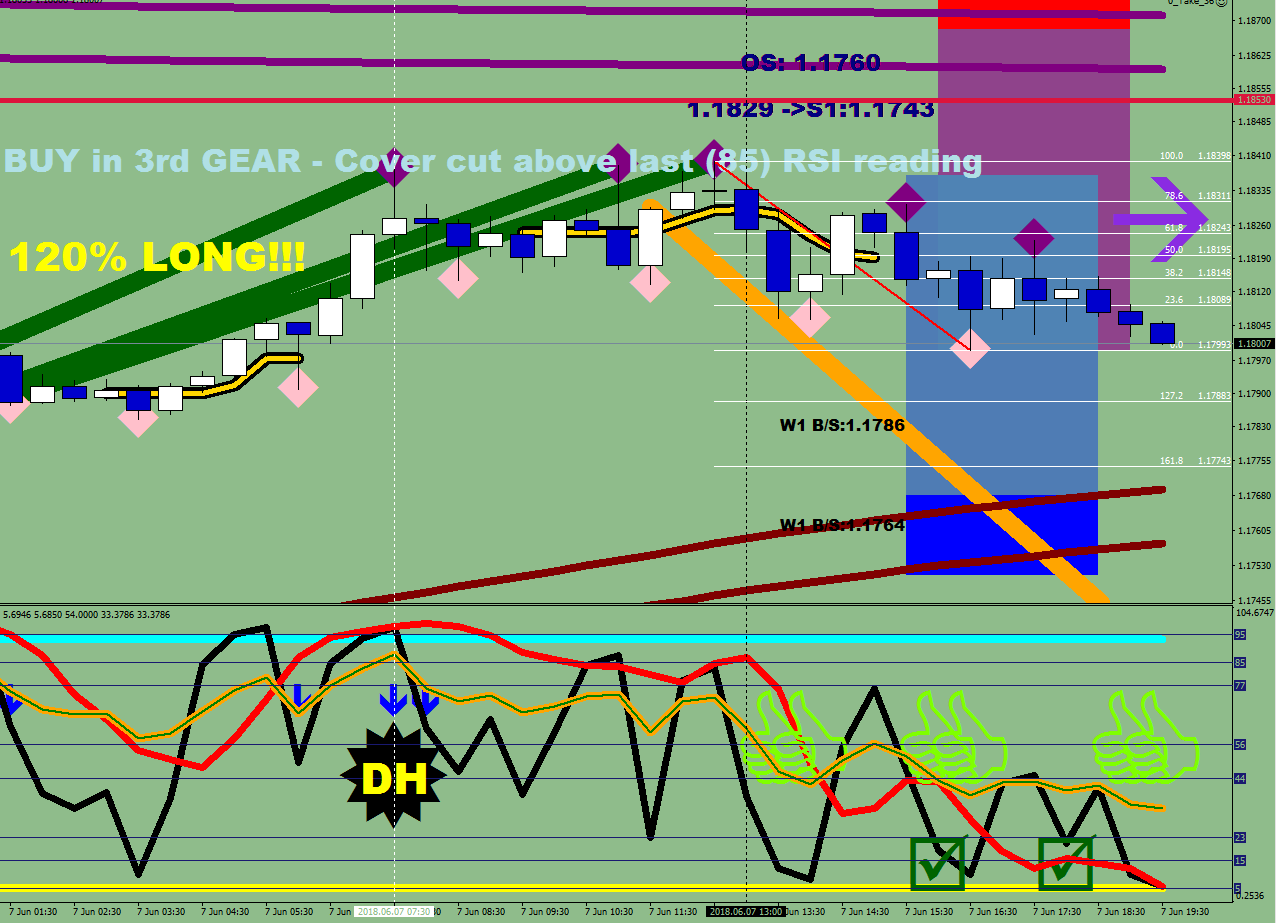
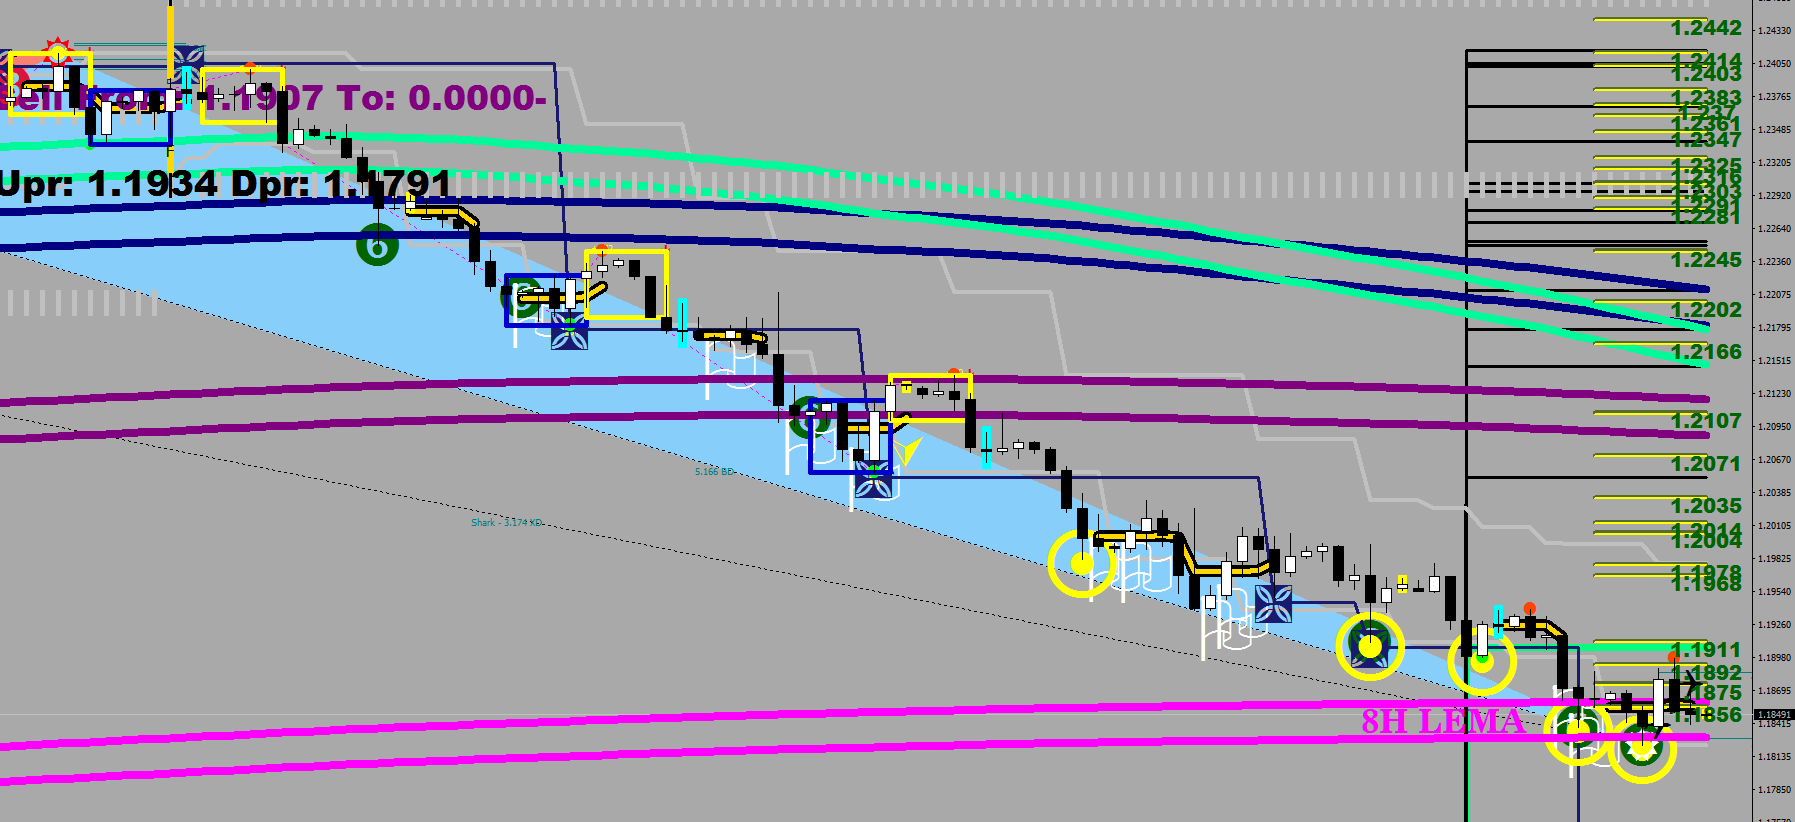
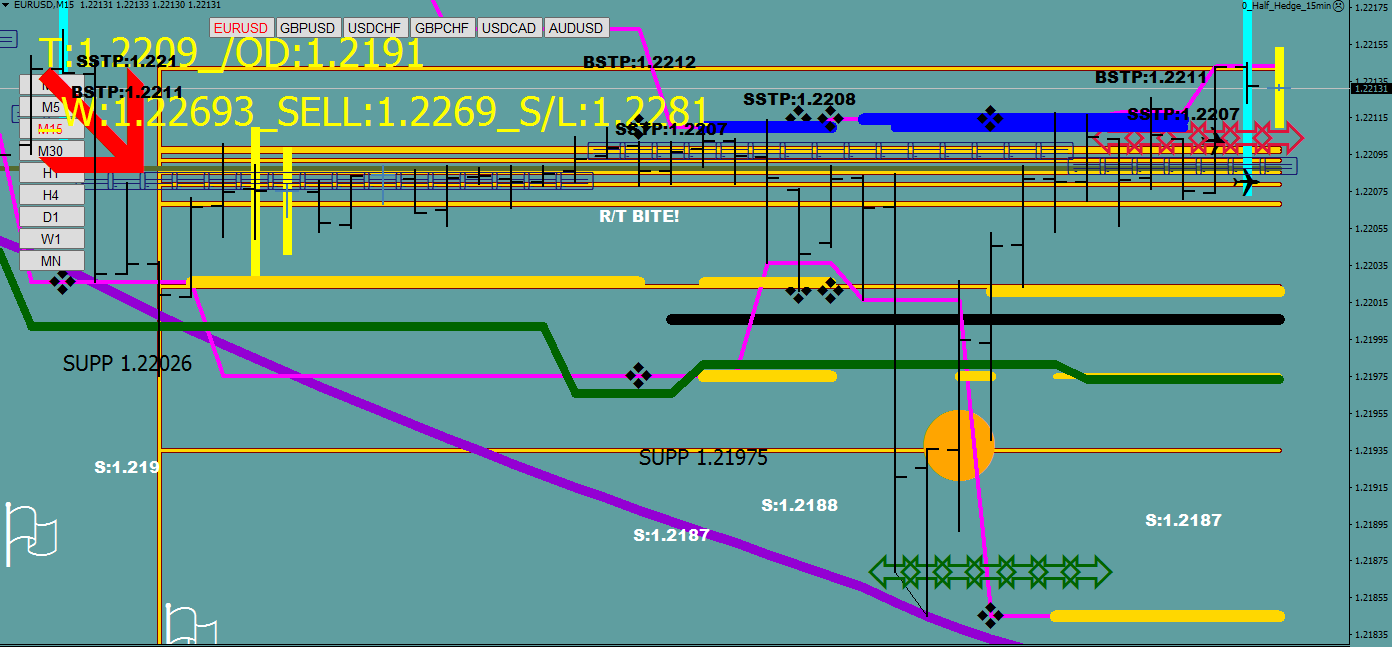
The barrier is the 8h LEMA


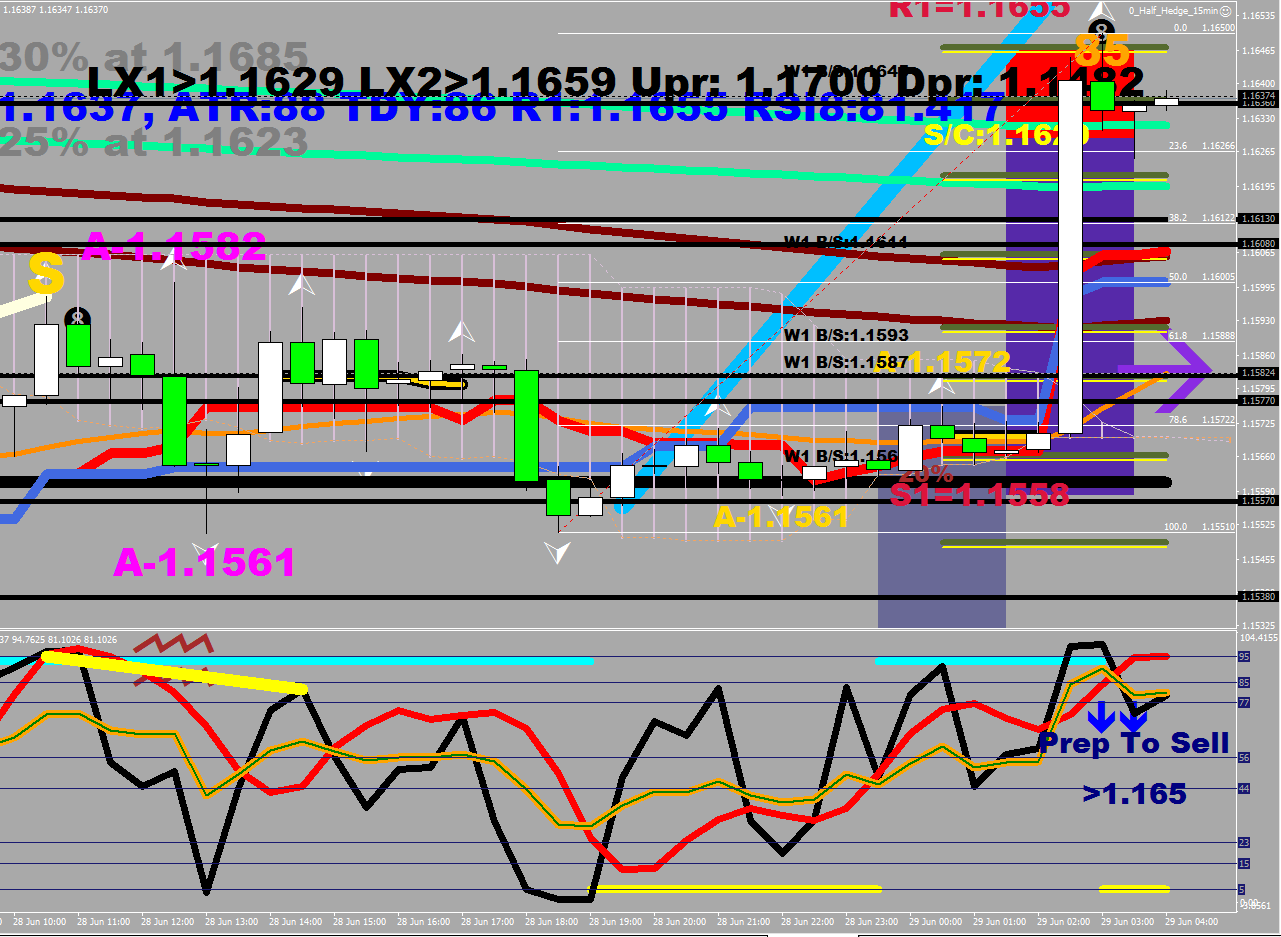
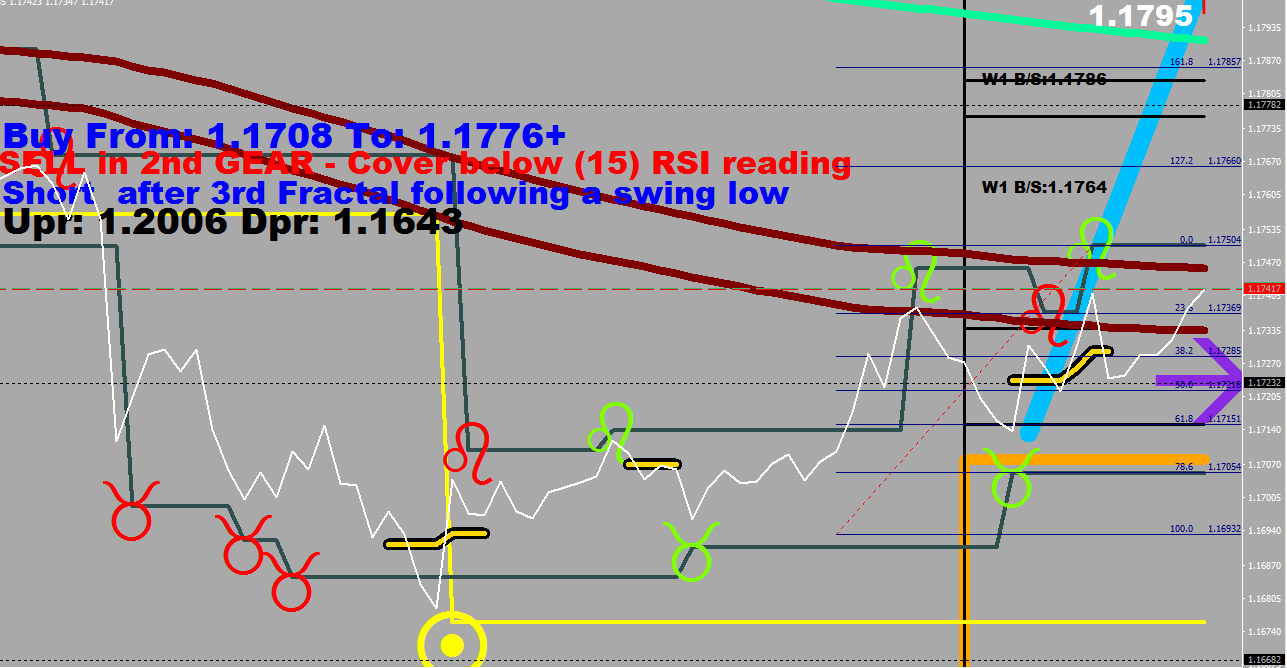
Buy 1/2 hedge:
if (nlongs<nshorts && (iRSI(NULL,15,2,PRICE_MEDIAN,3)>30 && iRSI(NULL,15,2,PRICE_MEDIAN,1)>10 && iRSI(NULL,15,2,PRICE_MEDIAN,0)<7 && RSI2[ArrayMinimum(RSI2,10,2)]<12 && iStochastic(NULL,15,10,3,3,MODE_SMA,0,MODE_SIGNAL,0)>25 && iStochastic(NULL,15,10,3,3,MODE_SMA,0,MODE_SIGNAL,0)<32 )
|| ( nlongs<nshorts && iRSI(NULL,15,2,PRICE_MEDIAN,0)<12 && iRSI(NULL,15,2,PRICE_MEDIAN,1)>12 && iRSI(NULL,15,2,PRICE_MEDIAN,2)>12 && iStochastic(NULL,240,10,3,3,MODE_SMA,0,MODE_SIGNAL,0)>80) && iMACD(NULL,30,24,52,5,PRICE_CLOSE,MODE_MAIN,0)>iMACD(NULL,30,24,52,5,PRICE_CLOSE,MODE_SIGNAL,0))
Sell 1/2 hedge:
if (nlongs>nshorts && iRSI(NULL,15,2,PRICE_MEDIAN,3)<80 && iRSI(NULL,15,2,PRICE_MEDIAN,0)>88 && RSI2[ArrayMaximum(RSI2,10,2)]>80 && iStochastic(NULL,15,10,3,3,MODE_SMA,0,MODE_SIGNAL,0)<76 && iStochastic(NULL,15,10,3,3,MODE_SMA,0,MODE_SIGNAL,0)>60 && iMACD(NULL,30,24,52,5,PRICE_CLOSE,MODE_MAIN,0)<iMACD(NULL,30,24,52,5,PRICE_CLOSE,MODE_SIGNAL,0) )
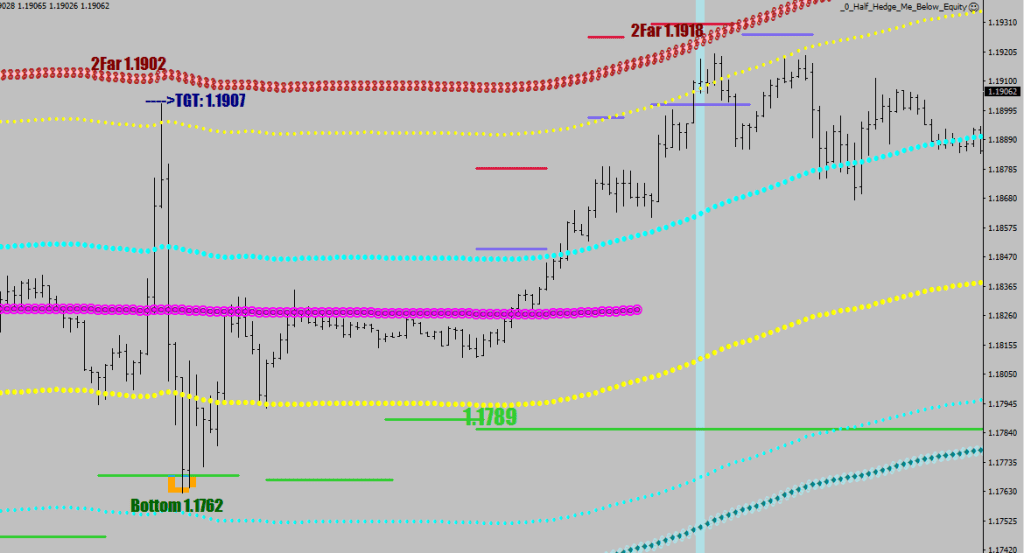
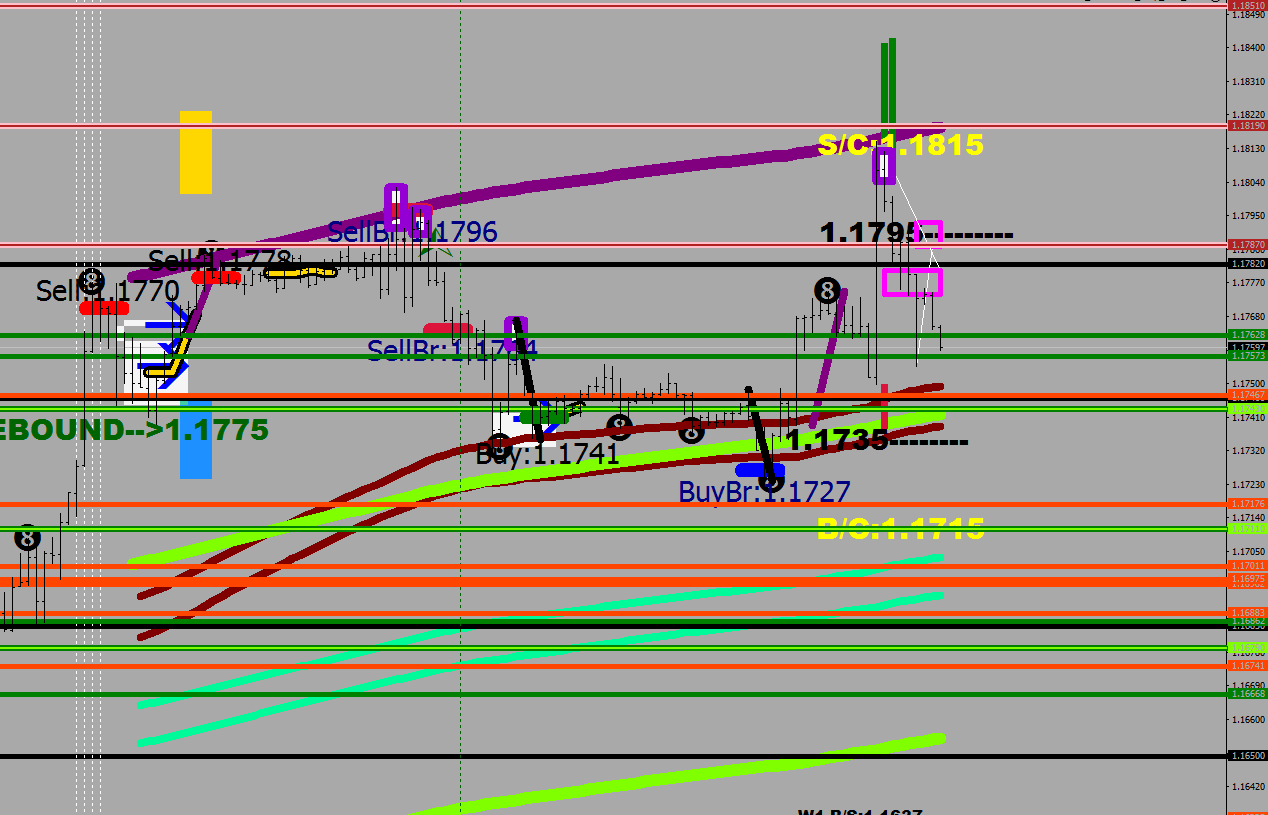
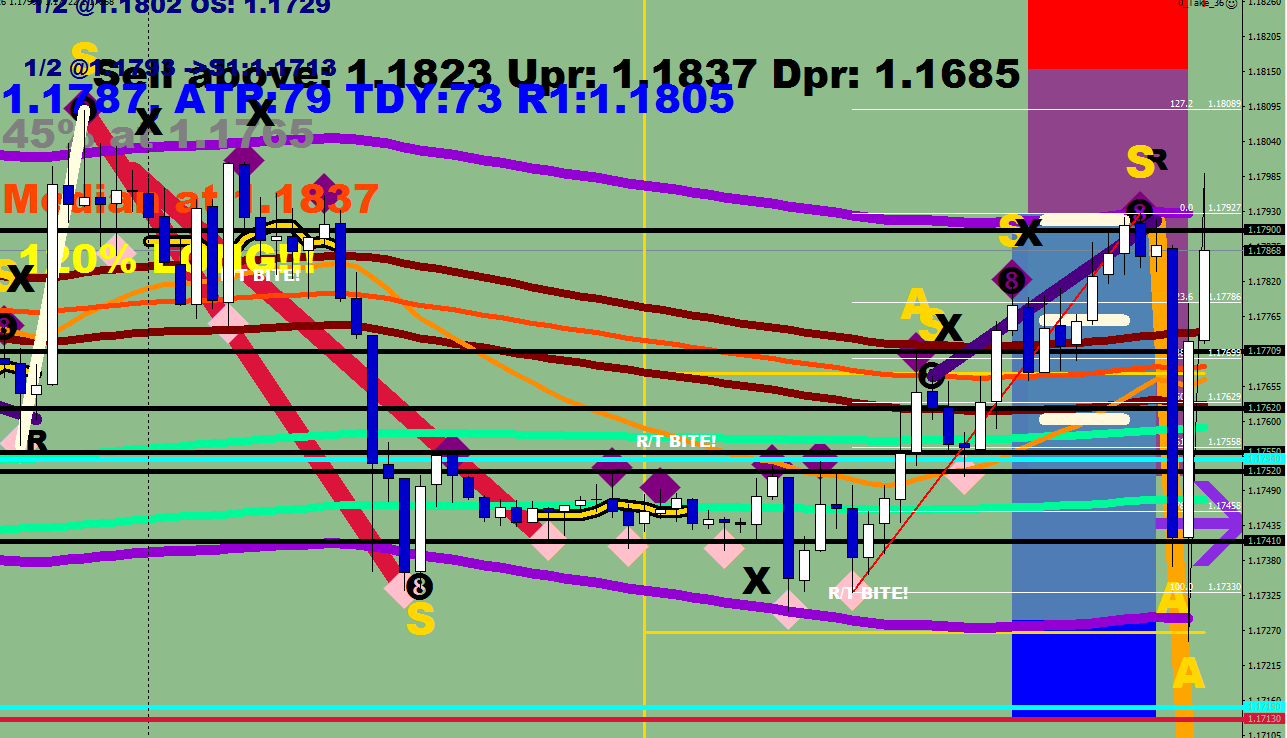
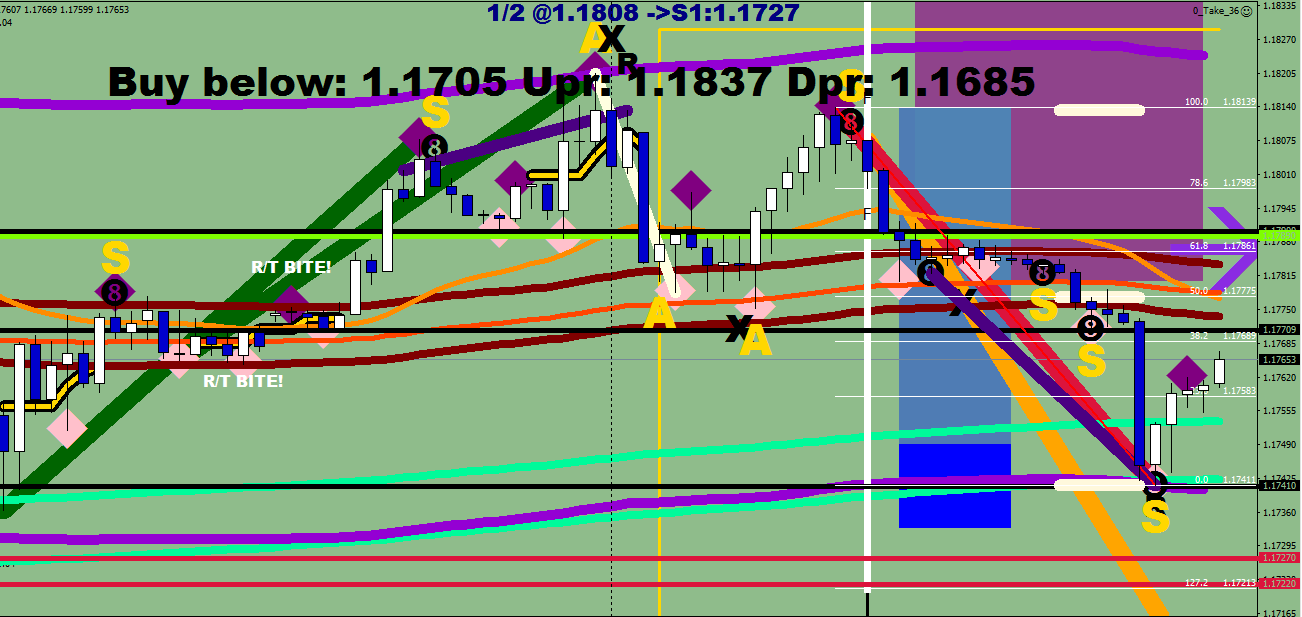
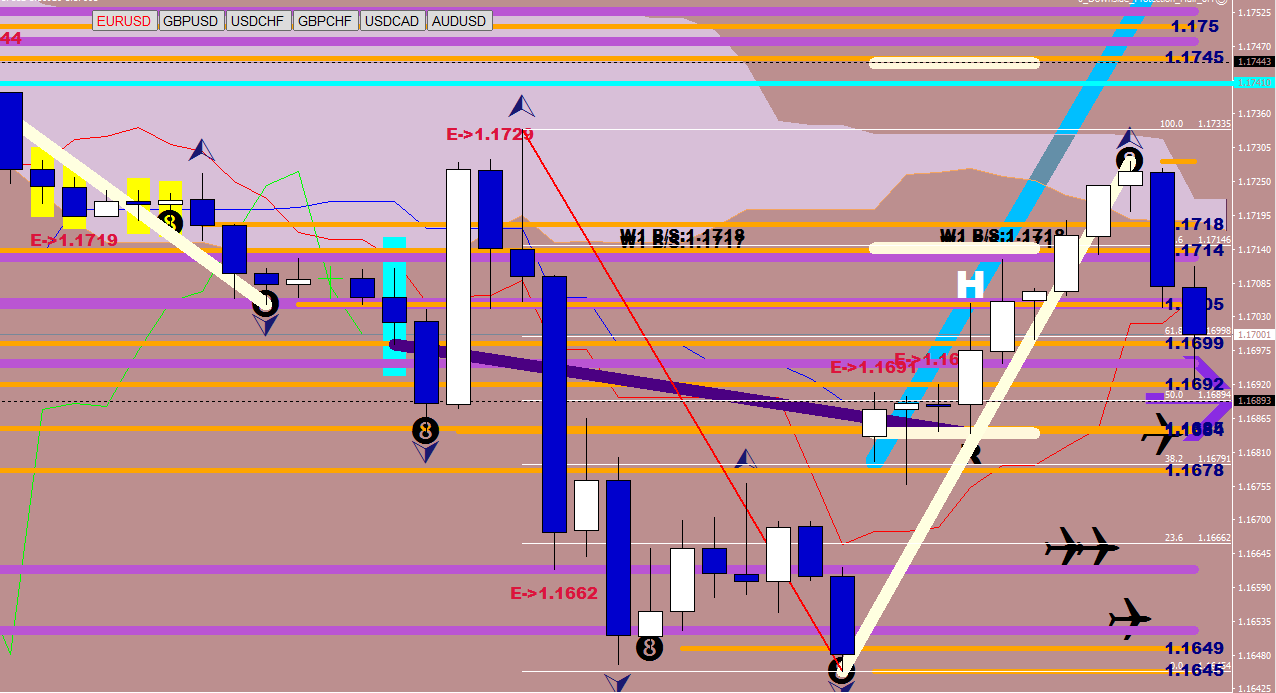
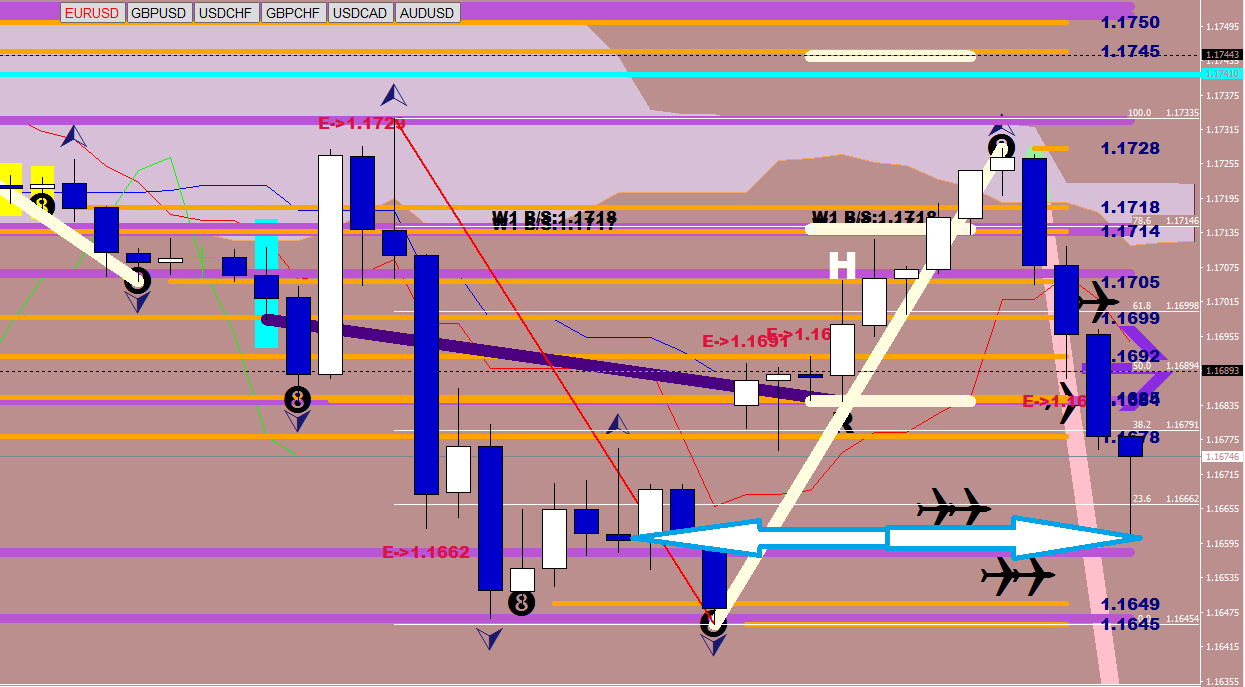
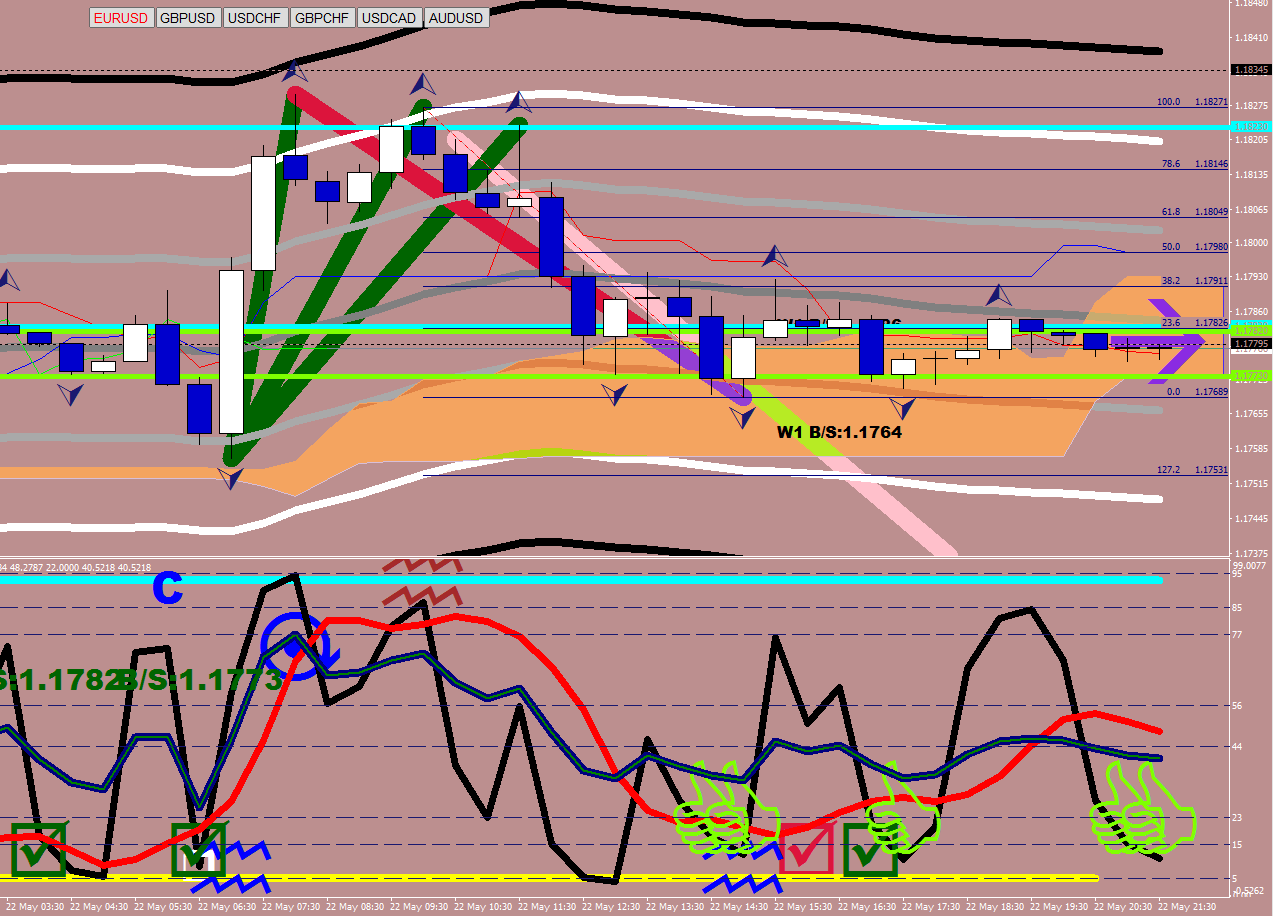
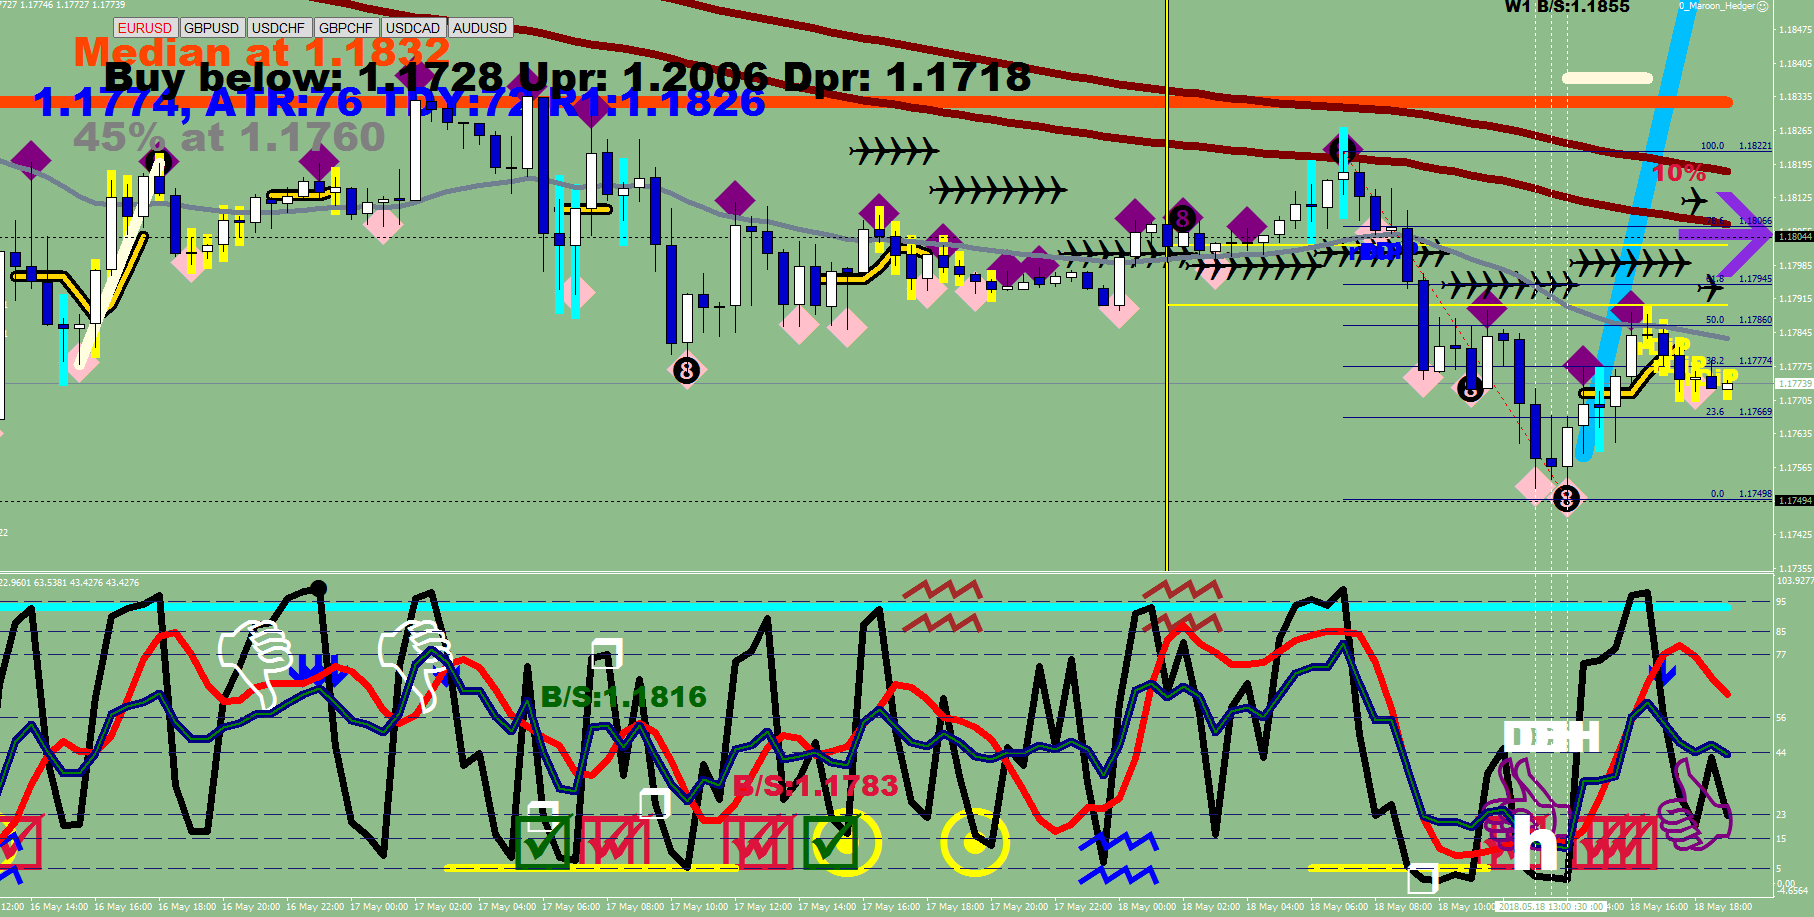
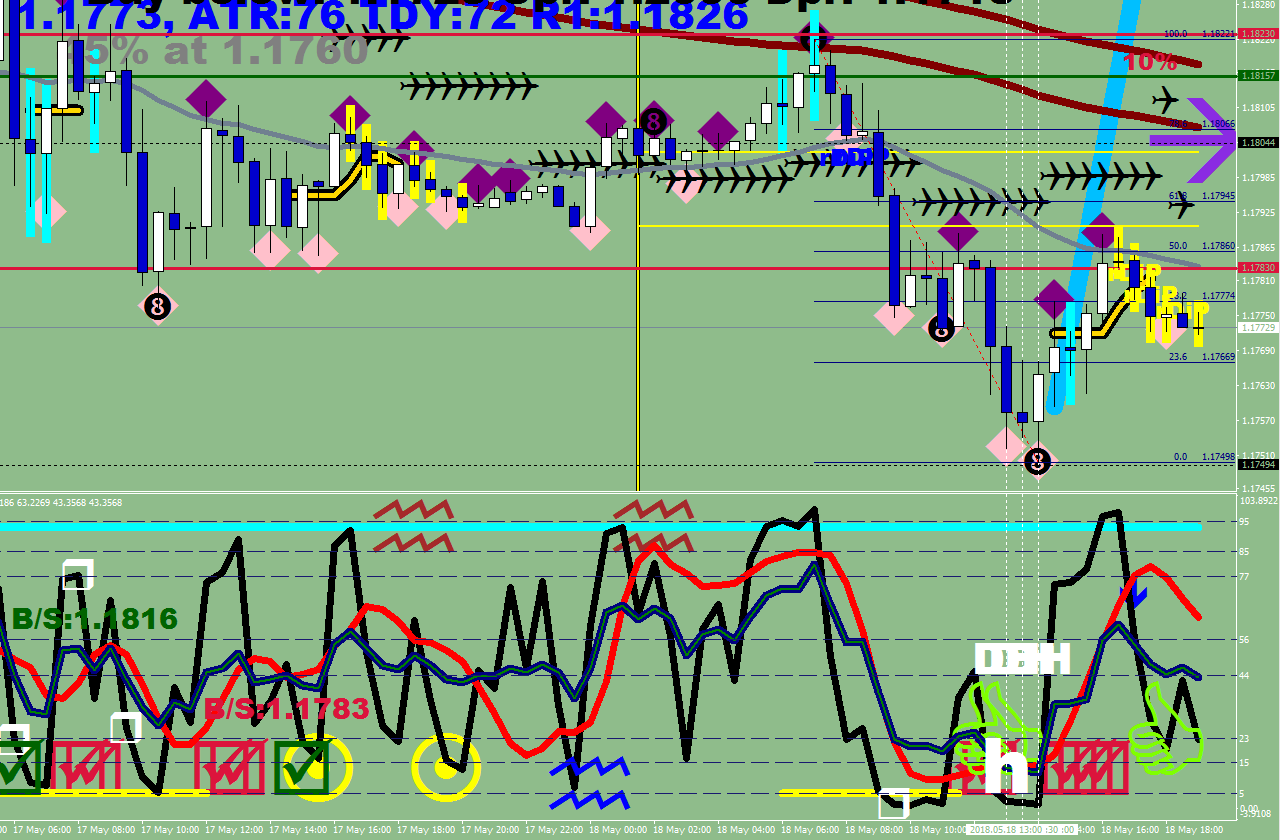
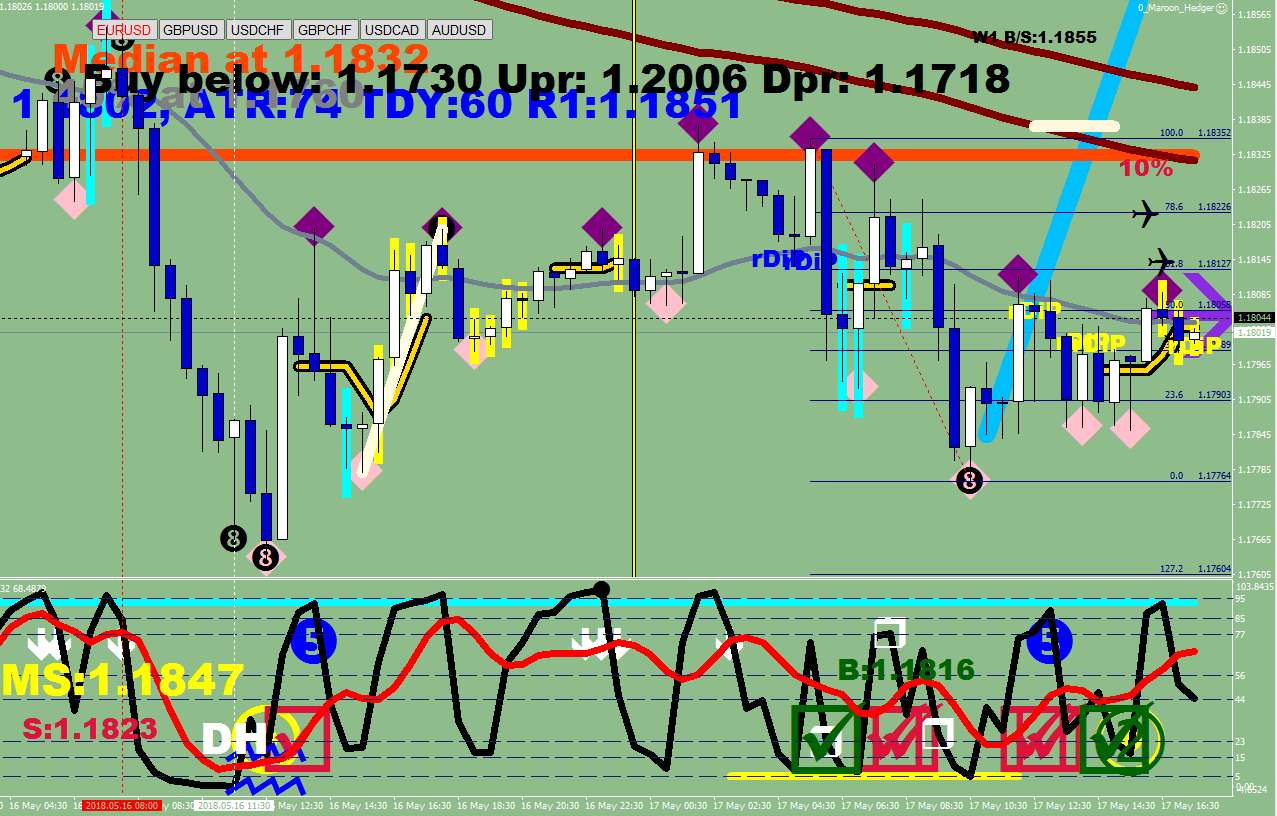
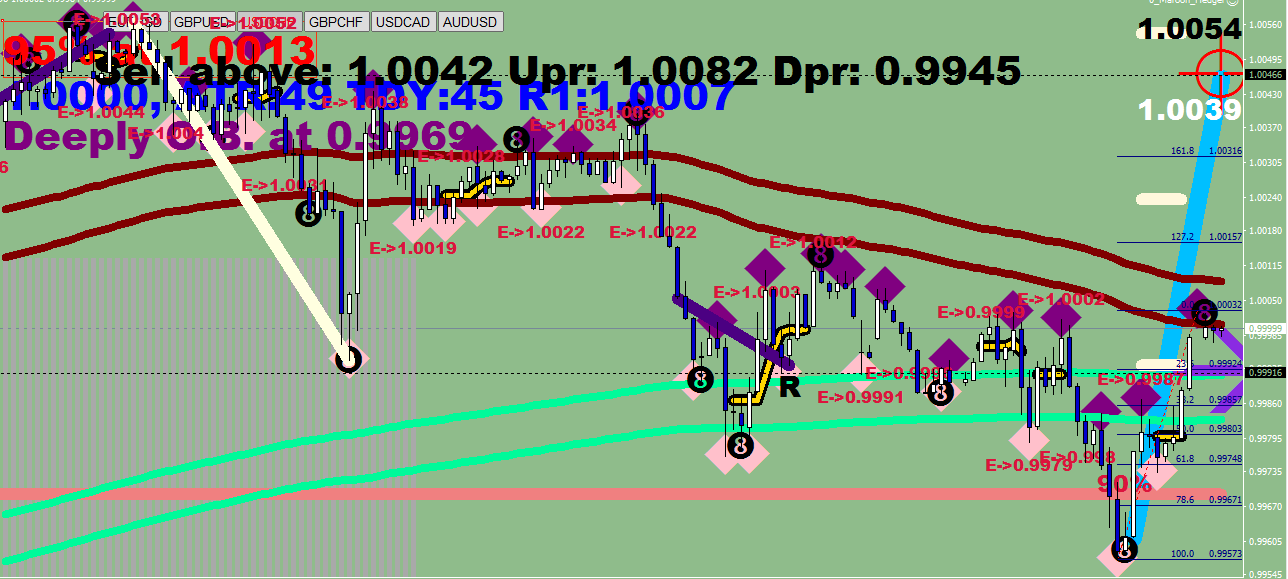
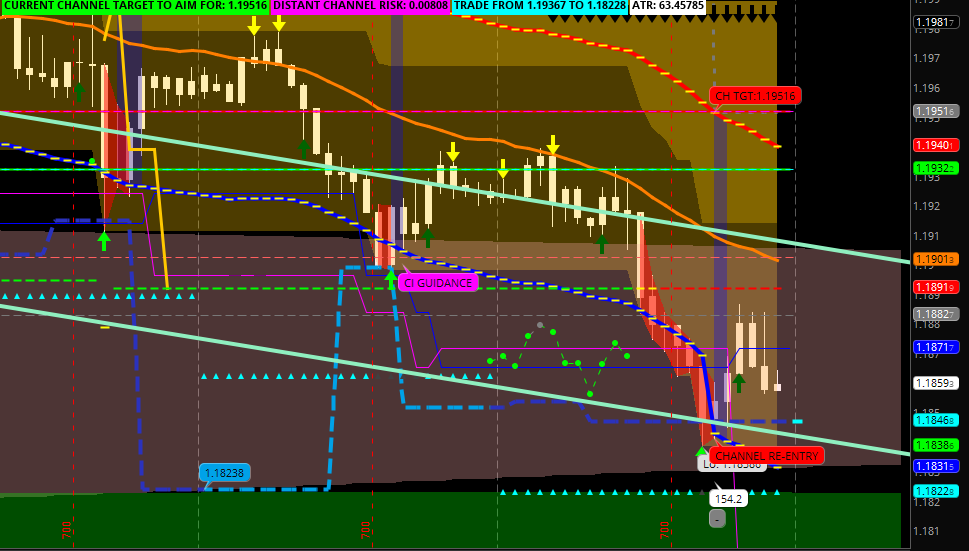
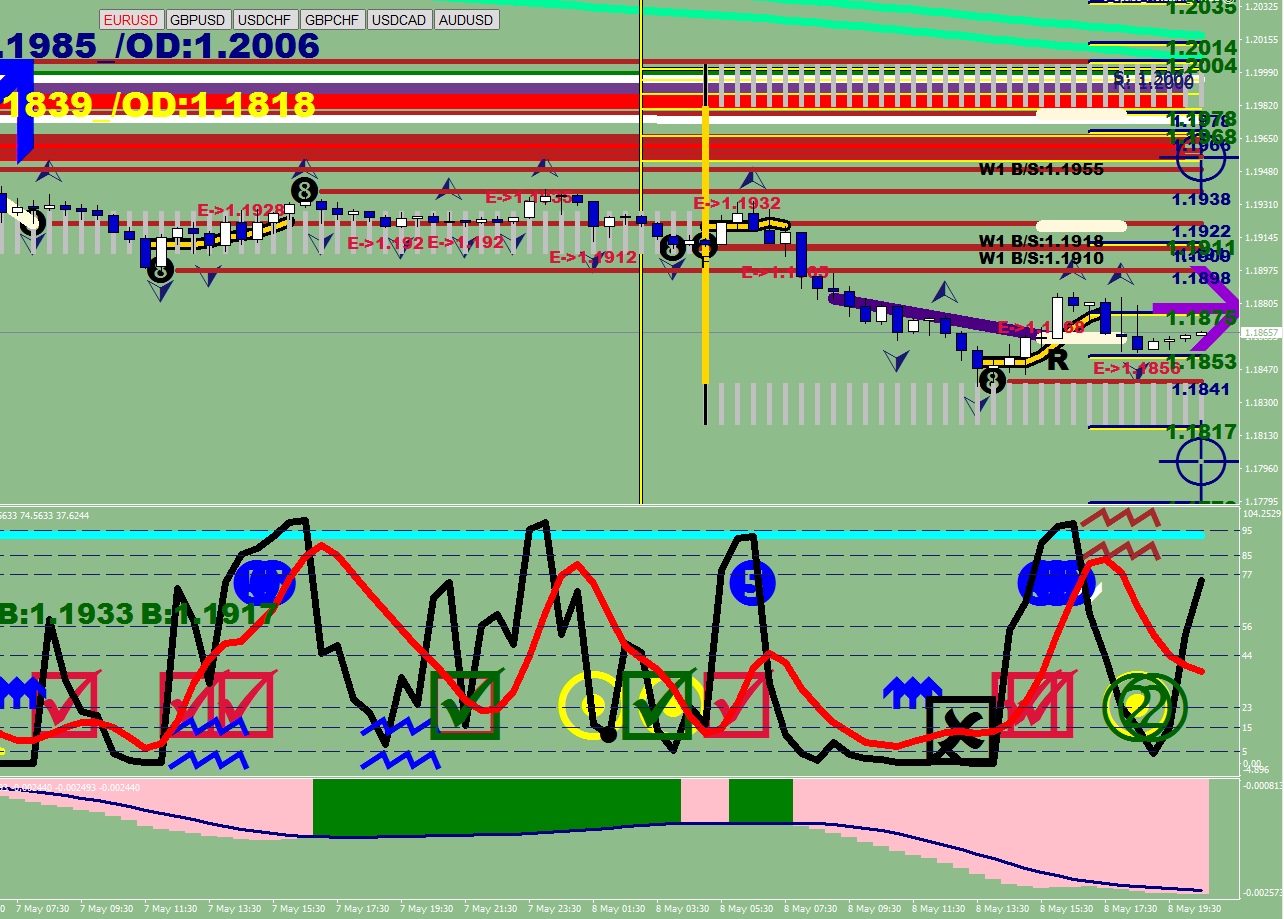
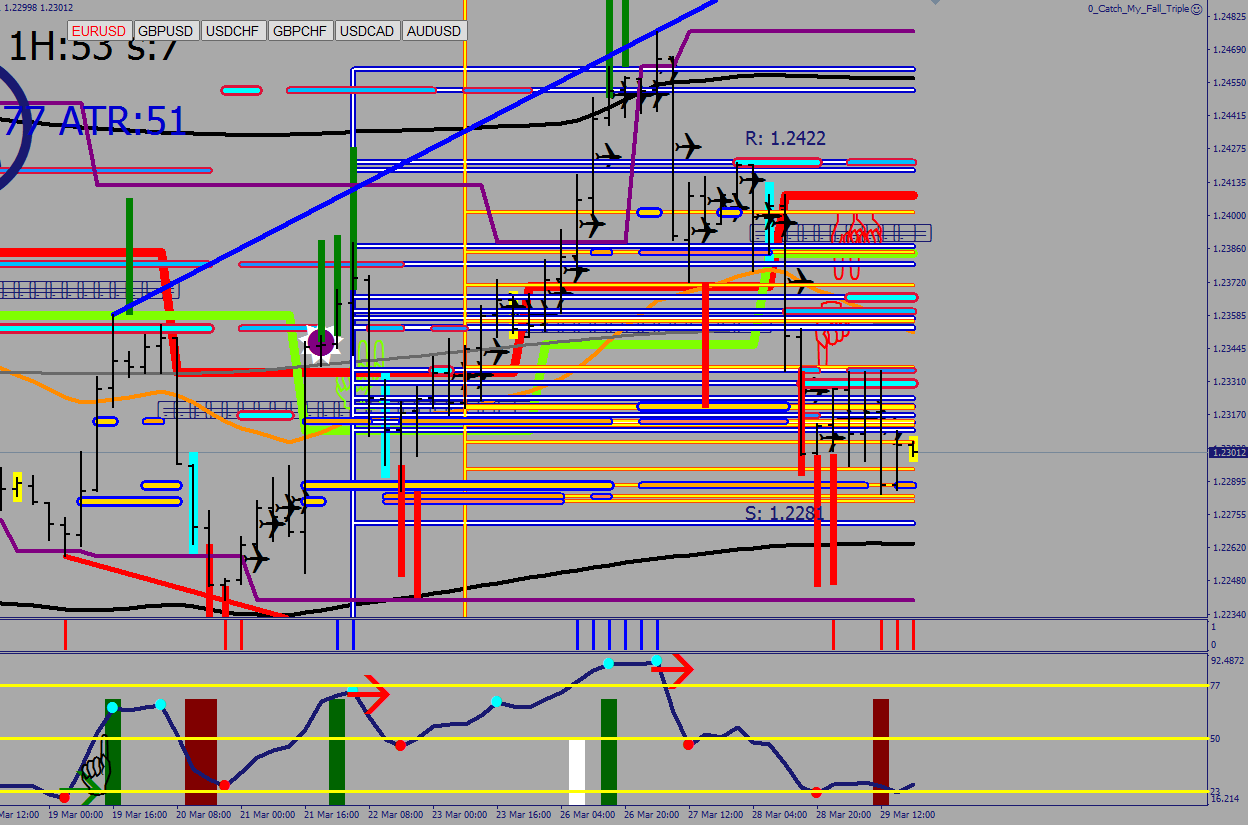
Green river, tatort, current ATR, W1, daily consolidation line, all at 1.1855

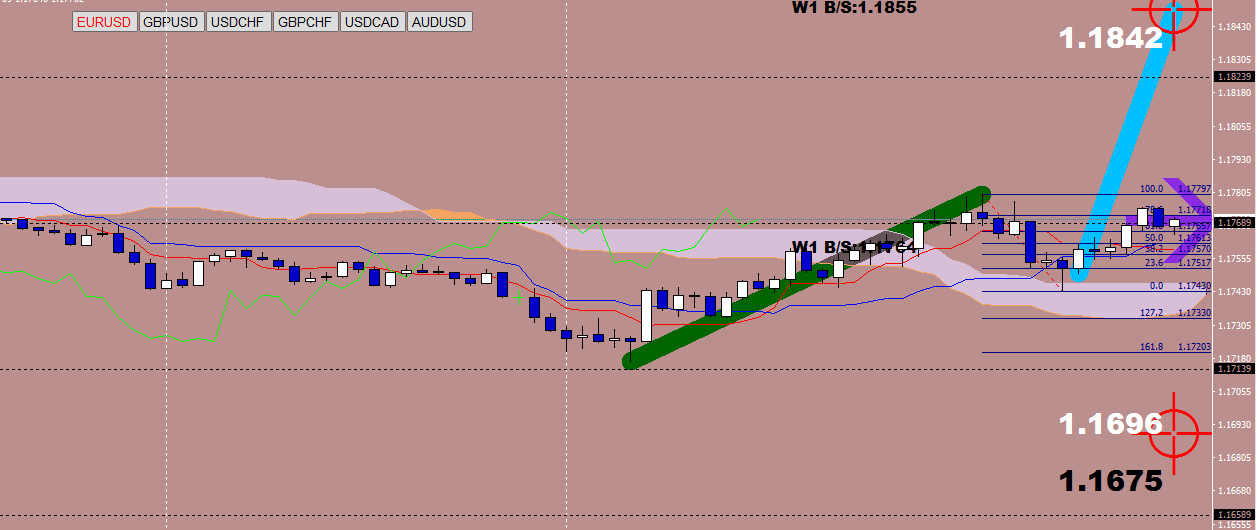

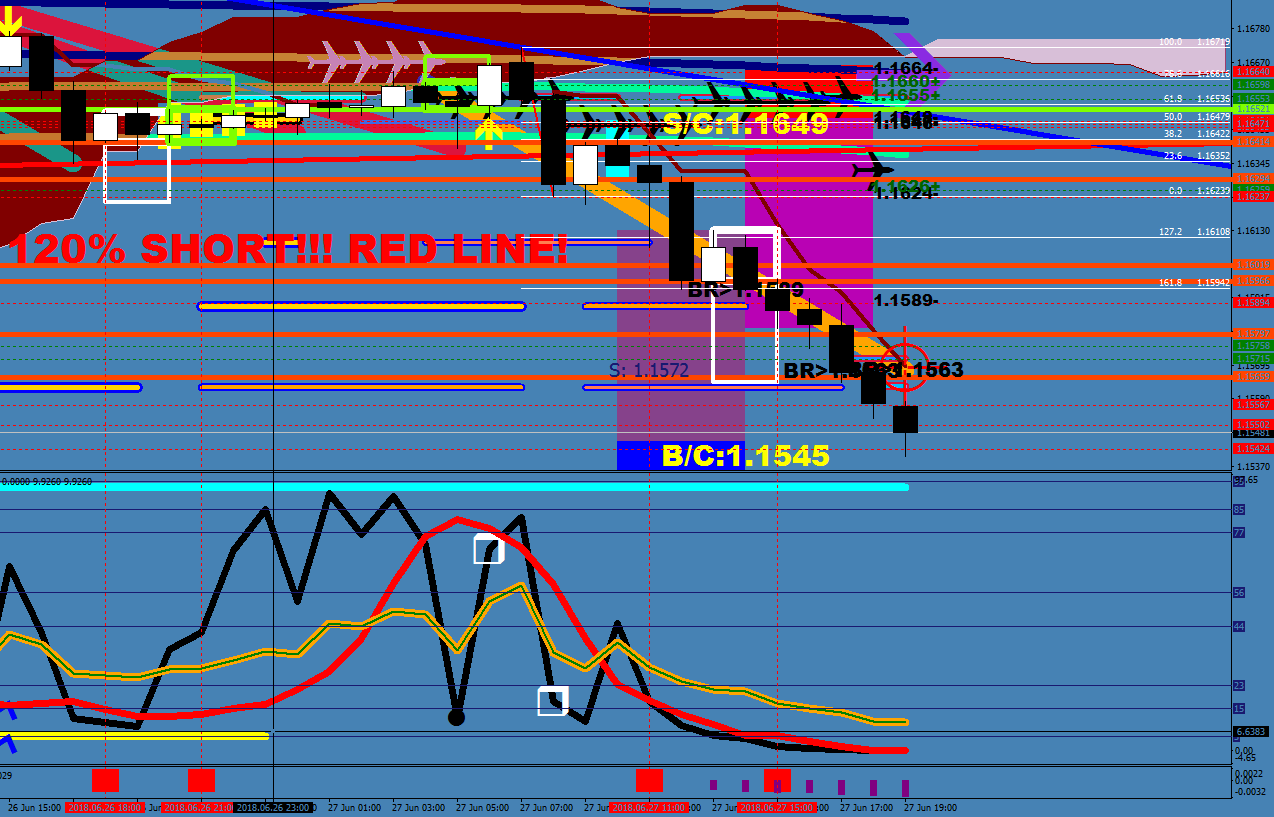
Look at the thick red lines. Closer, closer, too close!
The first red thick and the distance between the first pullback (E->1.1789) to the terminal point have something in common. Their (vertical) length.
The first sell gets the move going, the second finishes it off.

With the same logic, you currently have a minimum target around 1.1808 – for this swing. Since this would put the price above the cloud, you can expect another 3-5 days of further upside action.
The E-16 Hedger was fine tuned to hedge only if there was a greater than 35 pips separation from the EMA and no touches in the last 10 bars.
Re-designing for better visibility & understanding
The dual color line is an RSI8
What do you think?
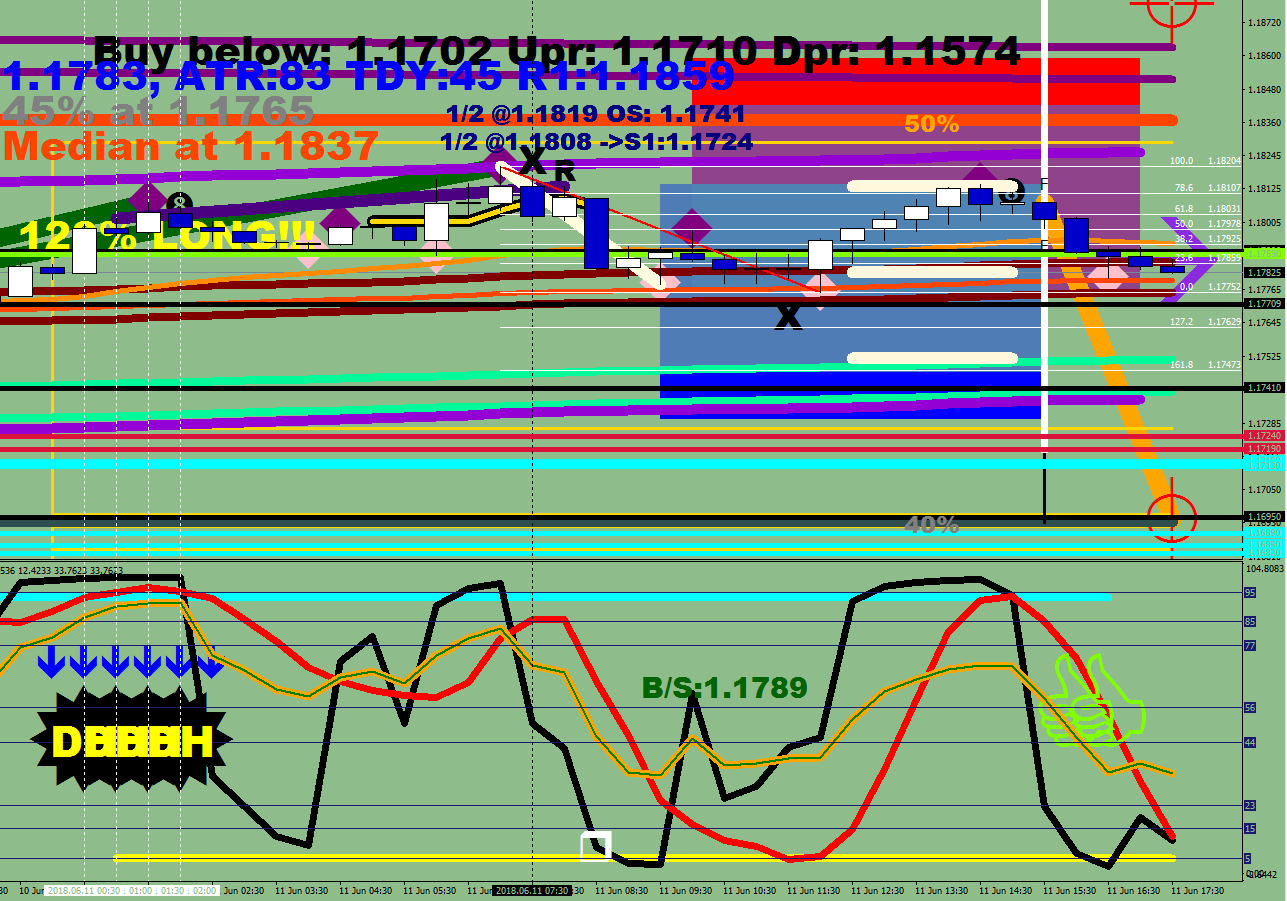
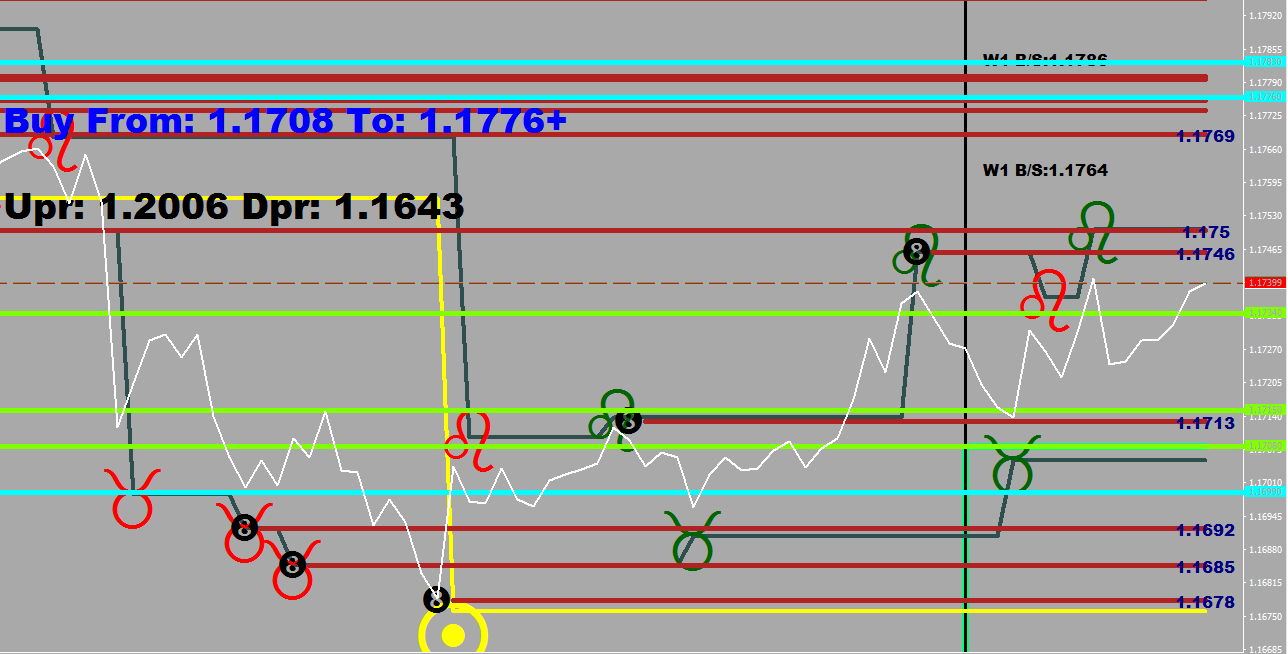
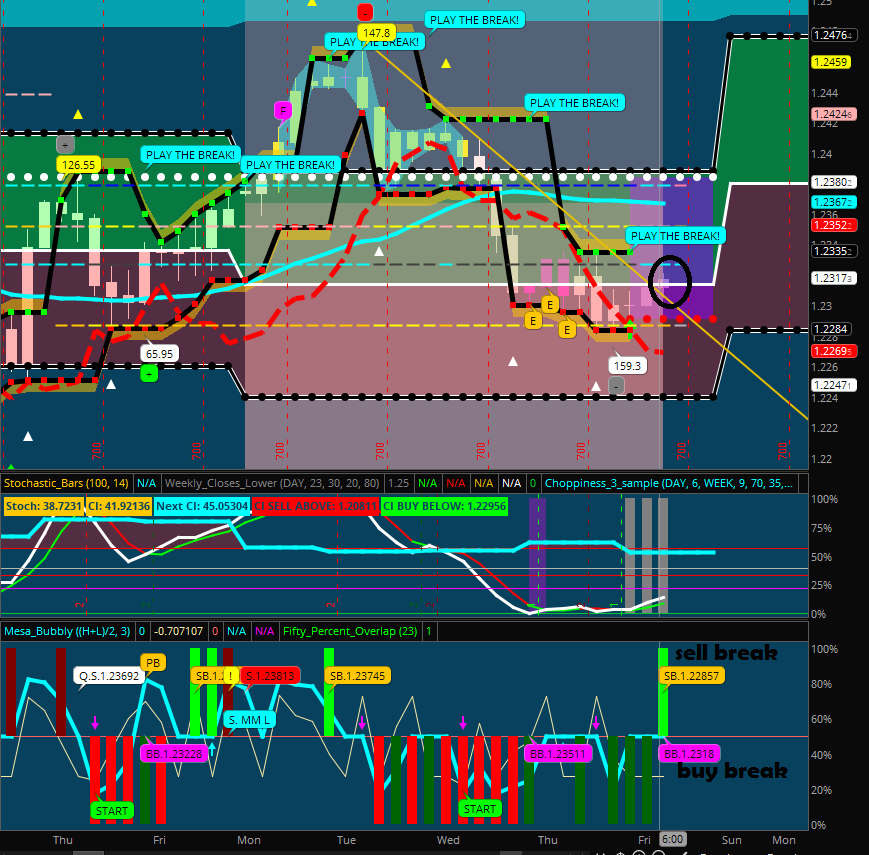
And how about horizontal lines based on the B/S numbers? Chartreuse thumbs up?!
How about dual color Darkest Hour?


Now with vertical lines.
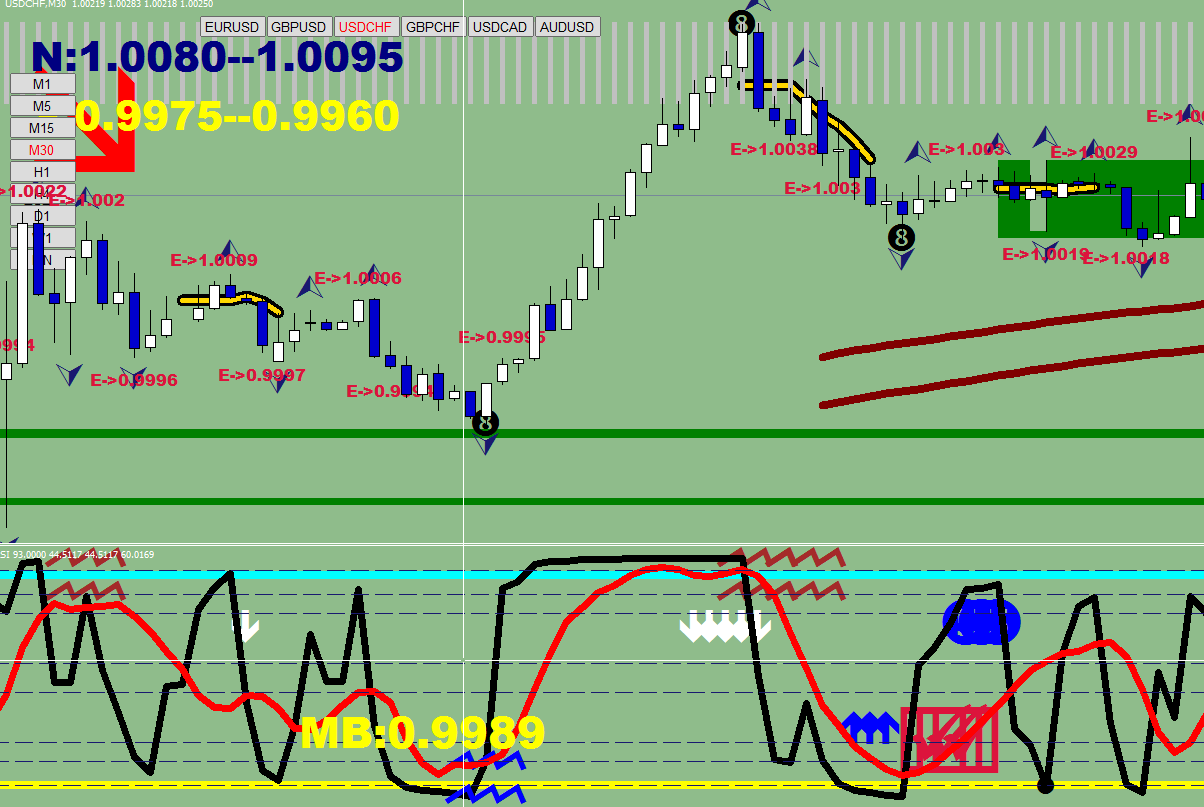
The best to use MB/MS on are relentlessly EUR/USD and GBP/CHF, but you never know…


Victory & victory
Check the location of the Maroon Sell and the Darkest Hour (now allowed for 30 min)

An example of the “h” walked off… correction via time.

The best trade for yesterday would had been this: 40+pips on a GBPCHF short
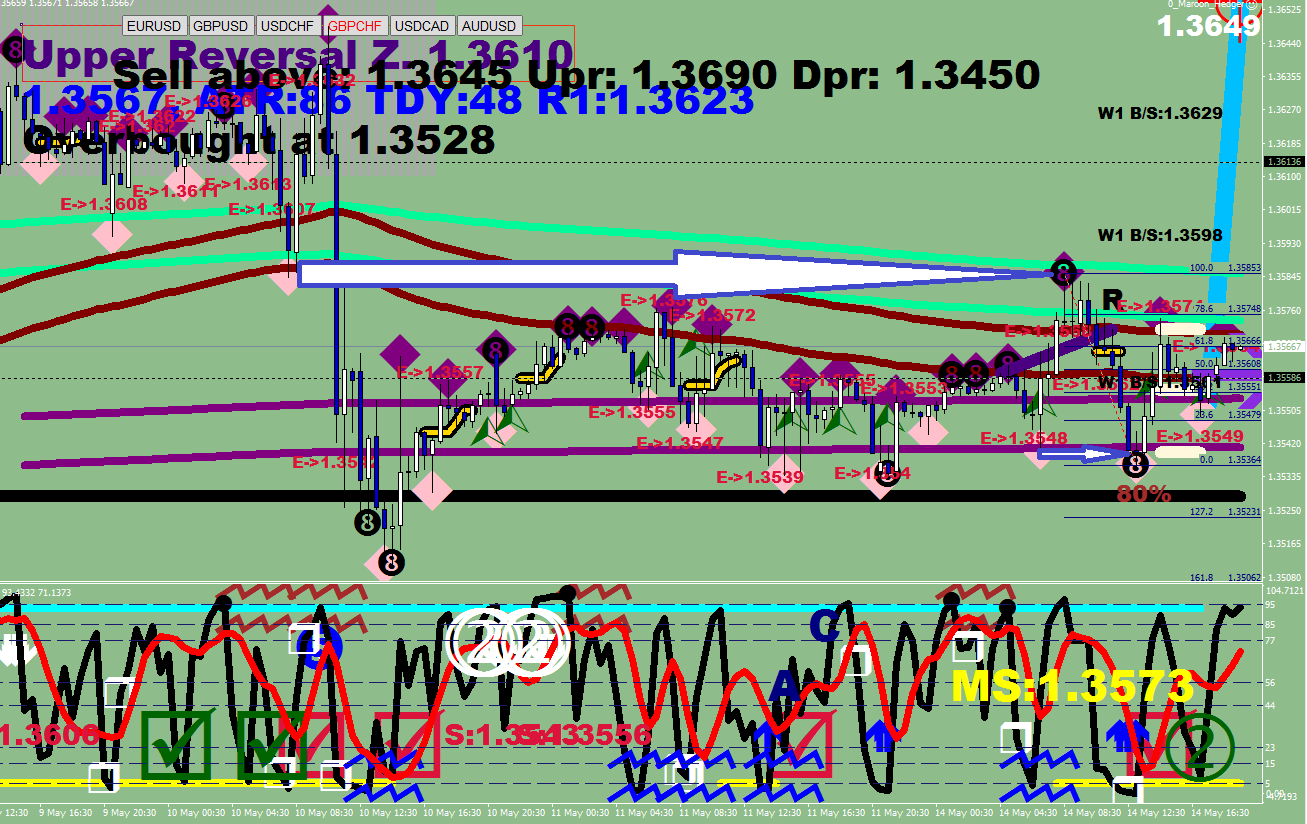
Bearish setup, GREEN river above Maroon, both headed lower. Back test of swing point, travel down to the prior swing low (Fractal) and out. I was not in it.
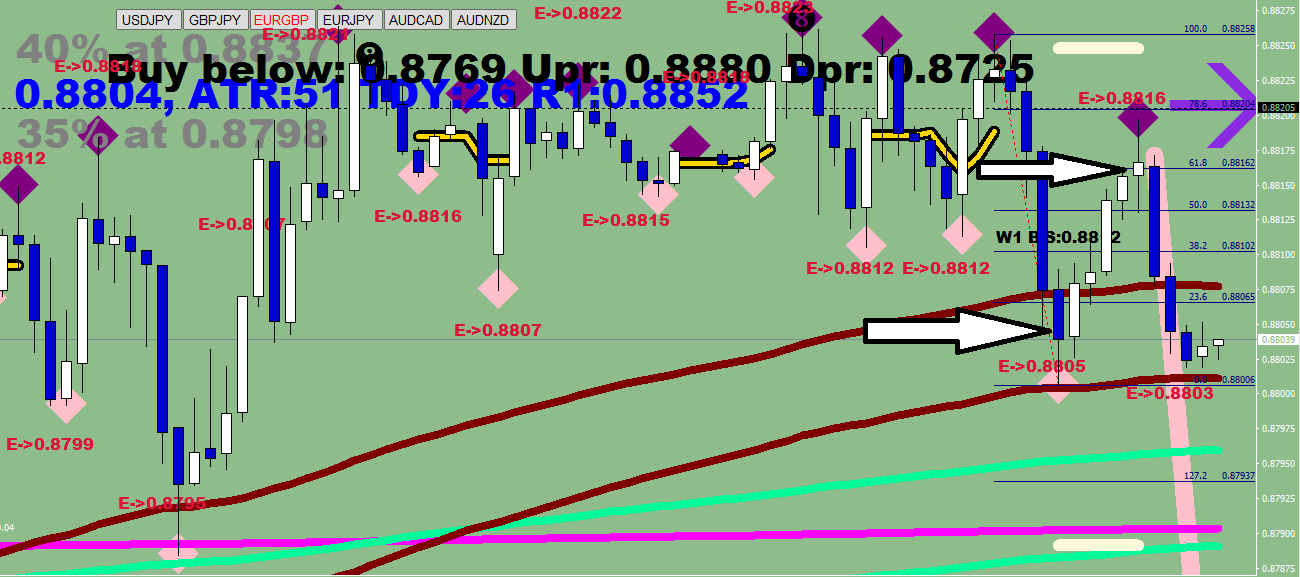
I was chasing longs. I was in EURGBP. Bullish config. Buy was too confident.
Entered 0.88056, set target to 0.8820 – and got out shy of that. Not very much.
Now I’m in a short – that is not really performing so far. USDCHF. Config? I think it is missing a right shoulder for a complete reversal. Could see 0.9975 back – and would make me close it. If it moves against me more, I might just build.
In the upper reversal zone, just below Maroon.


My problem with the EUR short was principlals. 50 pips is nothing to sneeze at. The config was semi bearish, yet price was above the Green River. I would call this risky.
I closed my long, as I said I would by 1.1988. Closing a long and going short are two different things.

I was also in a short of GBPUSD from 1.36.
1.1877 would be out of oversold & match the previous week’s high.
Too Bad, I wasn’t looking for a pair a week ago…
Look at all the Maroon Buys, then the squeeze LEMA sandwich and the inevitable break in the direction…
Well, something to keep an eye out for next time.
A pullback to the Maroon could be a buy.
Most pairs are at or arriving to their Median. Try to make a call there…
It’s like Christmas Maroon Sell all over again…

MB? I can only guess. How about Maroon Buy?

Testing it now. Later I will entrust it with opening capabilities as well (based on equity size).
Mike Maroon (3-minute LEMA) is now included in the 30-package. Later on this in the “2-minute Warning – 2018” article

DH stands for darkest hour – a feature designed for 15 min chart.
Tell me that 1.25 did not look like a short.
Those lines are the Monthly LEMA Quad.
Weekly Green River coming up…


Daily consolidation lines on the right. 1.1960 is the closest one below. 1.2169 should have happened, but it did not happen…
Found resistance at the 4-h LEMA

Root point migrated lower, energy reached 51+ (consolidated). 1.2068 was re-tested
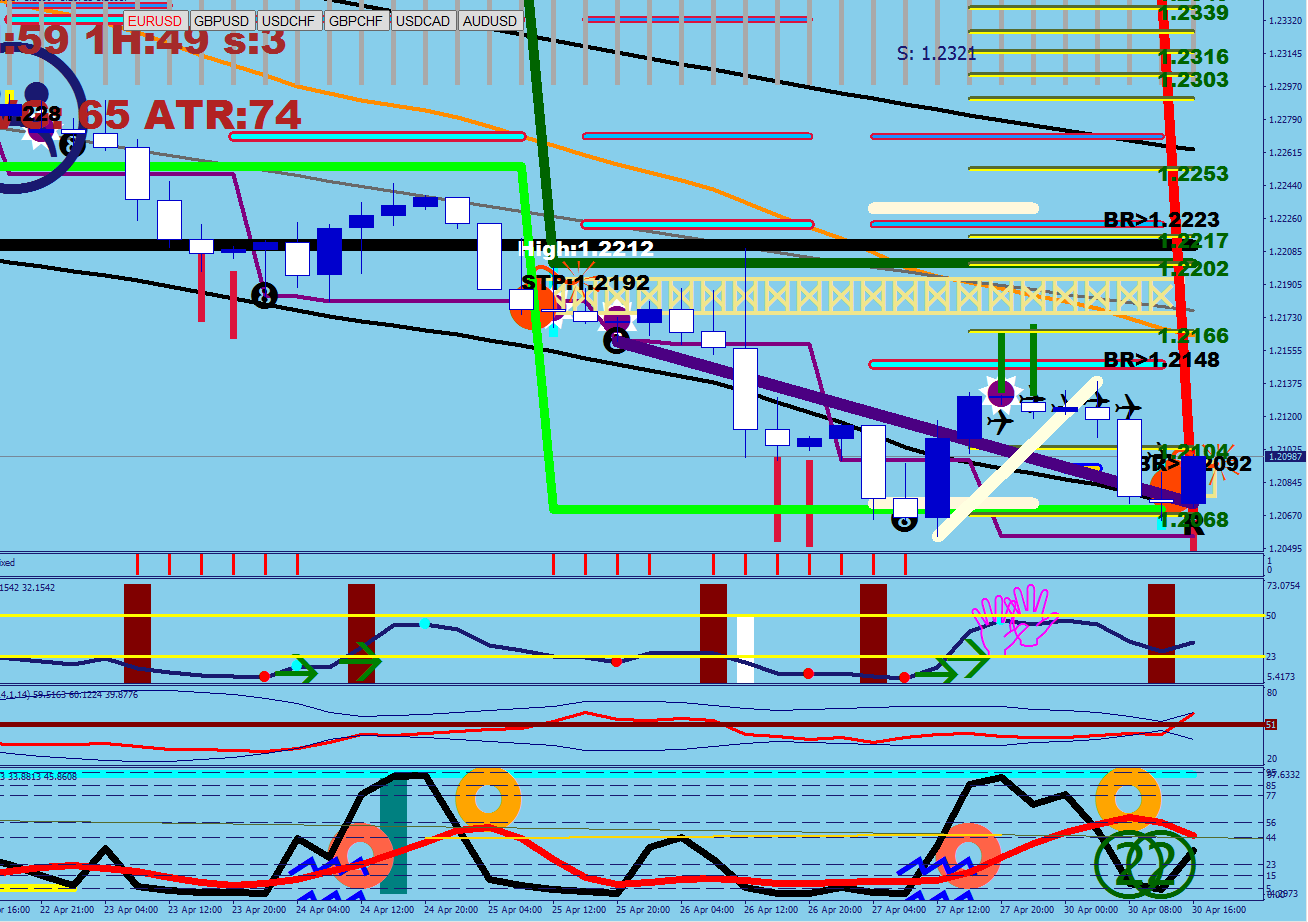

Bounce off the cover level – 1.5xDATR-15 pips level (Lime)


Ping pong? How about Root Pong?!

Apply comfort levels, and you will find, that they shorted the top of the upper reversal zone or 95% of the 4H range.
USDCHF just walked into the overbought
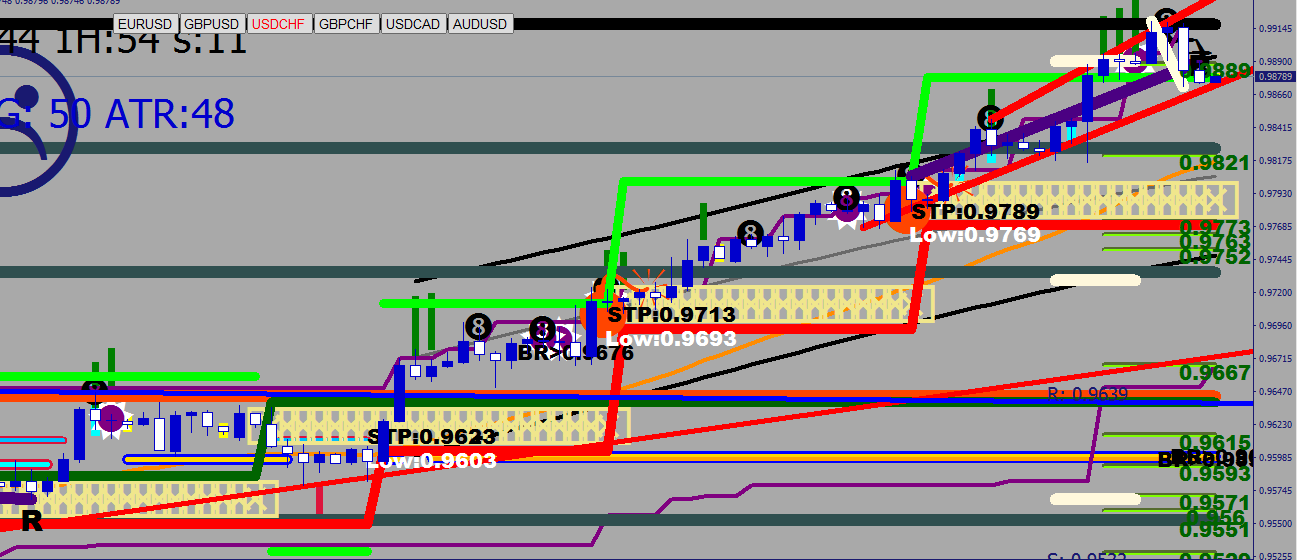
It went all the way again, into overdrive, close to 1.2191. 4H energy is at 29. No head yet, no new consolidation. New root point at 1.22129
1.2250 or even more so 1.2271 should be back-tested though.
The risk is that you’d get 3 days below the oversold neckline of 1.22355 – it is called embedding and yields you a trend.
New Root point -> new midway point
H stands for High Charge

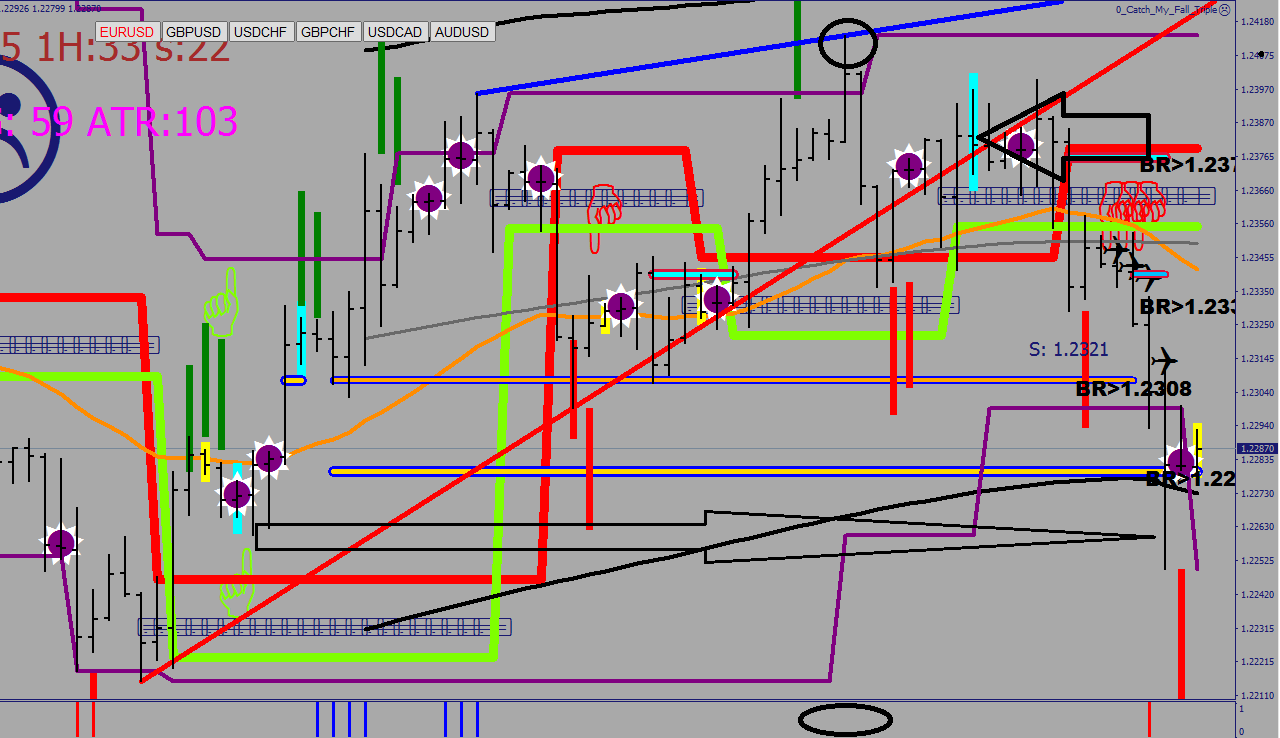
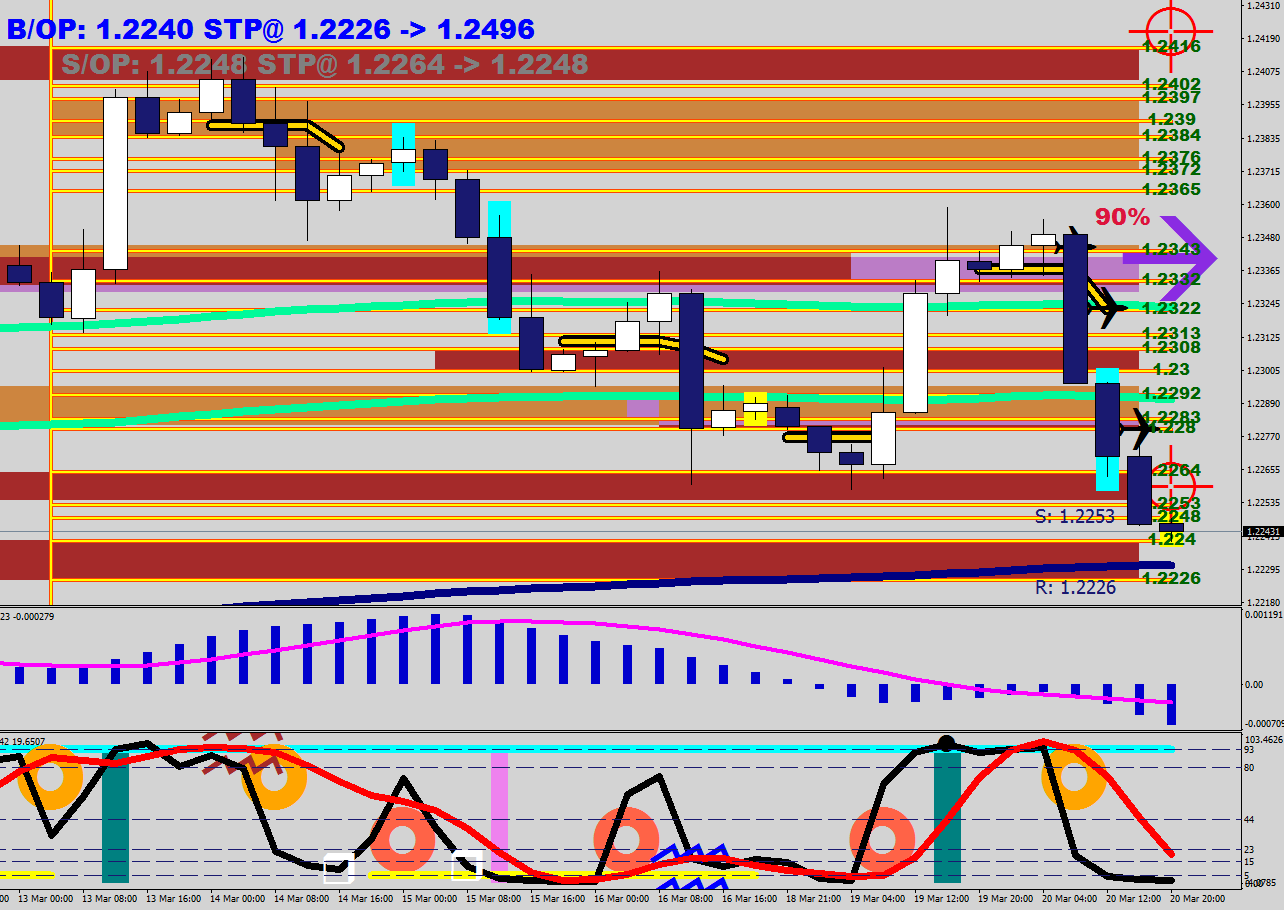
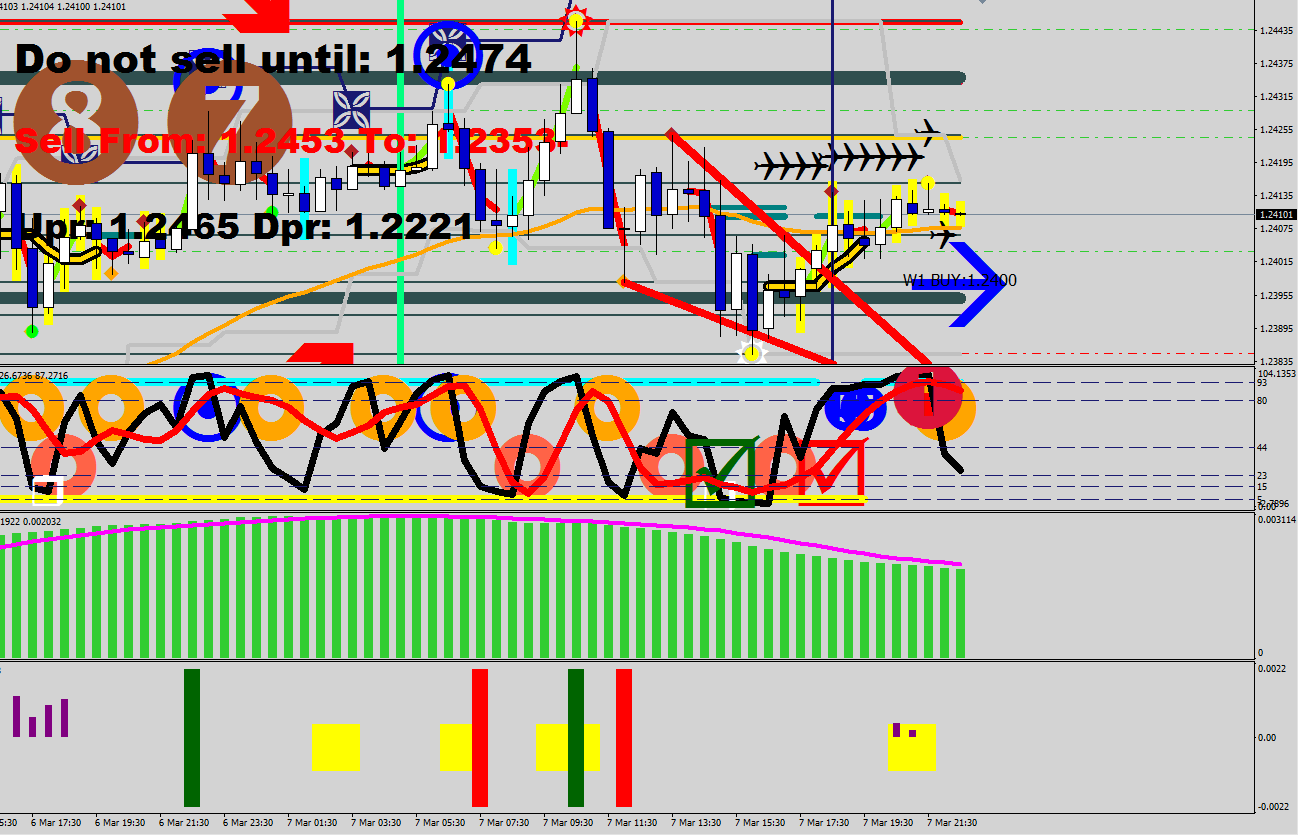
If I was asked right now, where would price go to on the upside, the answer would be very, very easy.

In conclusion, upon taking out the Root point (couple of hourly closes above 1.2293) , you would see a move going back up to 1.2338-1.2340
BTW 4H overbought neckline is at 1.2211
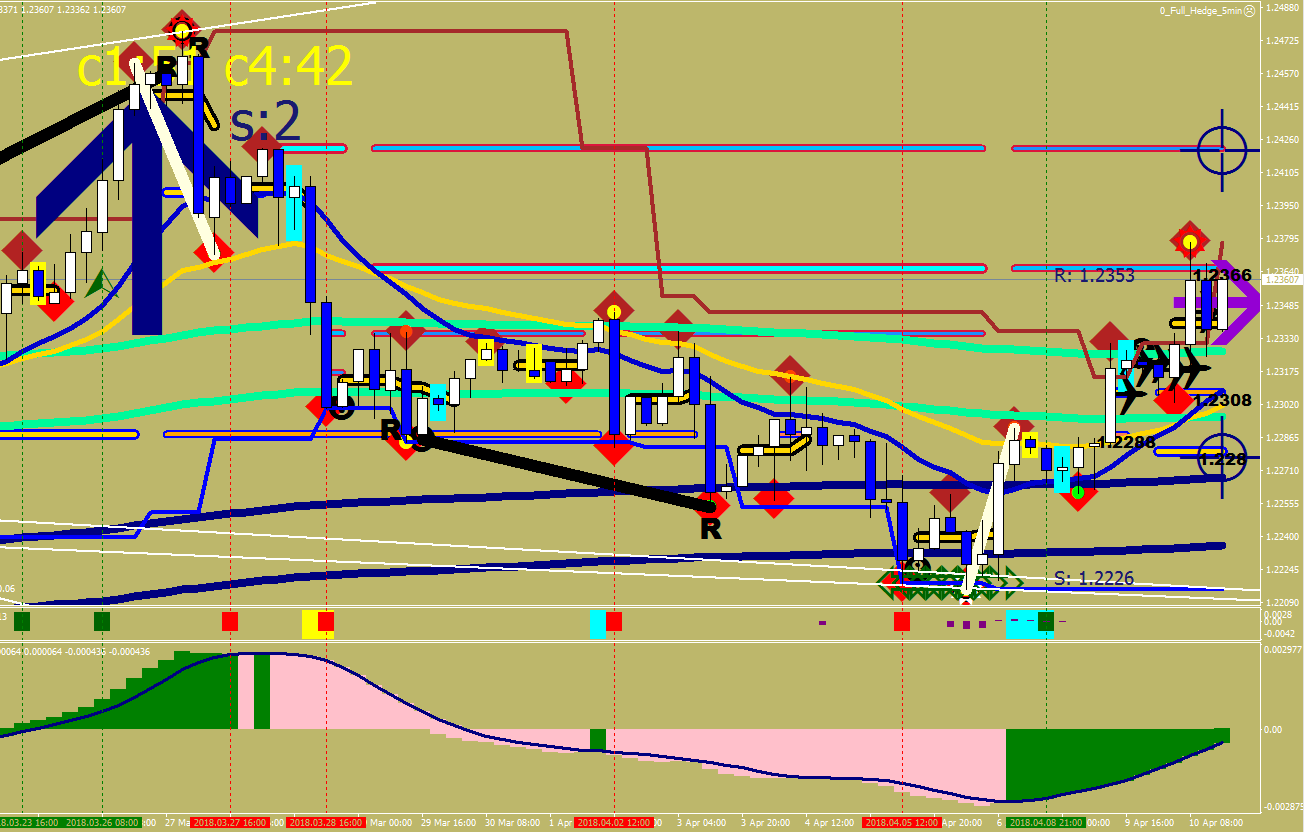
For a fuller picture, here is the position of the 4H LEMA
Other: NZDUSD is in the oversold. As soon as you print a Wave 1 that would start from below the yet lucid Root point, you could bet on a move back up to the green river / middle of the scale @ .73.

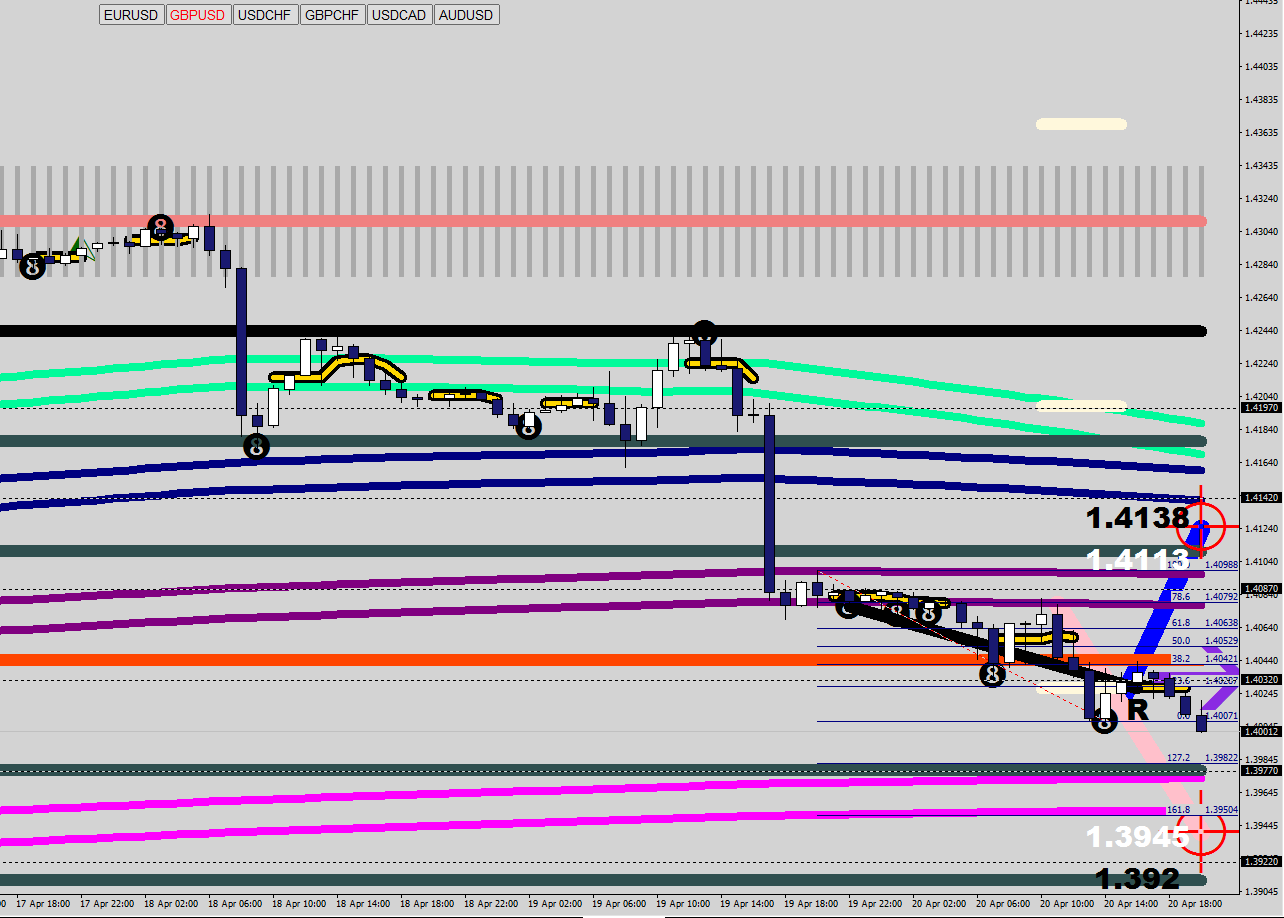
GBPUSD furher down to 1.3950
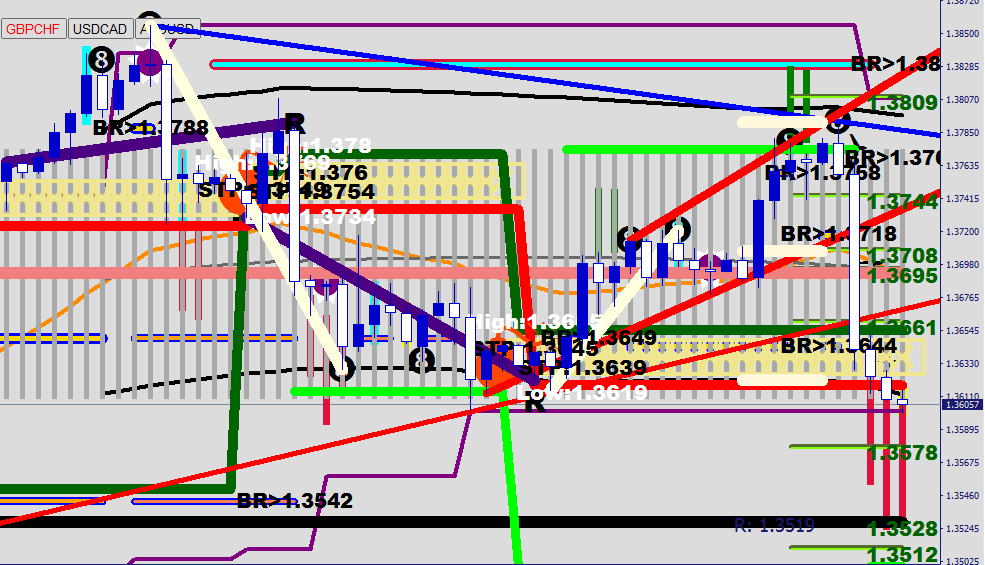
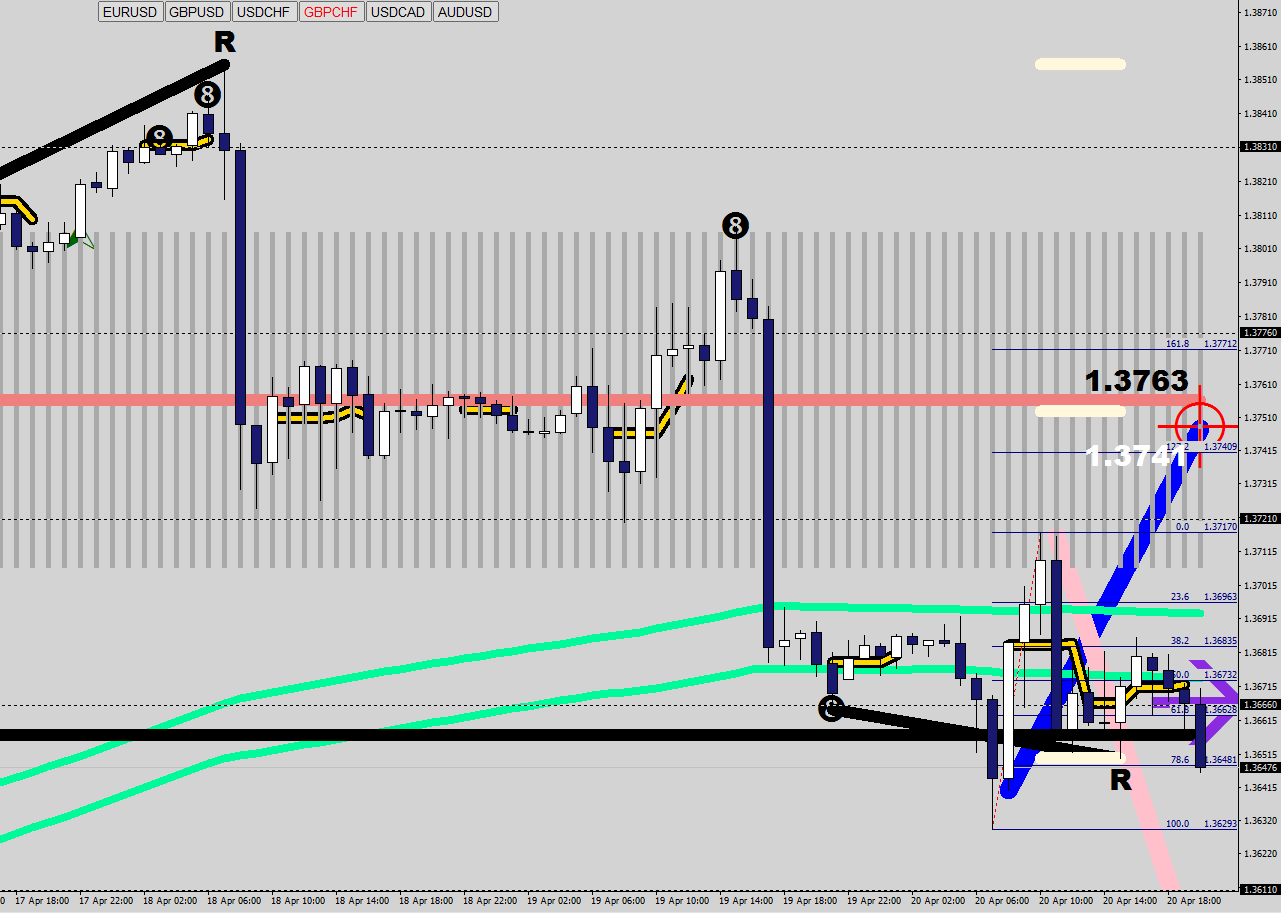
GBPCHF seems to be re-testing the root, possibly making a bottom at the overbought neckline. If price opens higher, minimum target is the 1.3740-1.3760 area.
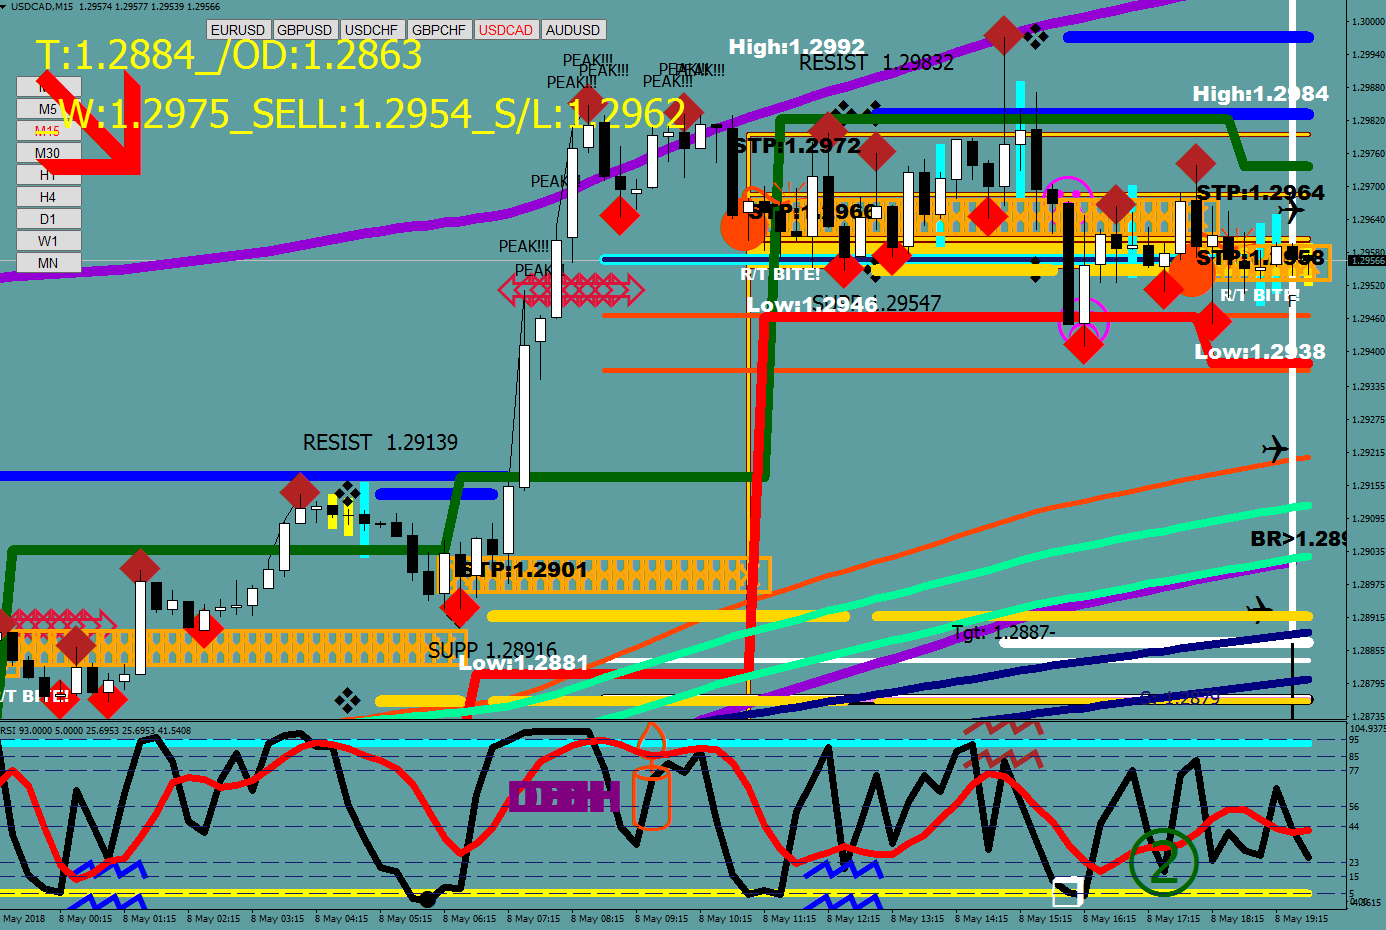
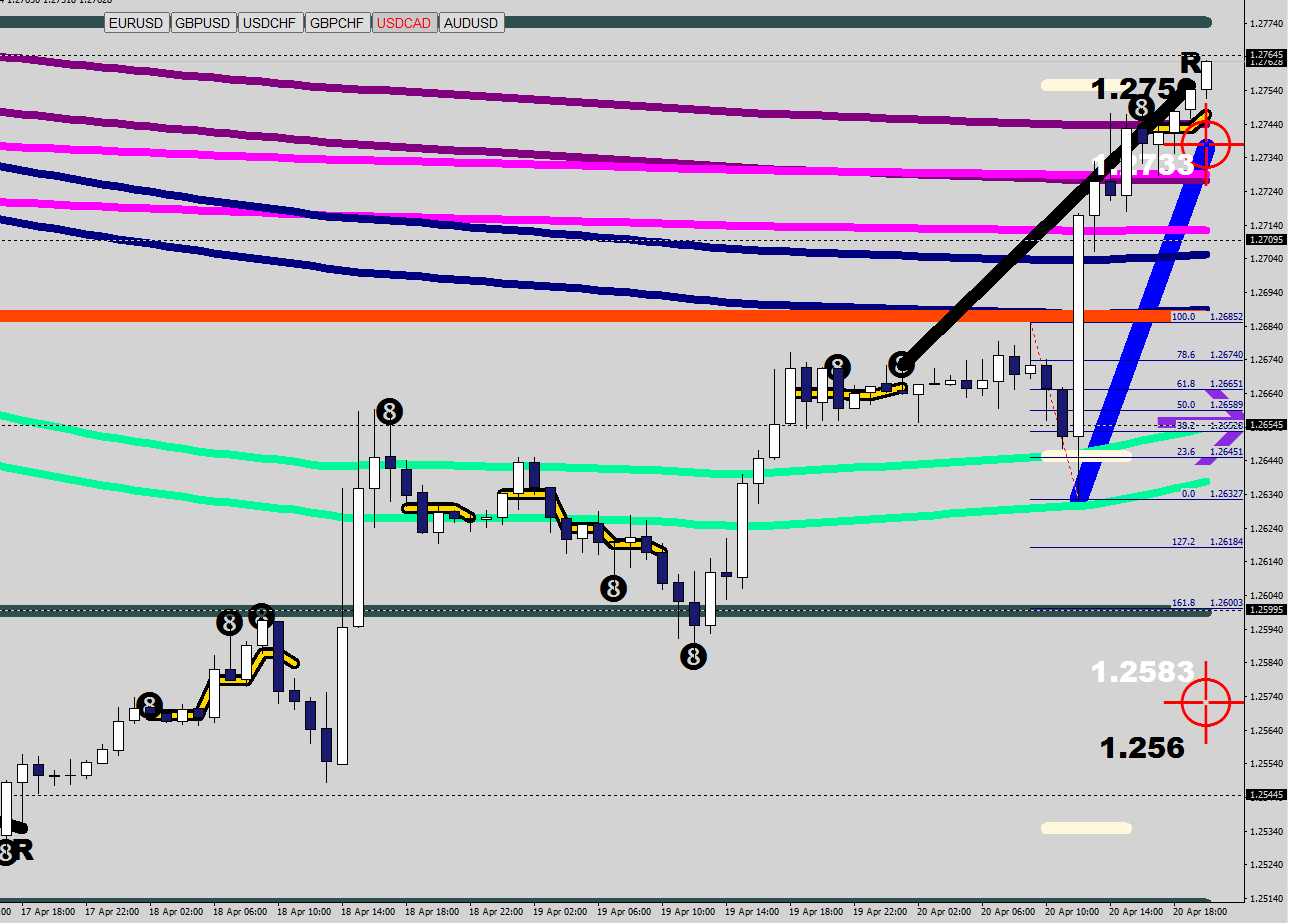
USDCAD: stretched – at an extension already, the wind tunnels are lined up the wrong way, if price comes back through 1.2726, a re-test of 1.2674 would become likely.
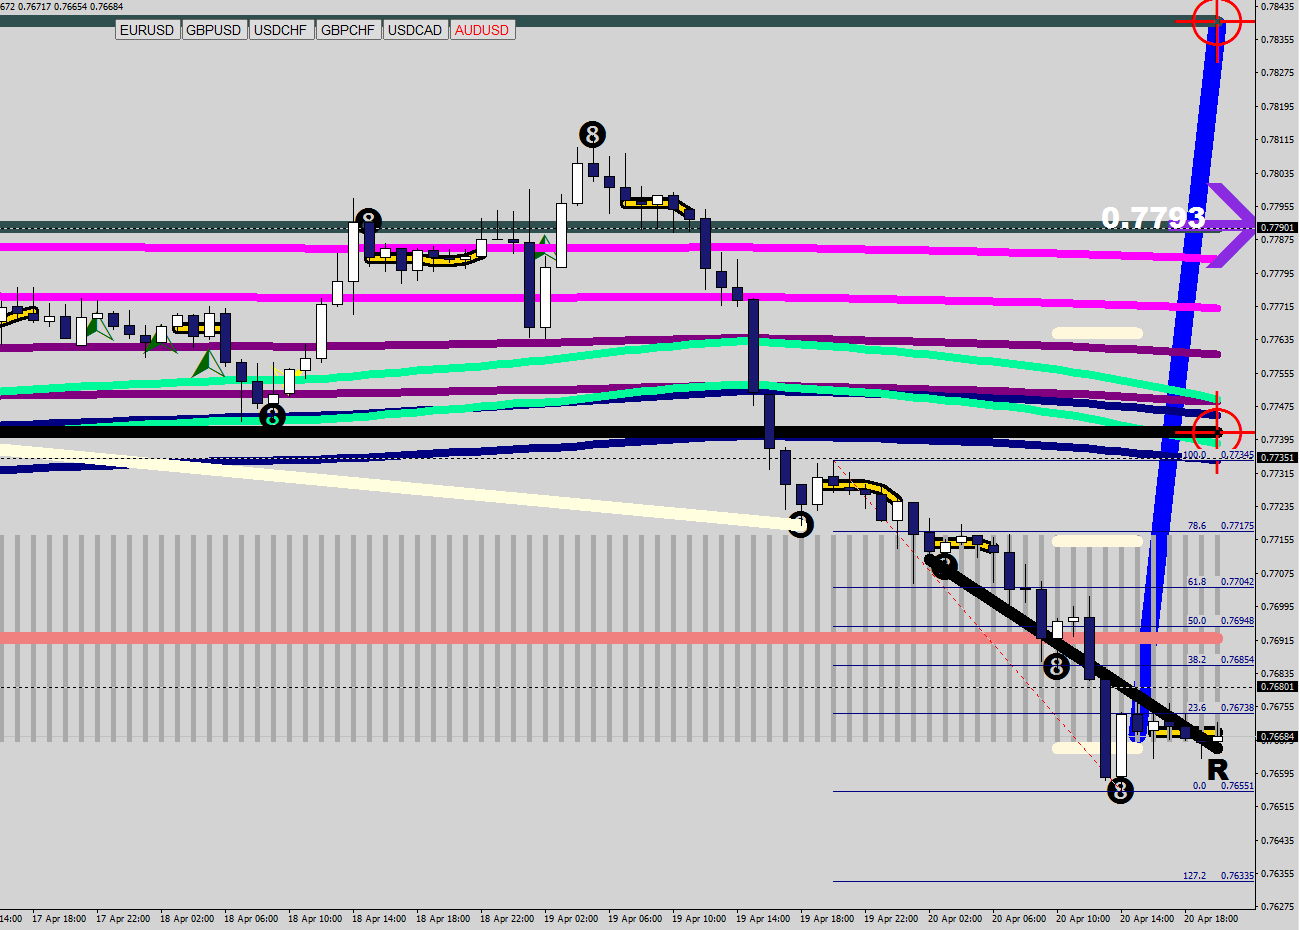
AUDUSD: a market that has trending potential, it is at the bottom of the lower reversal zone (5%), and this can start making lower lows indefinitely.
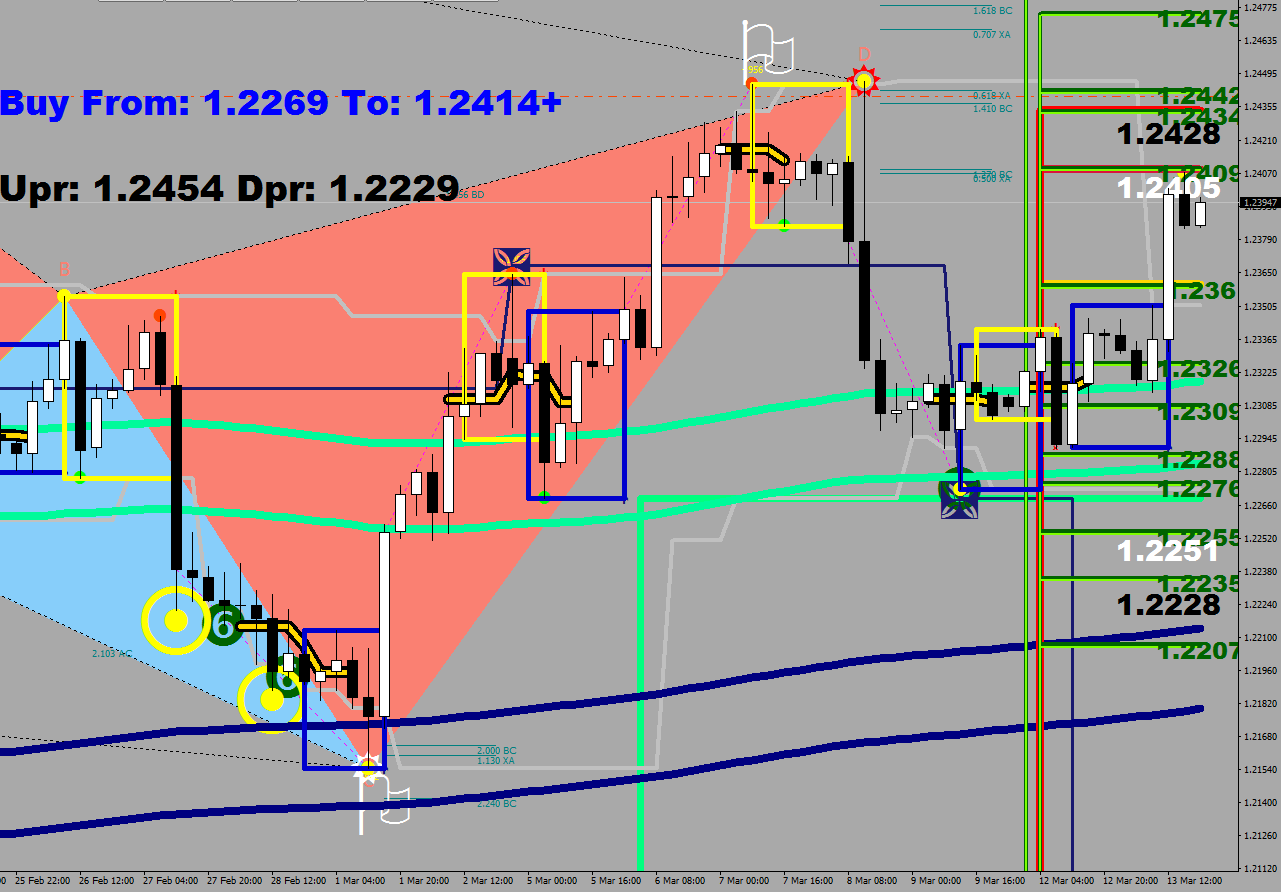
Current move up to the root does not qualify for a Wave 1.

A wave 1 comes from beyond a root point.
See how the wind (MACD) remained down all the way during the move back up.
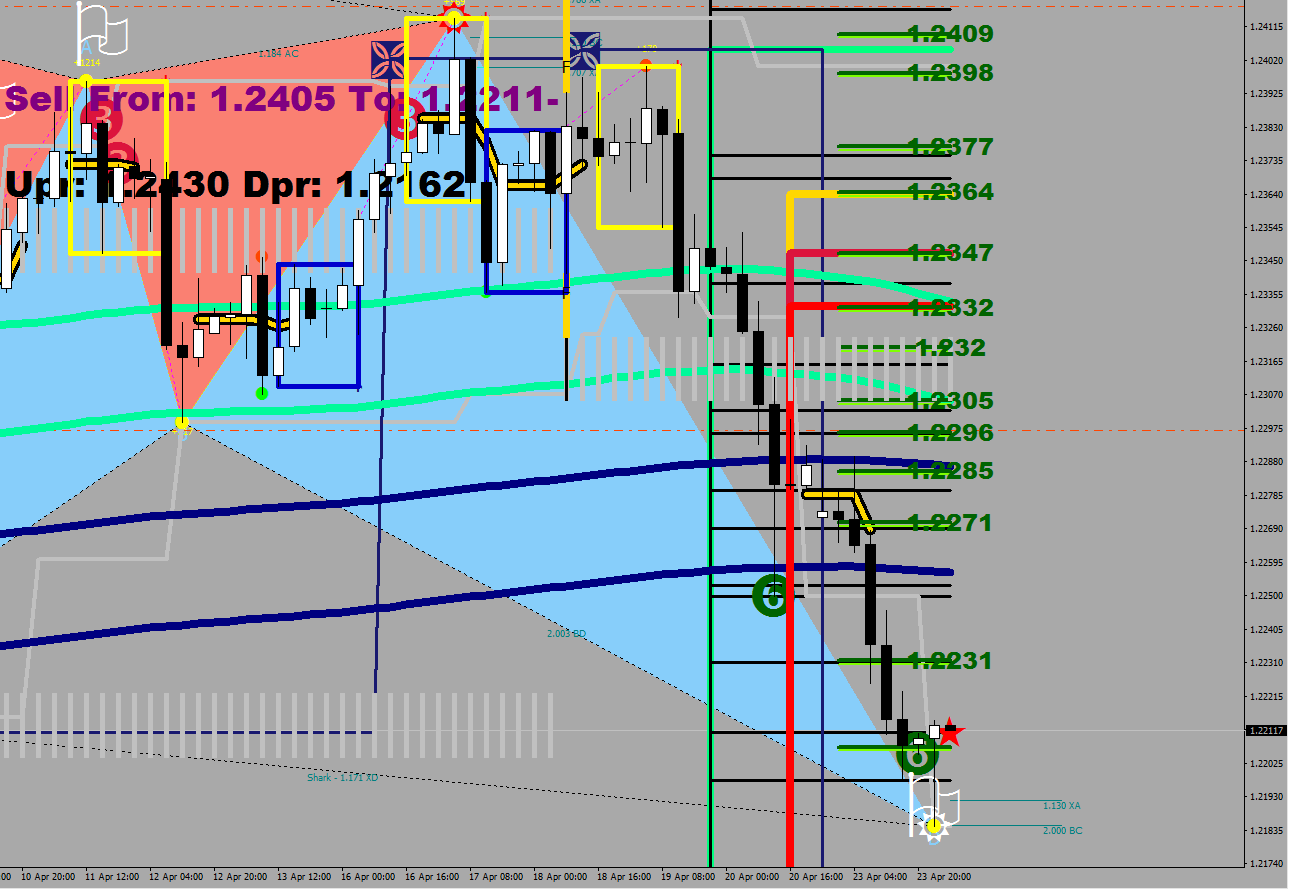
The 3 thick horizontal lines are the two root lines + the halfway mark between them.
The bounce back into the end of Wave 1 (Wave 4) coincided with the pro volume candle’s low (green line)
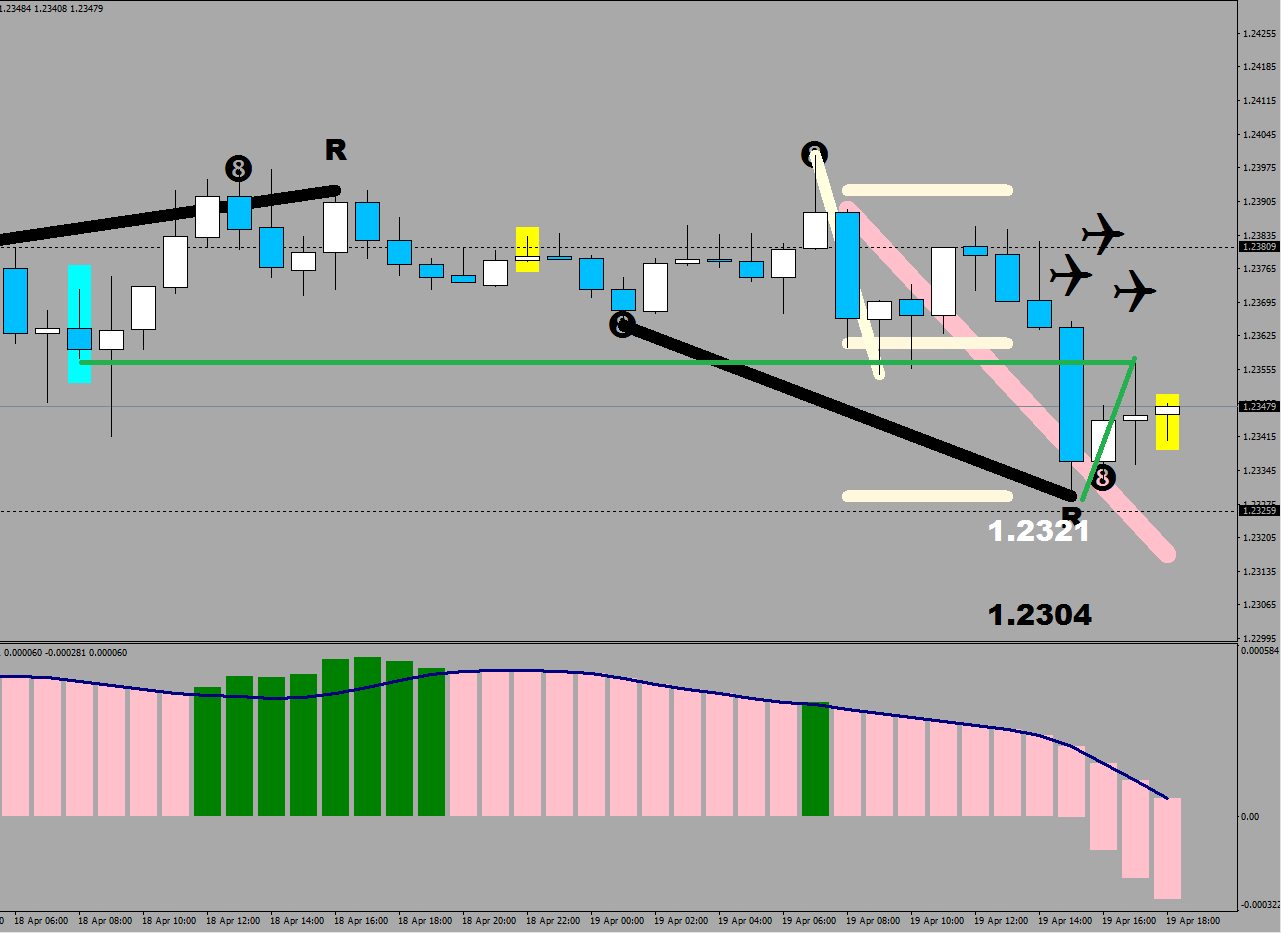
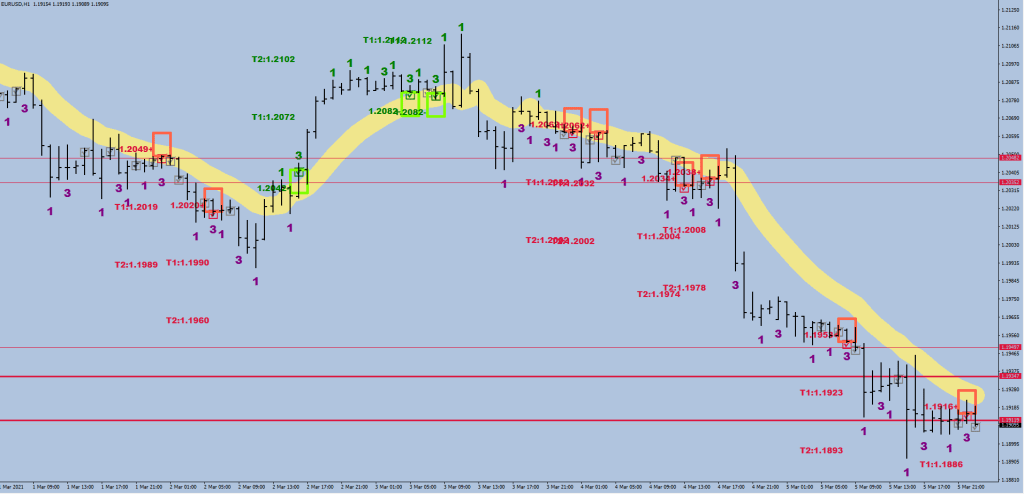
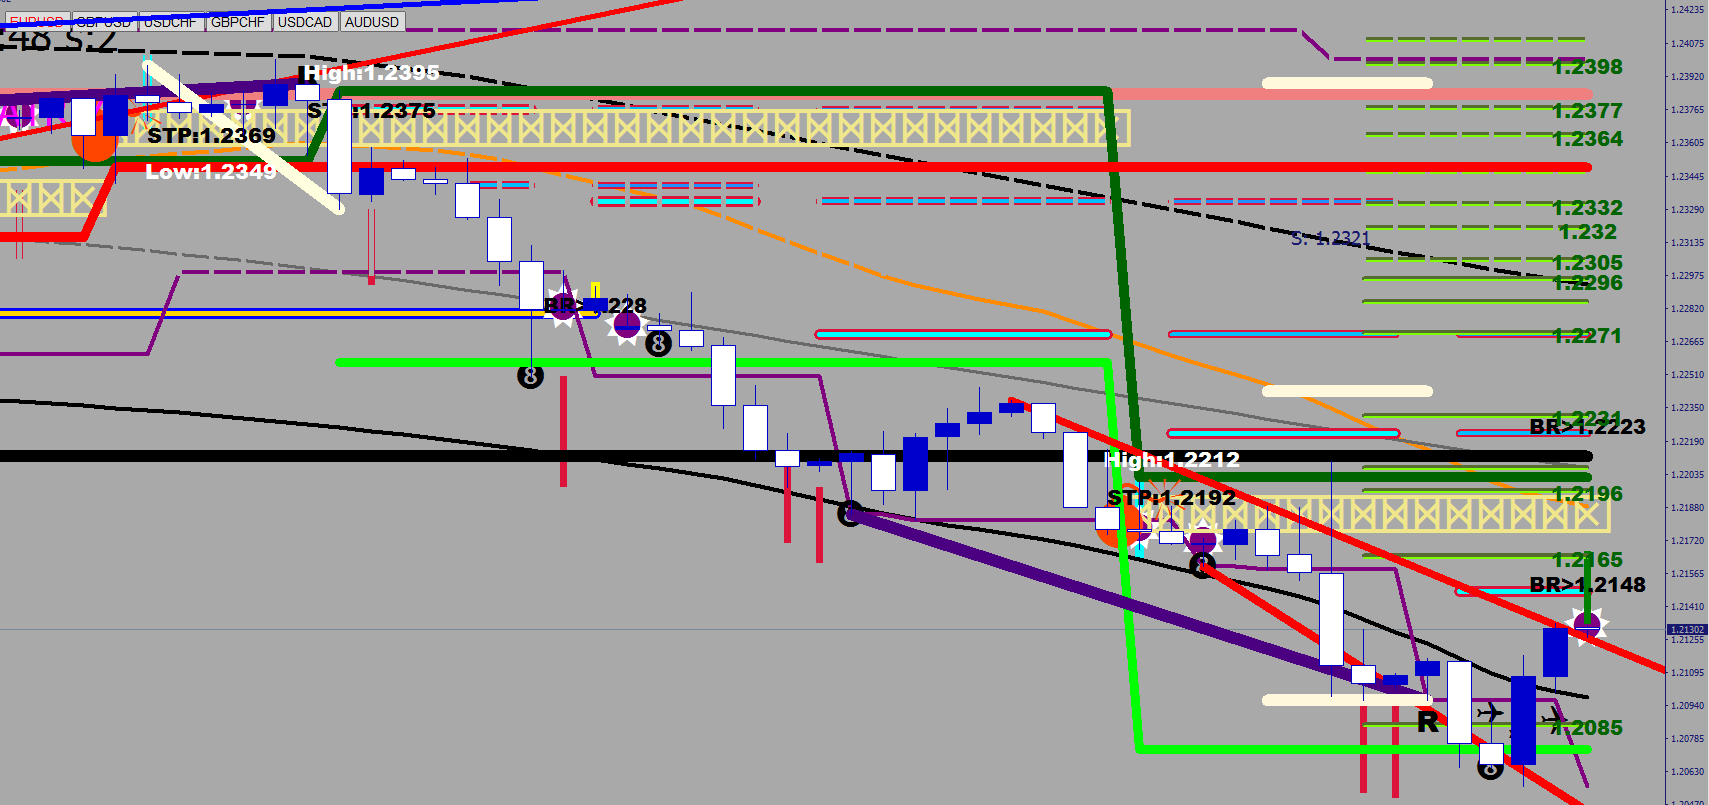
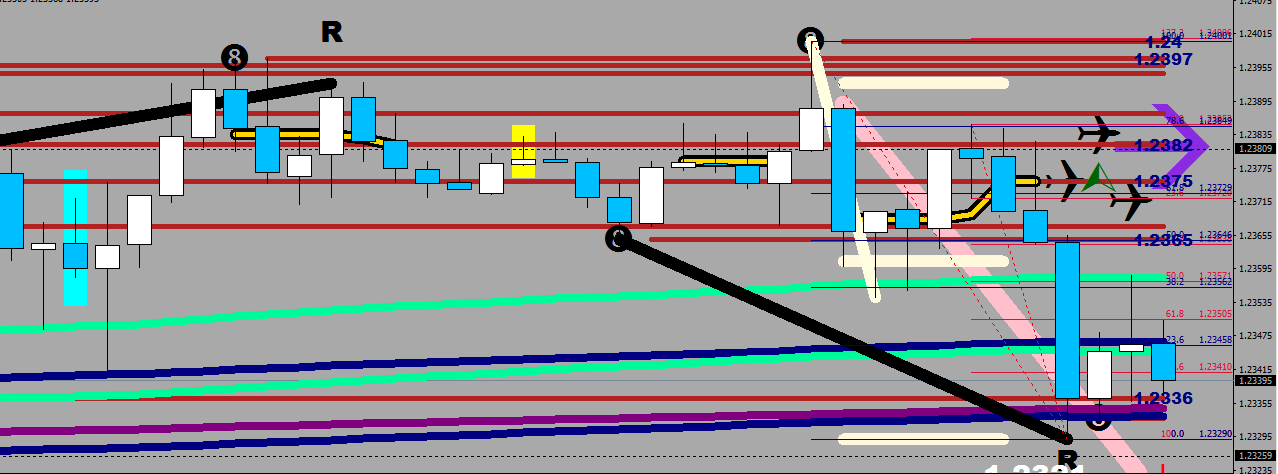
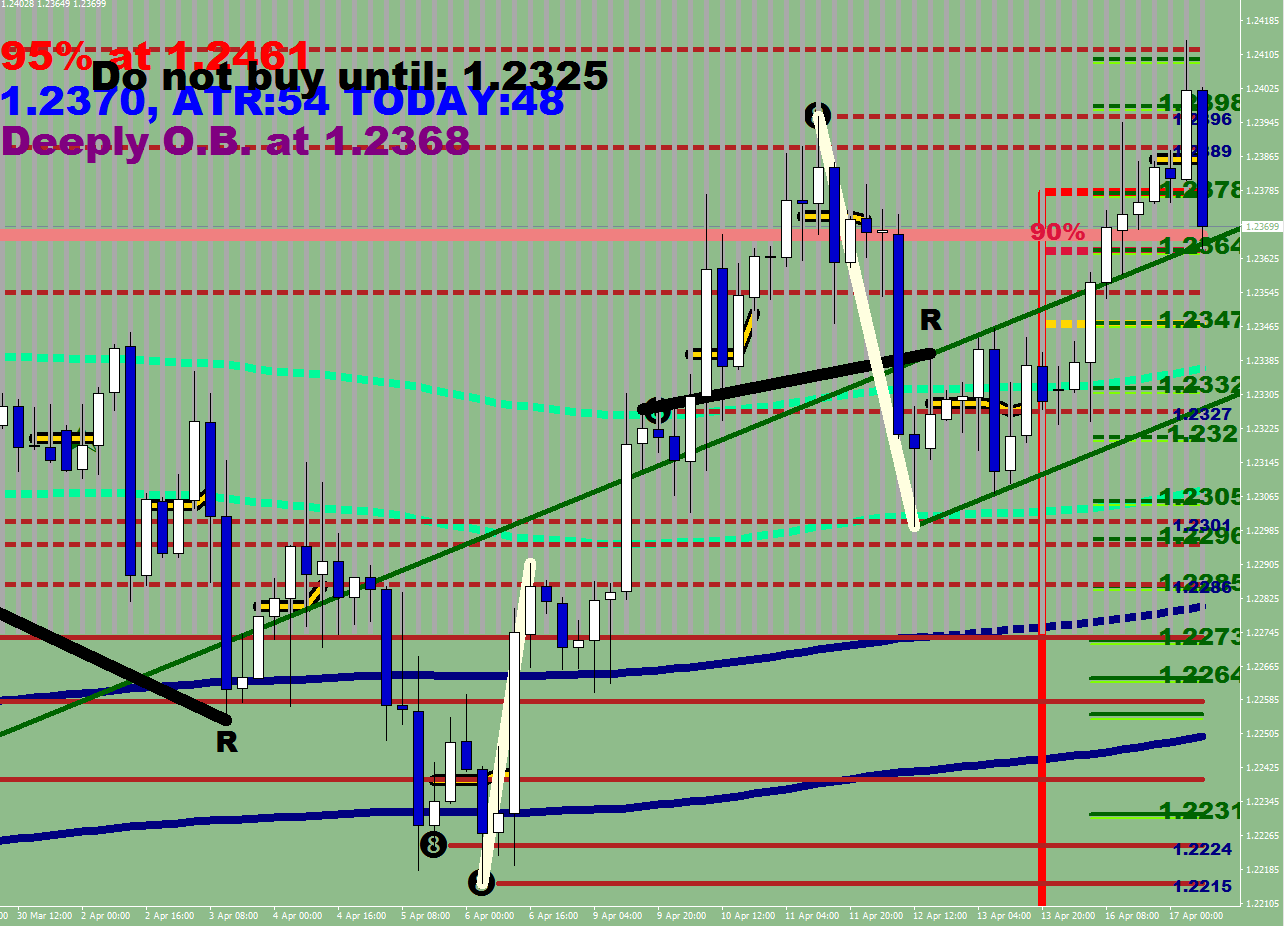
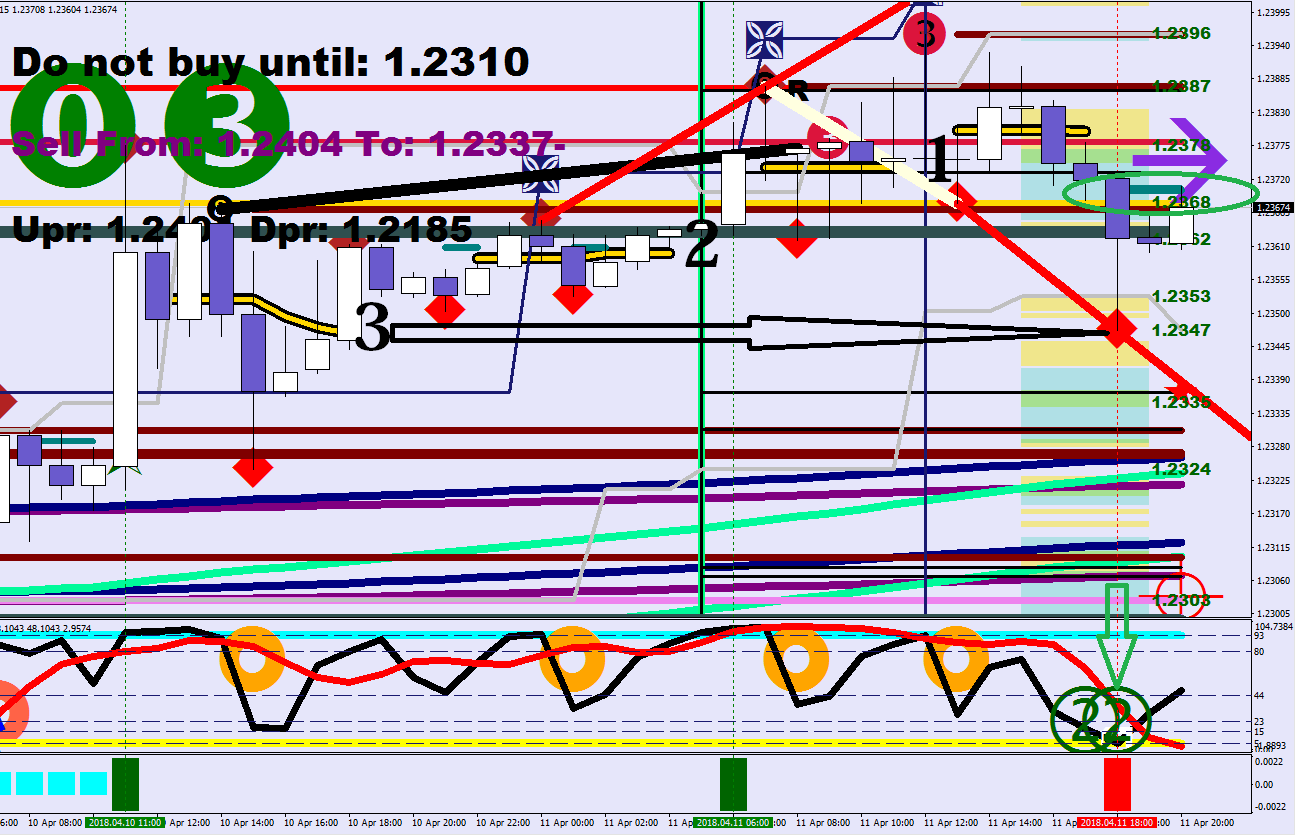
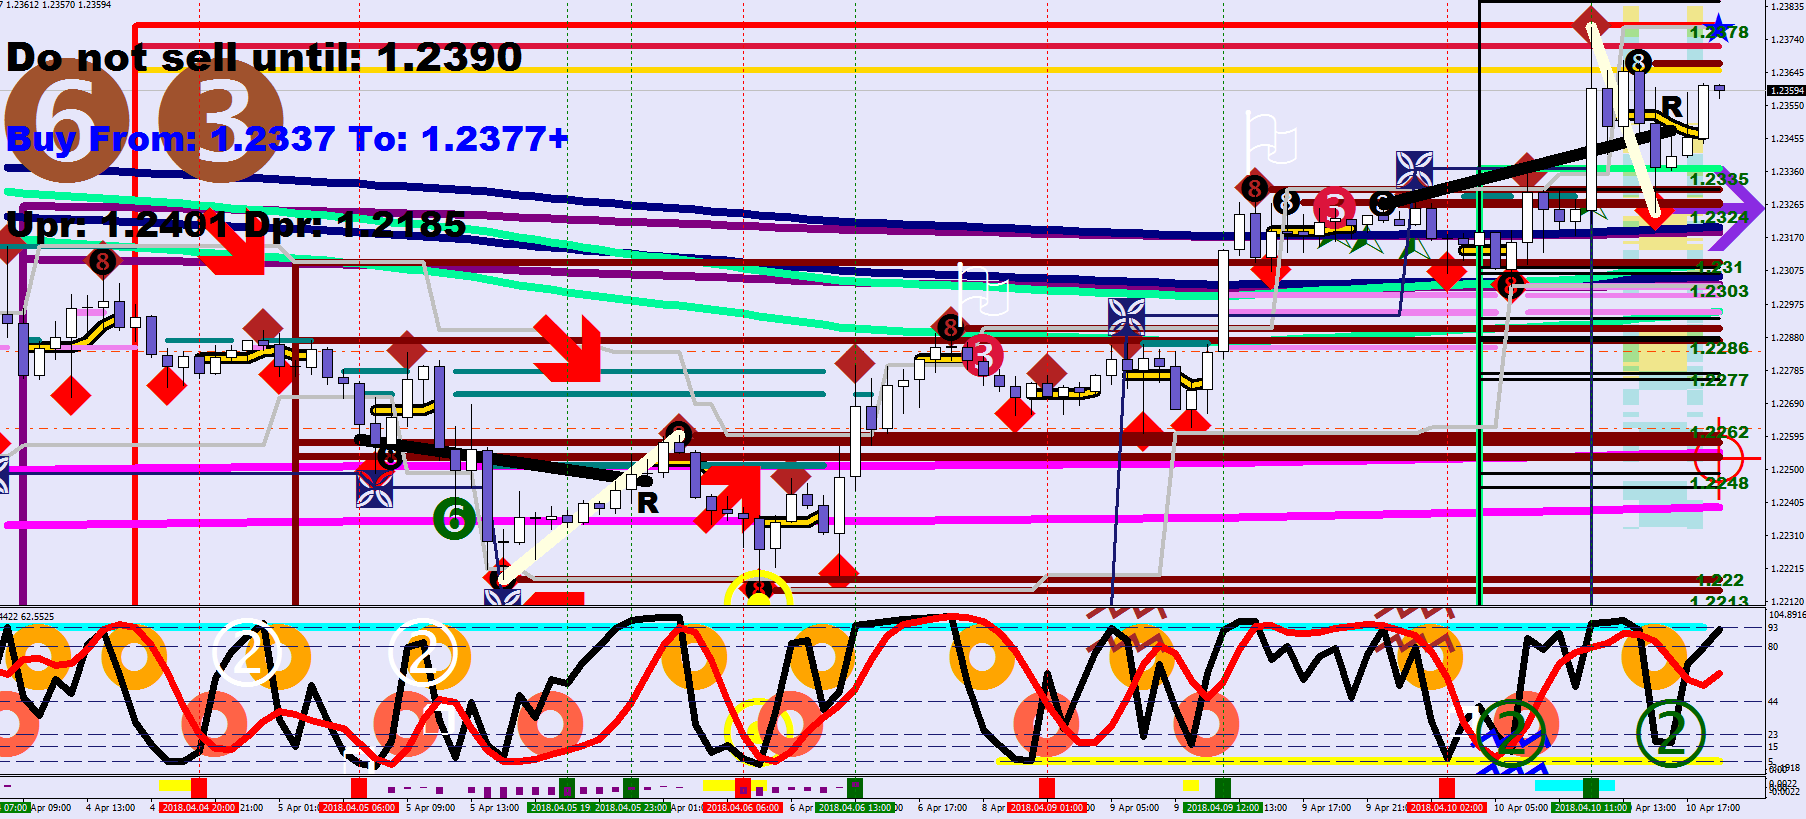
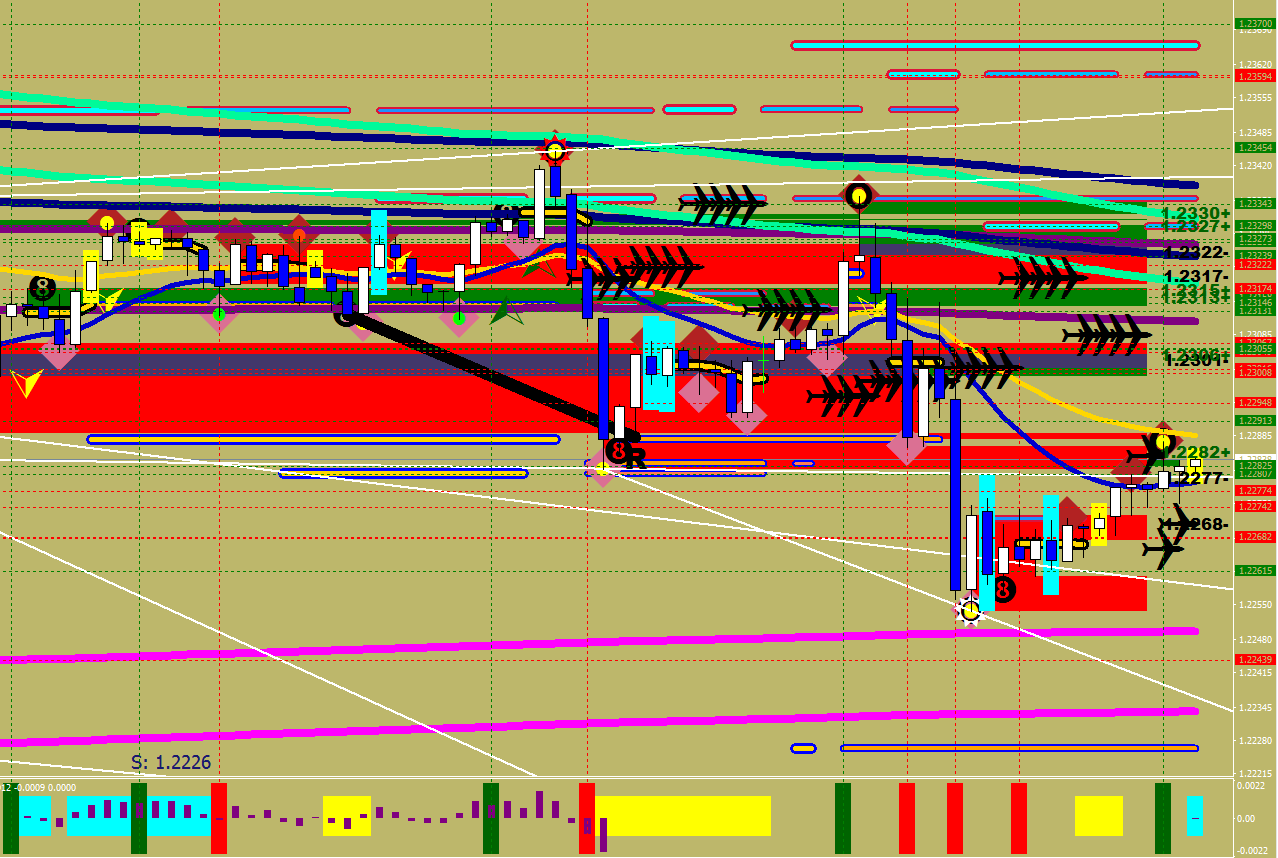
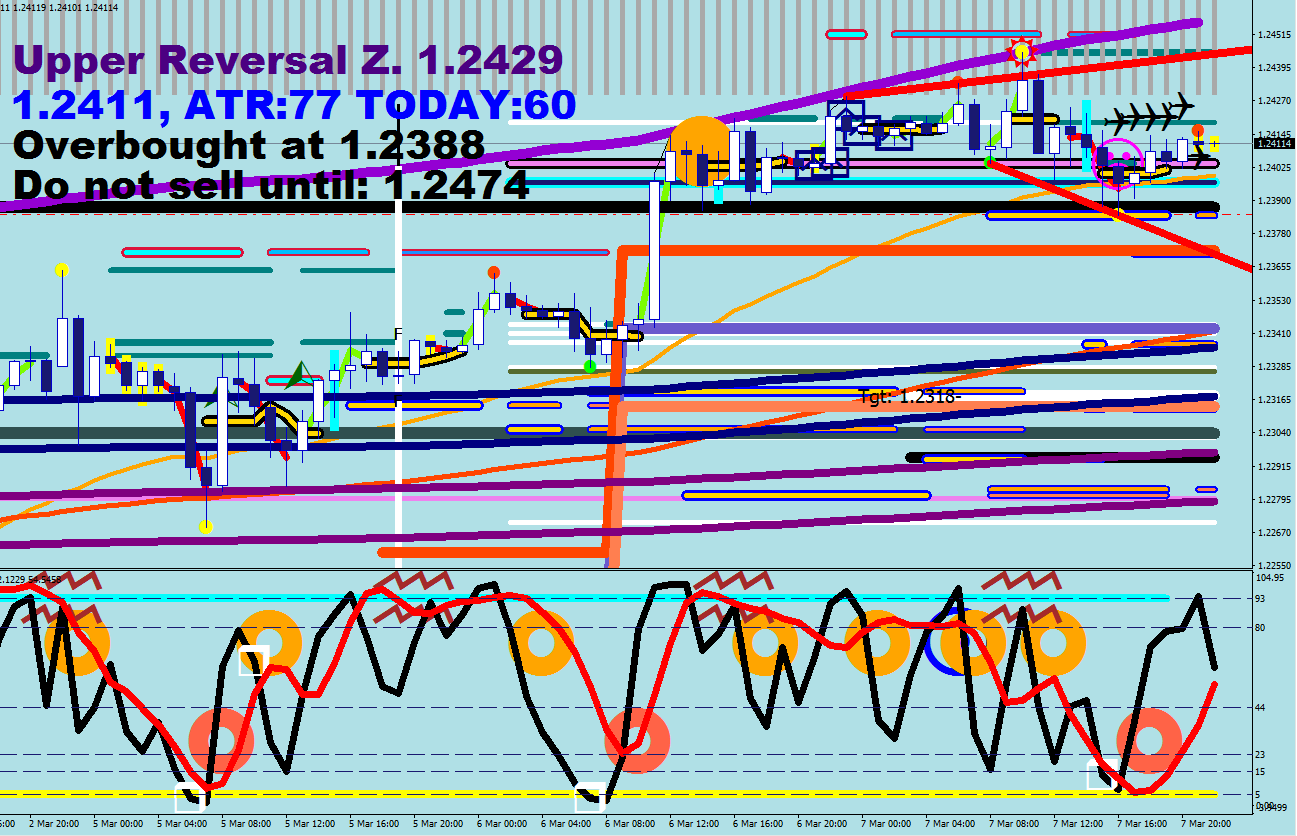
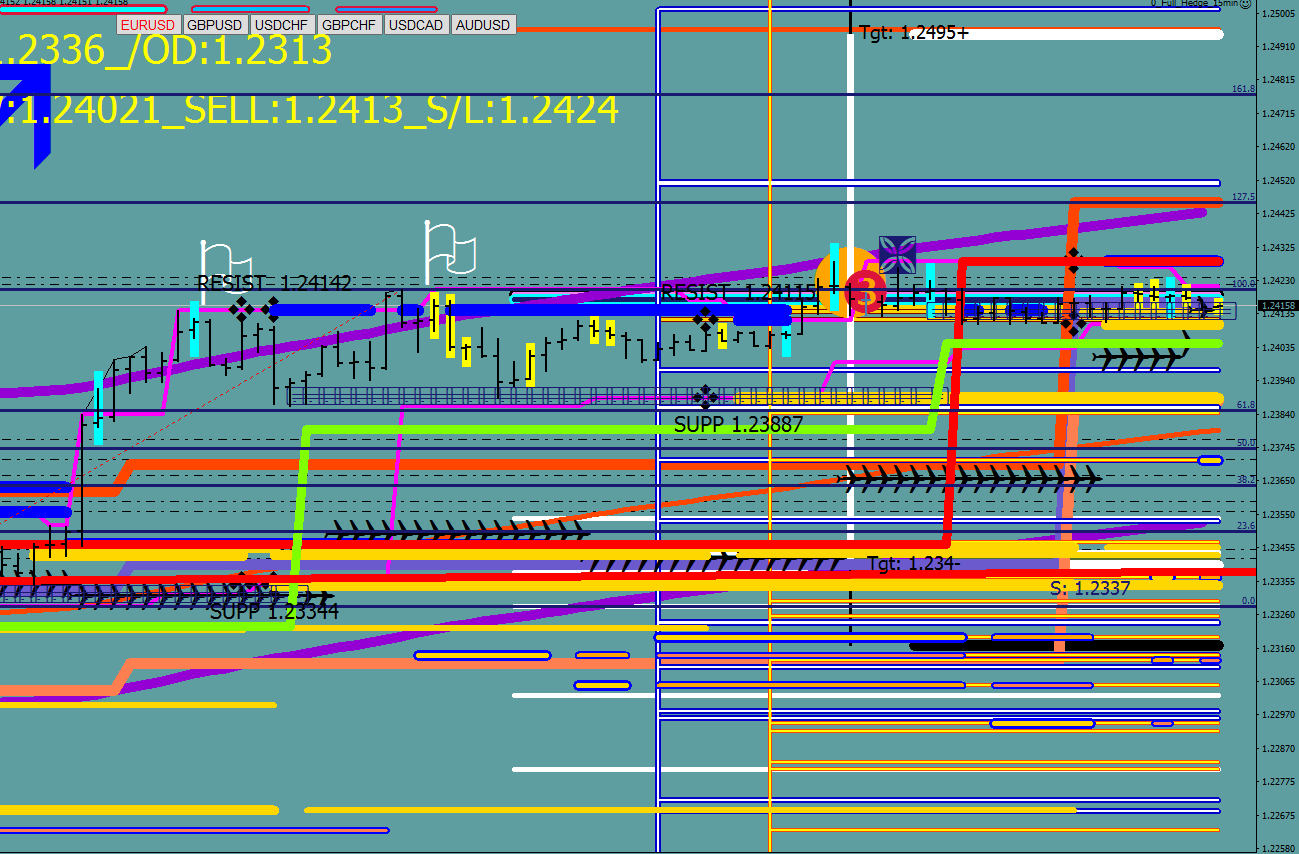
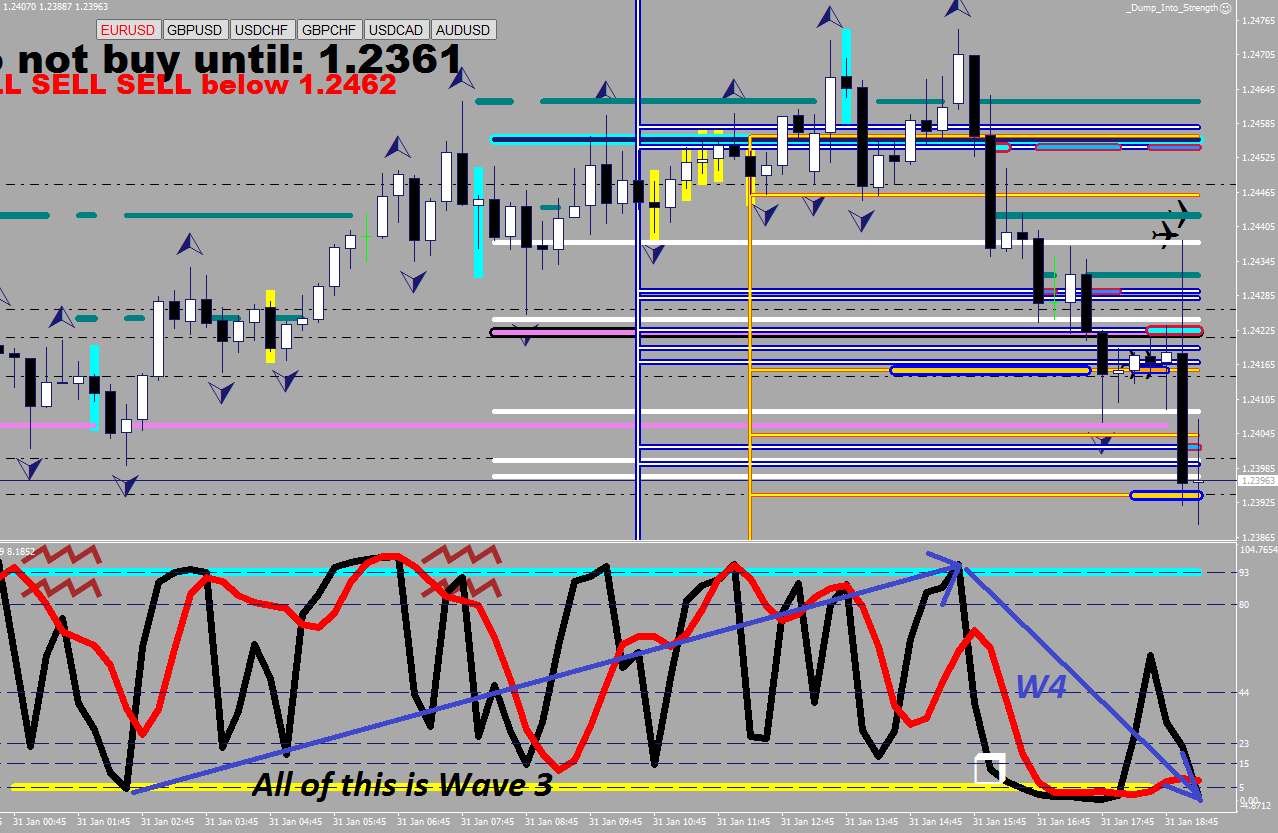
After plotting the qualifying moves (thick red & green) – since the last move is a red down (happens to be the Wave 3), it is clear that you are looking at a retracement only in the up move, that would be the starting point of a wave 5 down – which could either stall out at the 55 pips black dash and storno the whole move or take it down much closer to 1.23097 – which would likely yield a consolidation at some point effectively moving the consolidation weight lower.
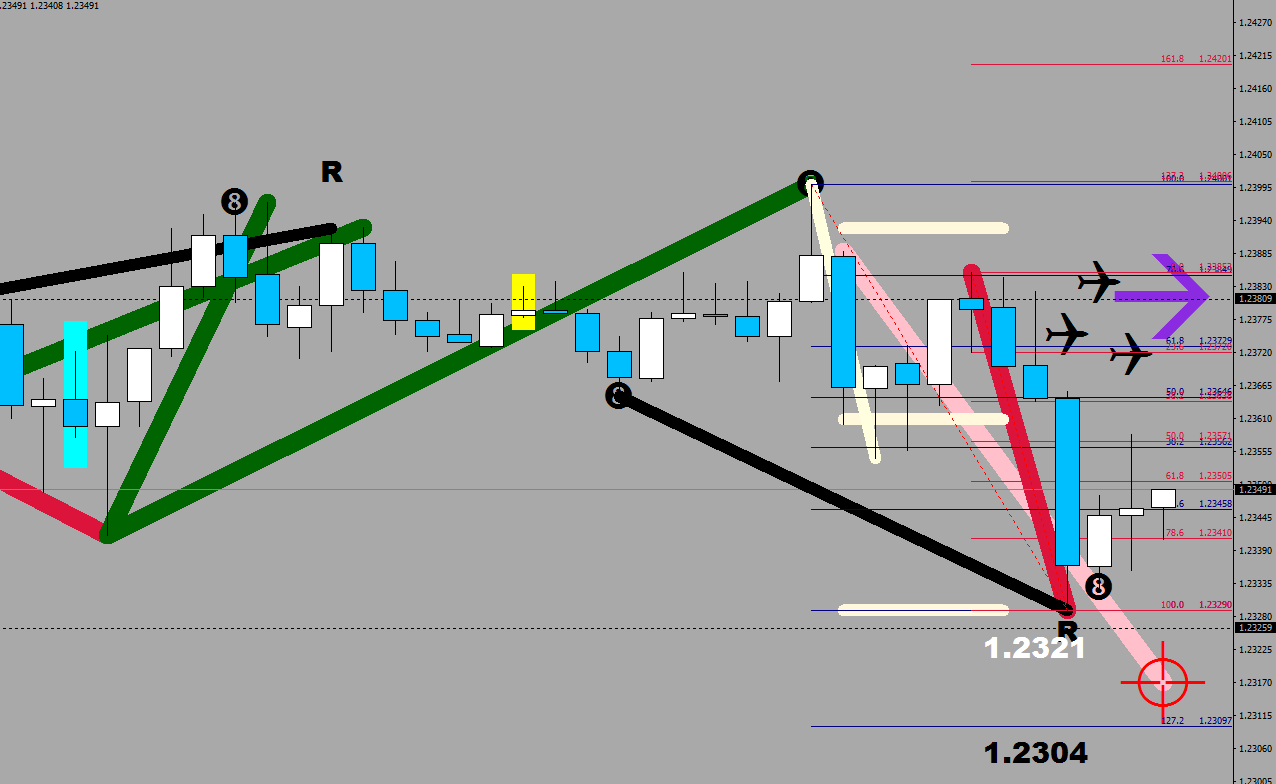
If I also plot the 88 lines, you would see a double pump at the end, that would increase the chance that Wave 5 would be a short one: if they decide to buy the inner brown, at 1.2336 and put a stop beyond the lower brown, the move would be cut short.
Also take note of the white spinning top. As soon as its bottom is crossed back up from below, the bear time would be over with.
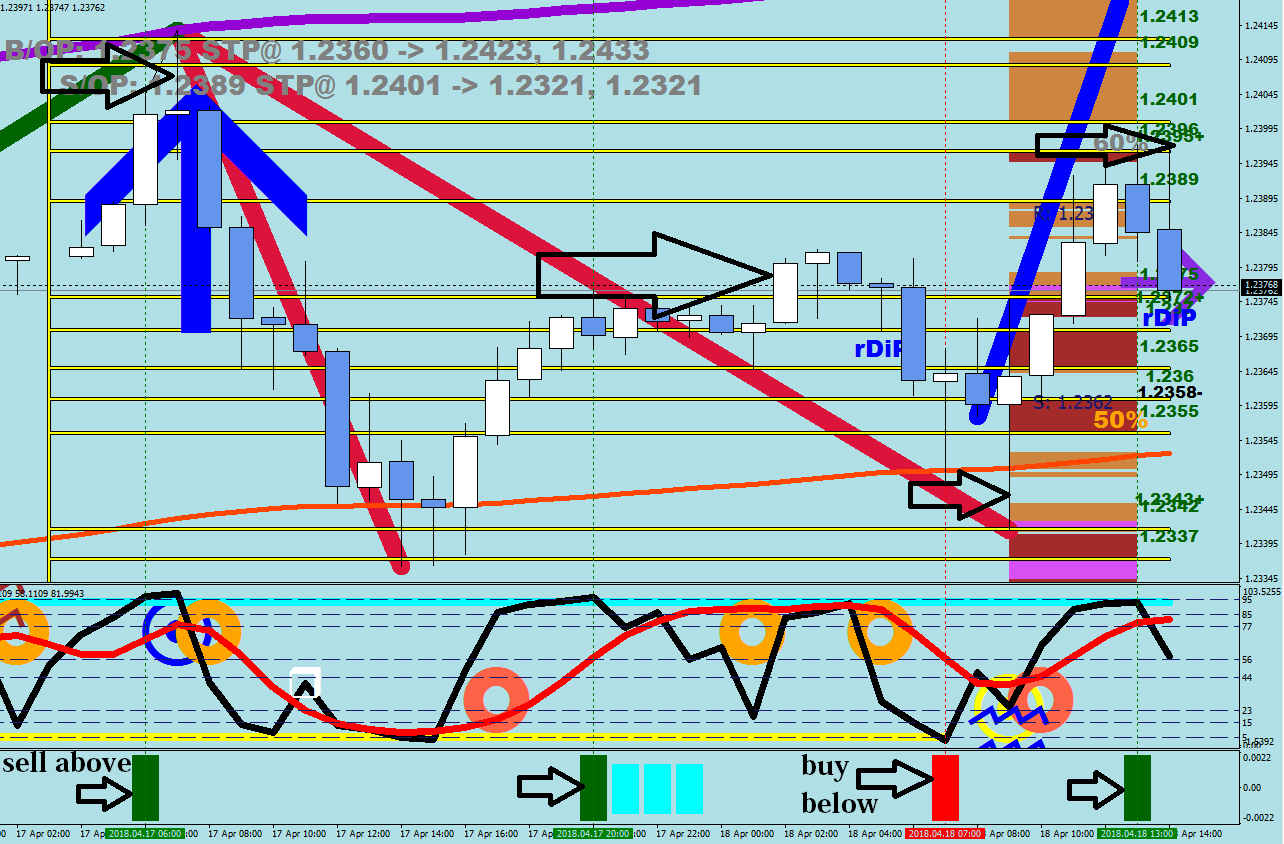
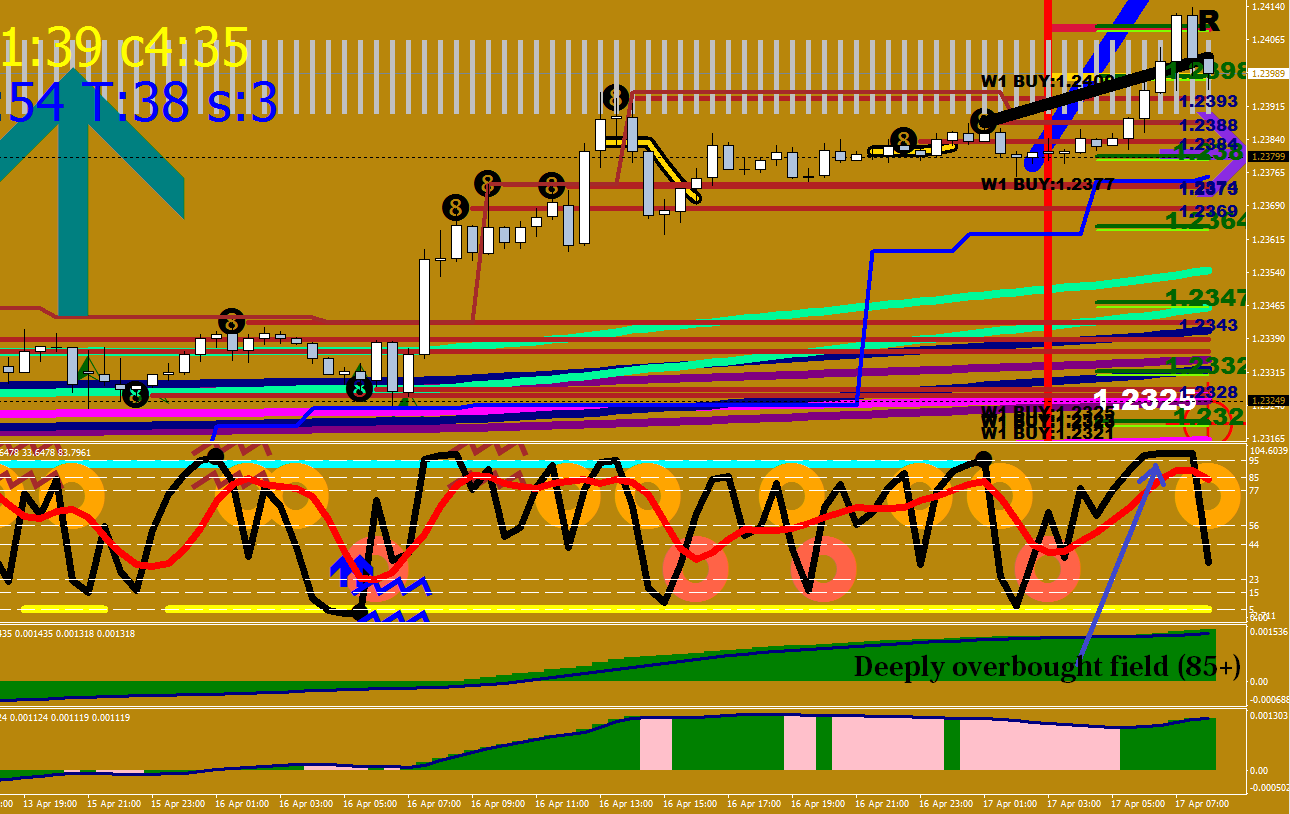
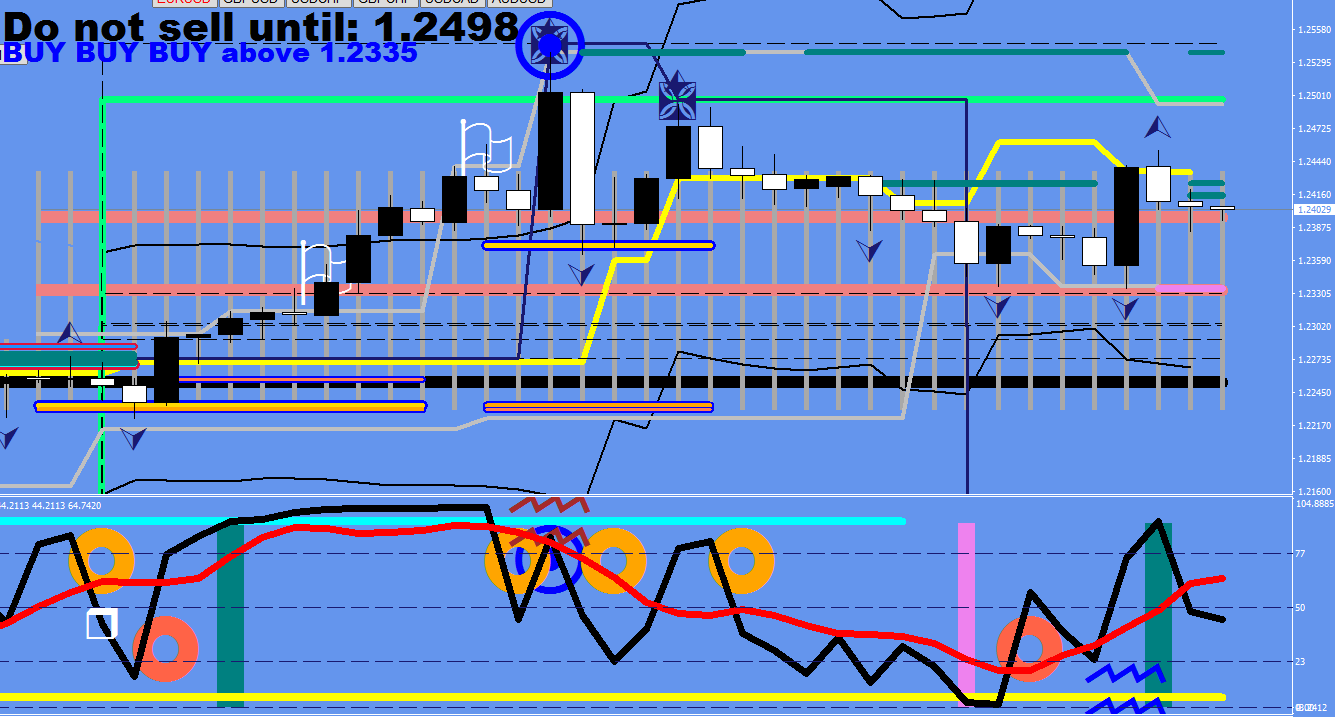
In terms of deflectors, price is currently tucked below the green river monster (15-min LEMA), and is having a second go at the 30-min LEMA and the 1H LEMA is right here as well. On regular days, the price tends to play ping pong between the green river and the 2H LEMA – starting at 1.22763.
We seem to be witnessing a letter “h”, a formation that price cannot get out of lower for a while. (It came back down for a re-test after a significant bounce (>23%) too quickly.)
Check how the Root point has just migrated higher.

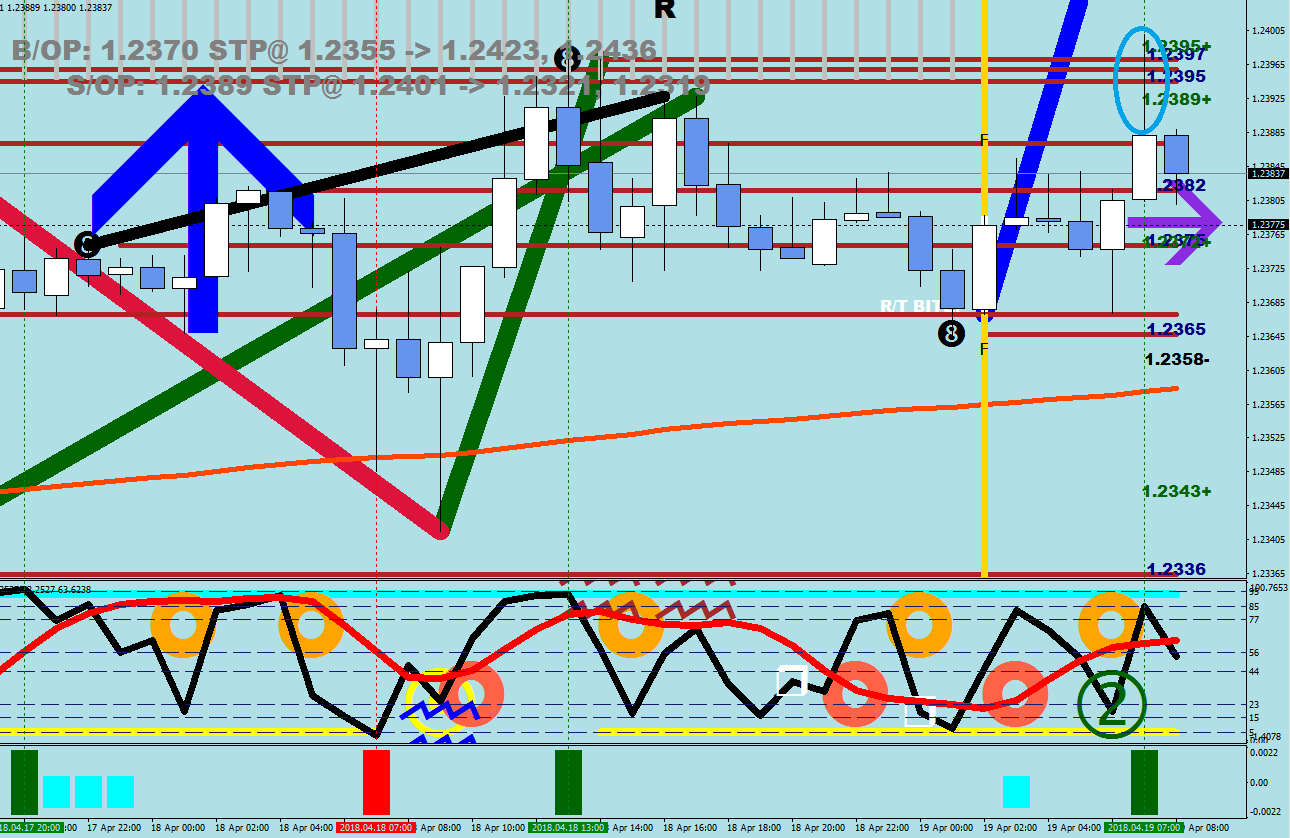
They have cleared away the stops. Greased the tracks. I call this a slider-wick at times.
You can also see the spot they bought the inner 8-line with a stop just beyond the outer 8-line risking 10 pips or so on the trade. Go, 88 Luftballons!
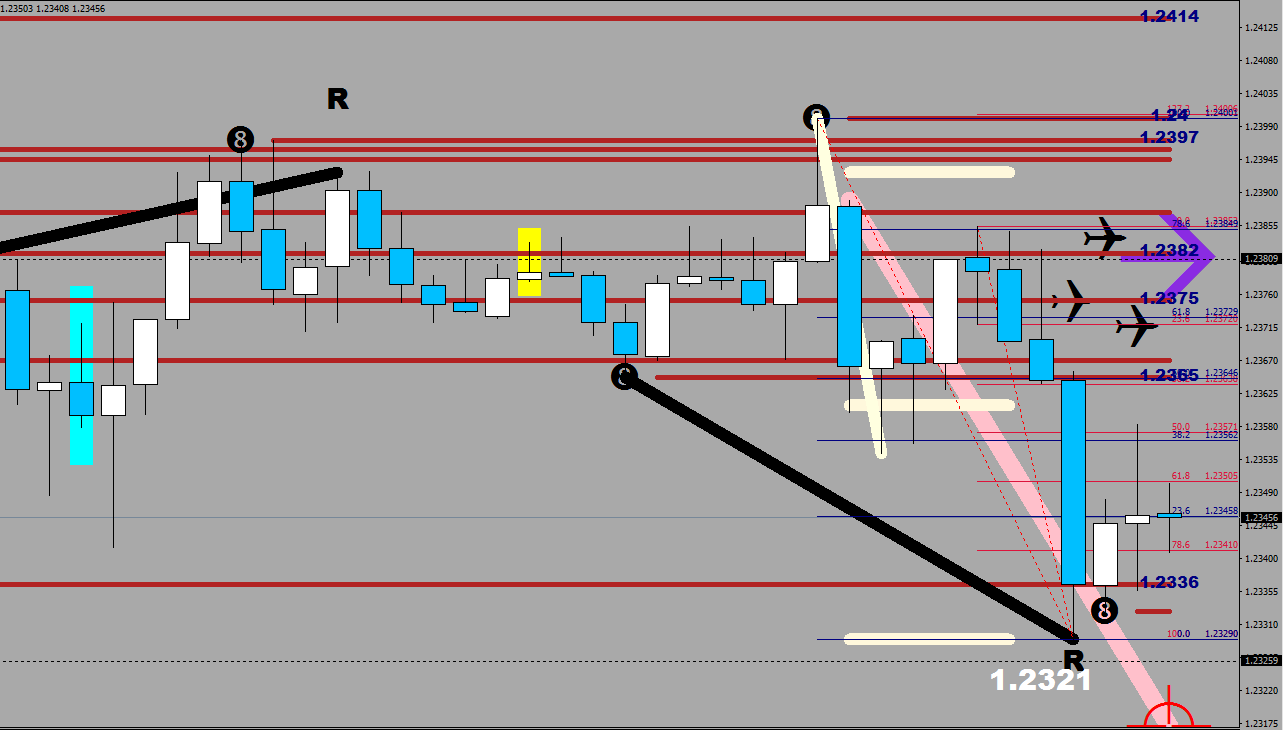
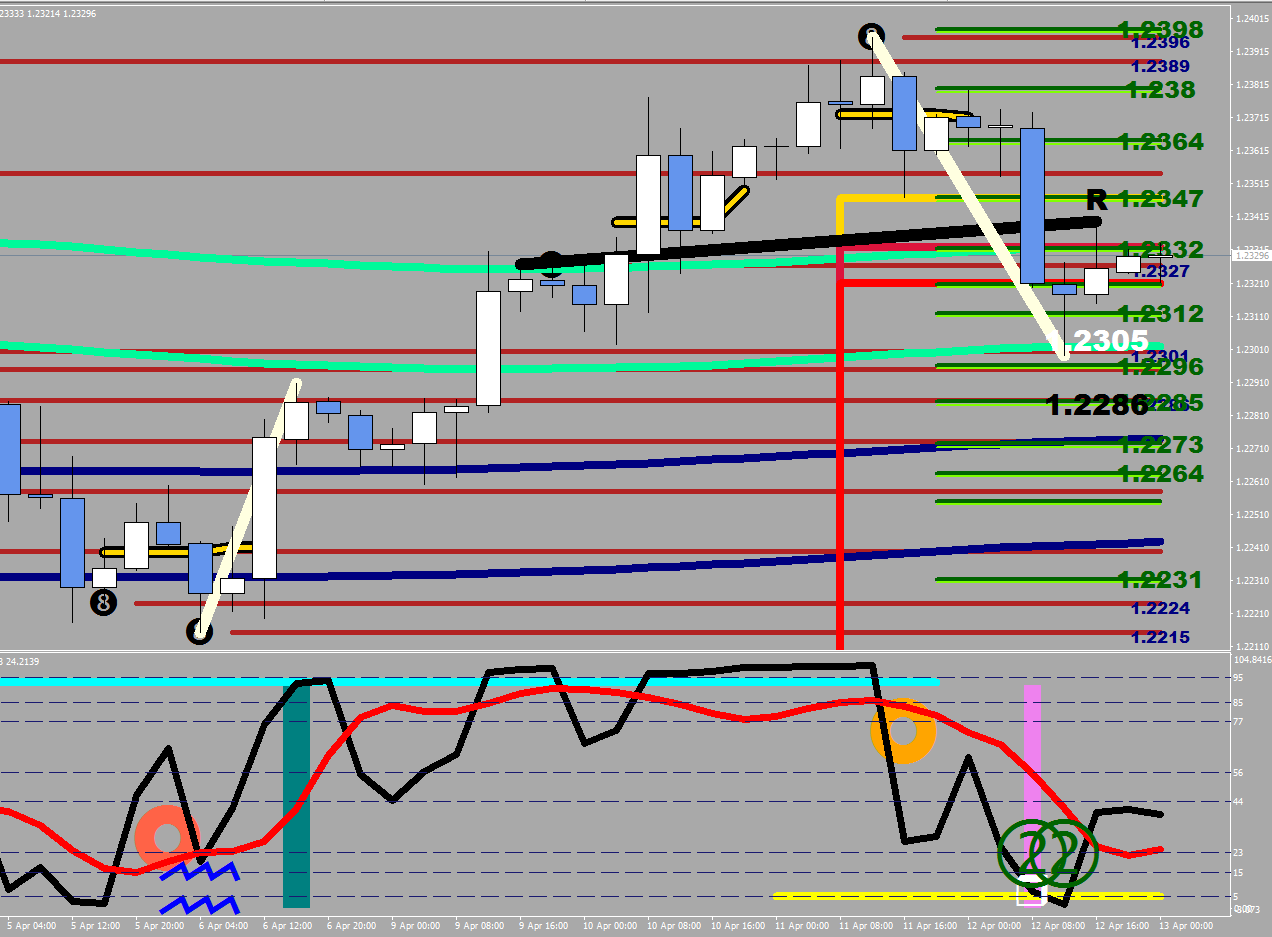
piano keys: sell break of 1.2336
Weekly resistance: 1.2396
Weekly support: 1.2260
ATR upside limit: 1.2432-1.2452
ATR downside limit: 1.2319-1.2303
Weight: 1.23768
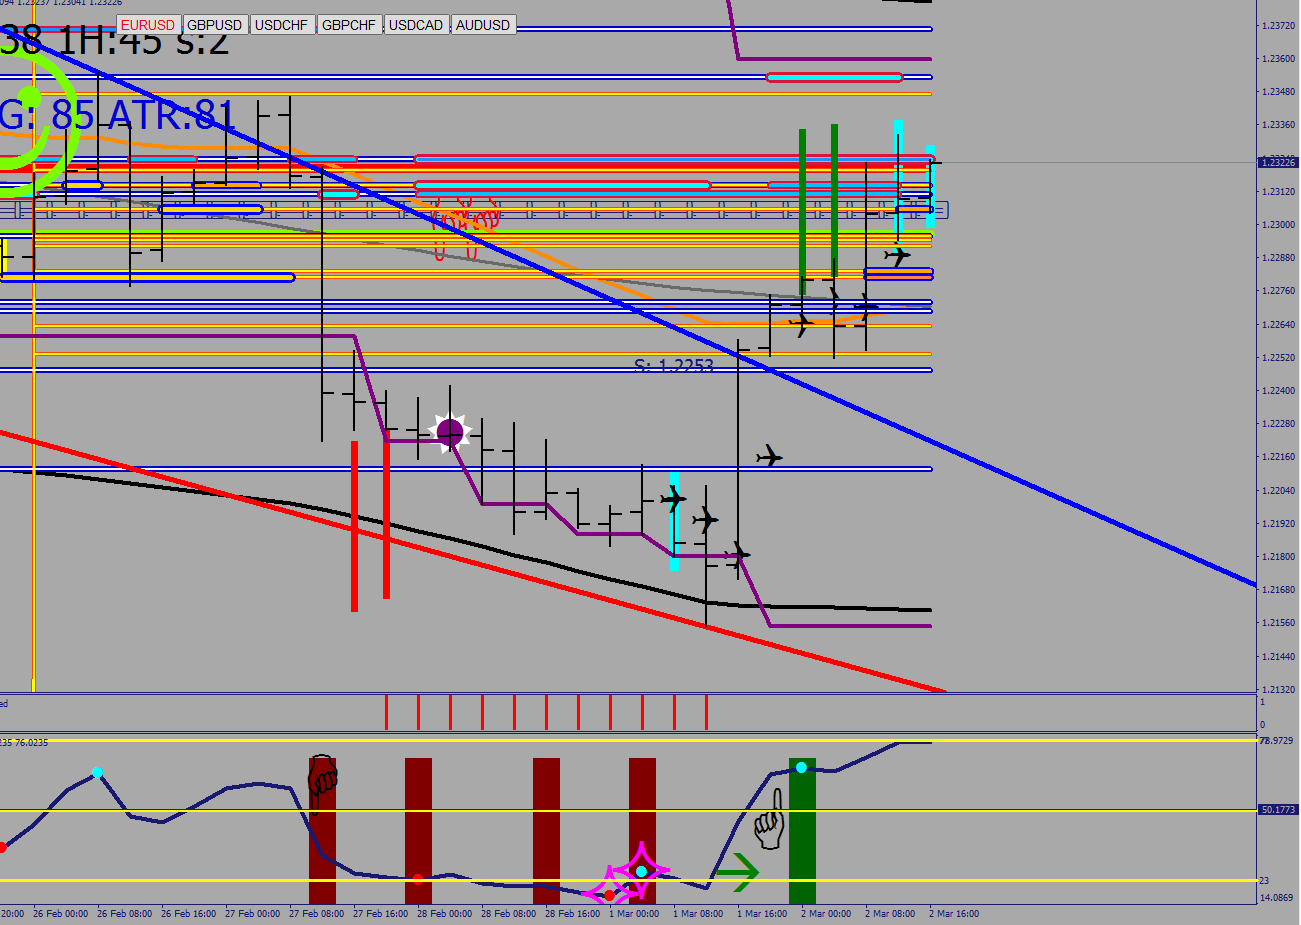
4H projected distance (upside): 1.2430
4H projected distance (downside): 1.2297, 1.2307
4H overbought neckline: 1.2180
4H deeply overbought: 1.2368
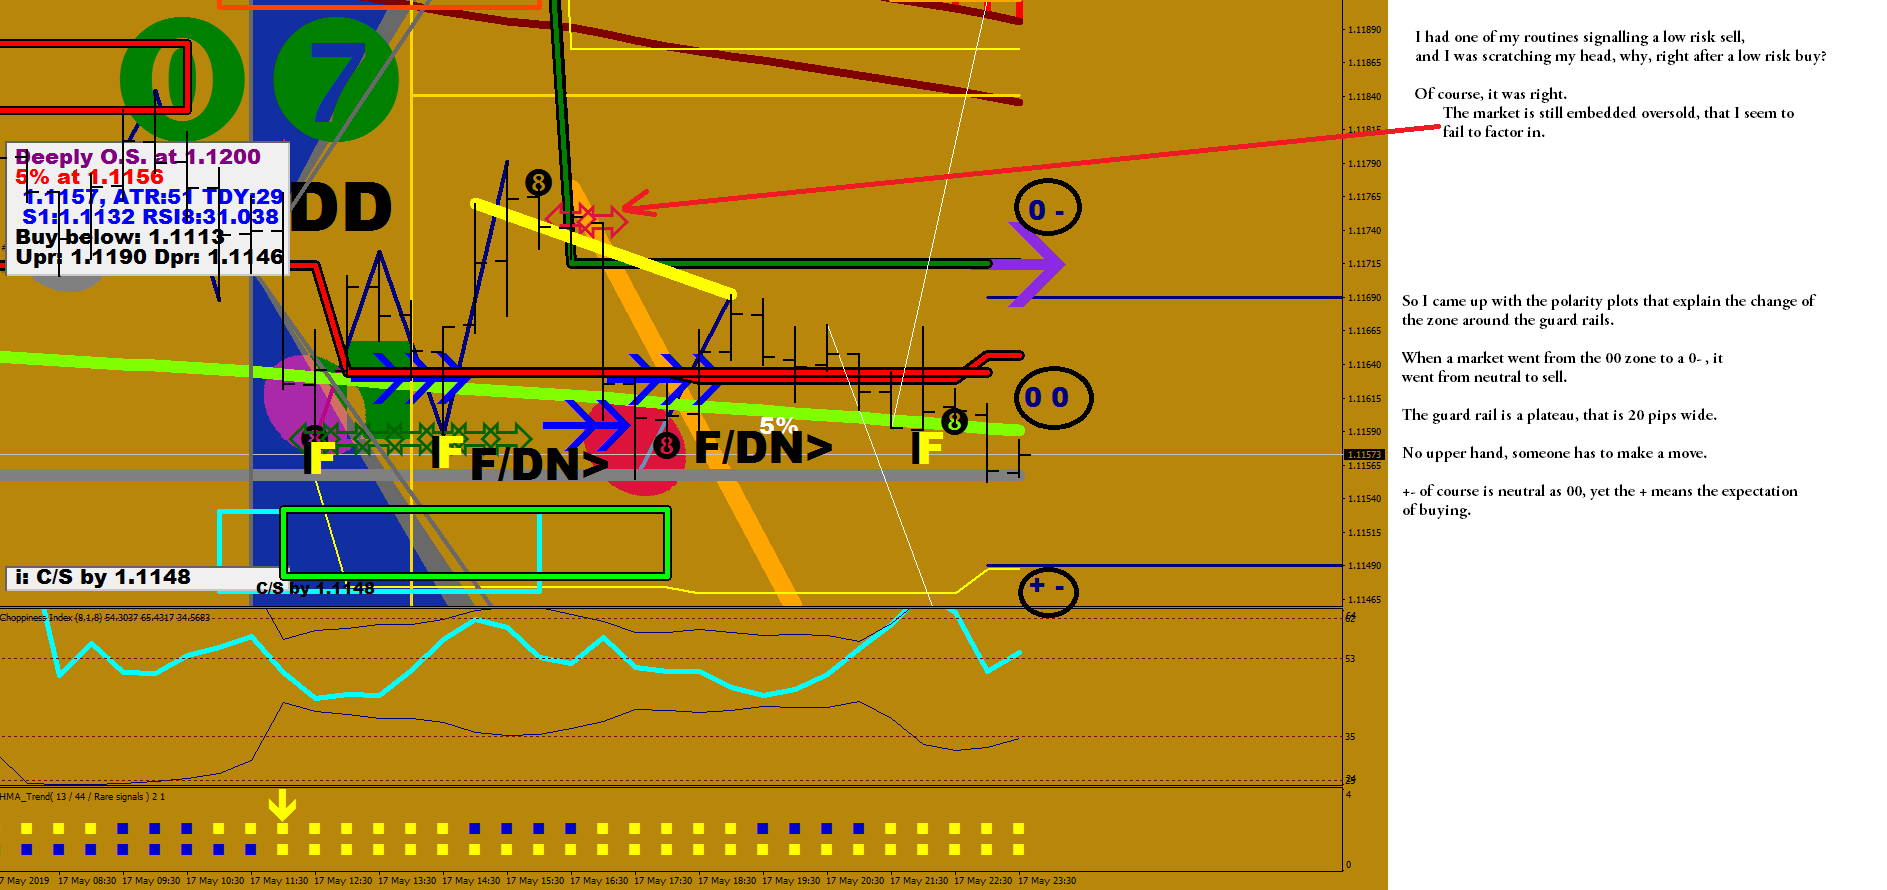
low risk sell: 1.2380
channel position: below the middle
channel target: 1.23252
E36: 1.2370
professionals: 1.2362, 1.2330
amateurs: 38% Long 62% Short
last exhaustion: 1.2343
downtrend from: 1.2378
4H cycle support: 1.2340
4H cycle resistance: 1.2380
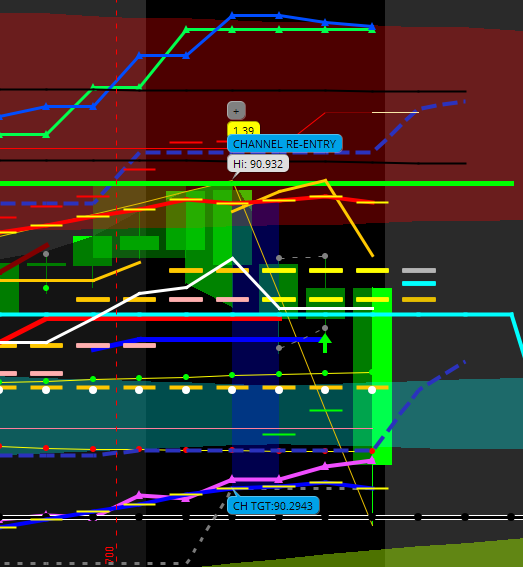
The Deflector – the last Maggot
2nd white was a Wave 4 – it seems.
You may be looking at the opening / Wave 1 down right now.
See the sentence, increased chance of reversal in the Principles article. (Price should not have fallen back here.)
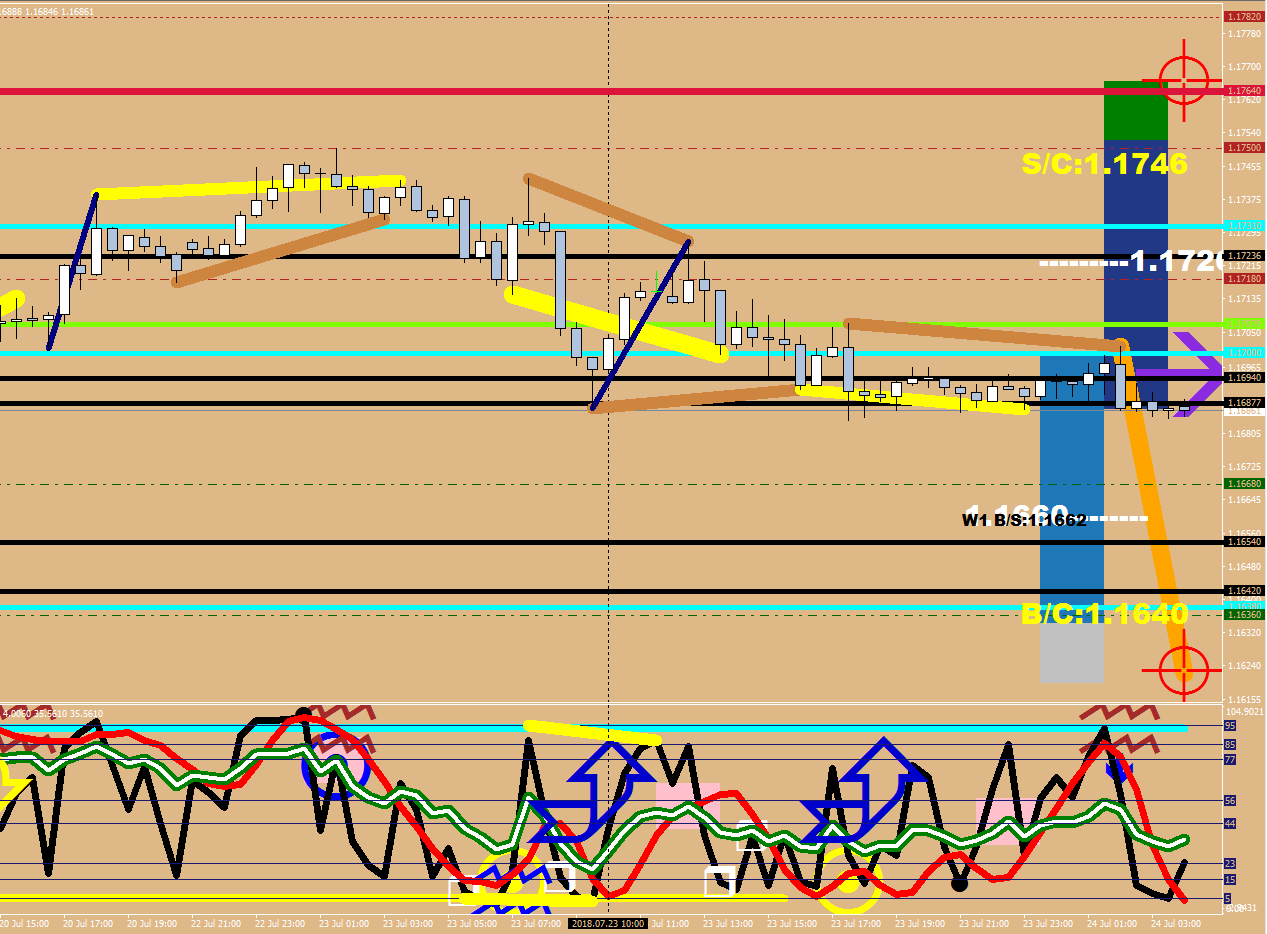
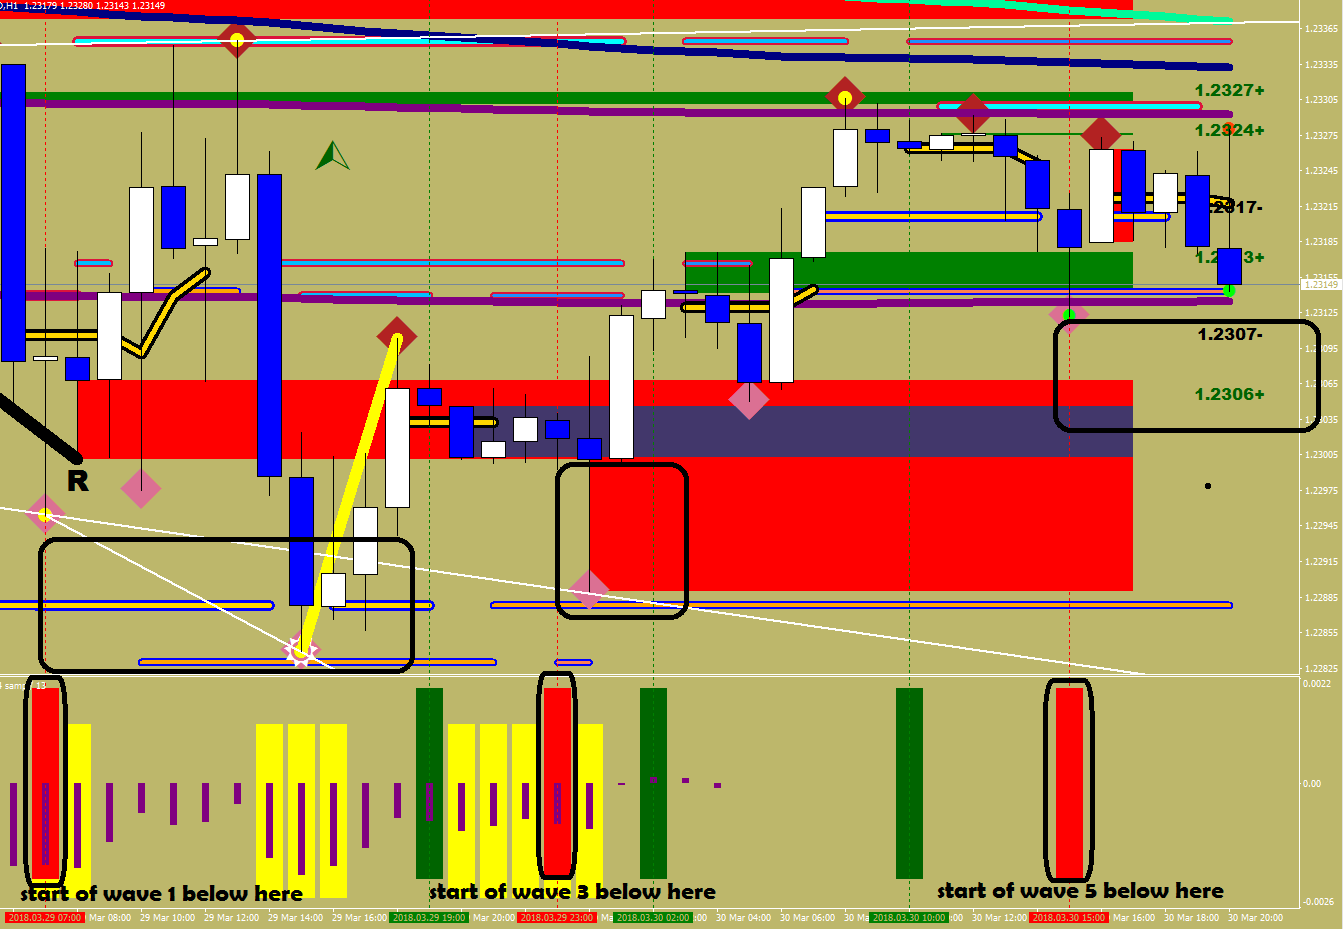
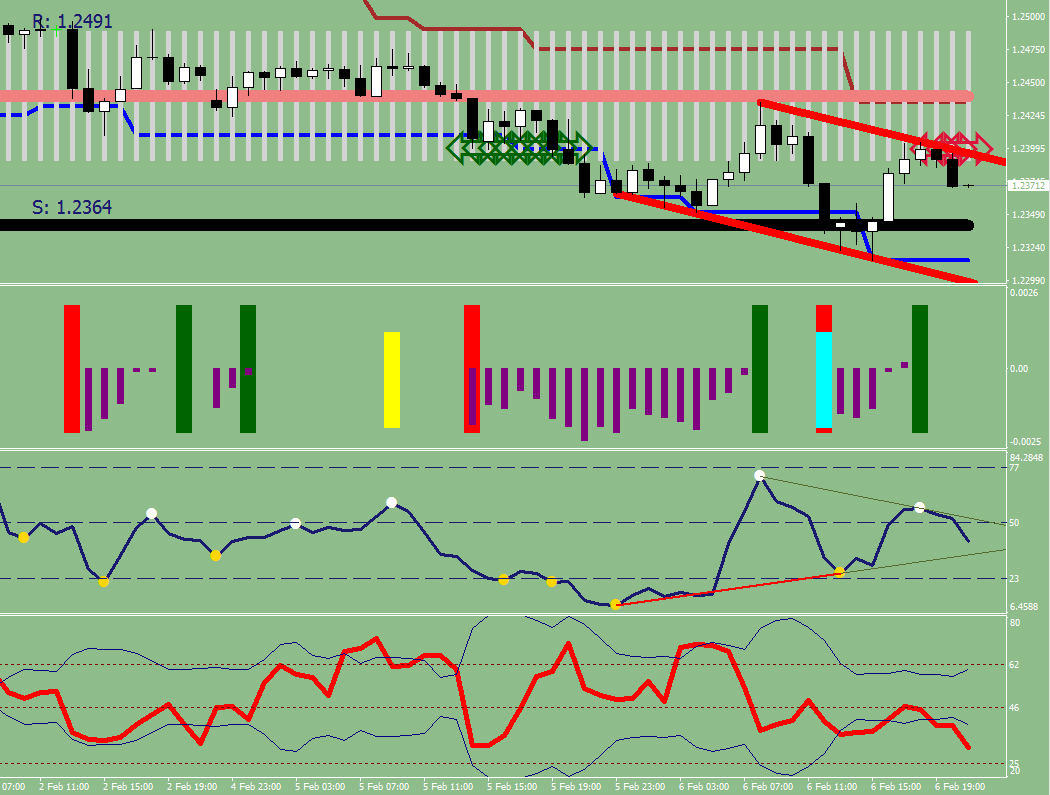
I decided on bringing out the Wave 1 BUY/SELL Stochastic Signals onto the right margin, see the above picture I ended up with.
Limbo at the 4h Green River… Wave 3 can start with any gap down now…
Play Wave 1 defence for 50 pips up? (from 1.2283) It would be the perfect spot to gap to…
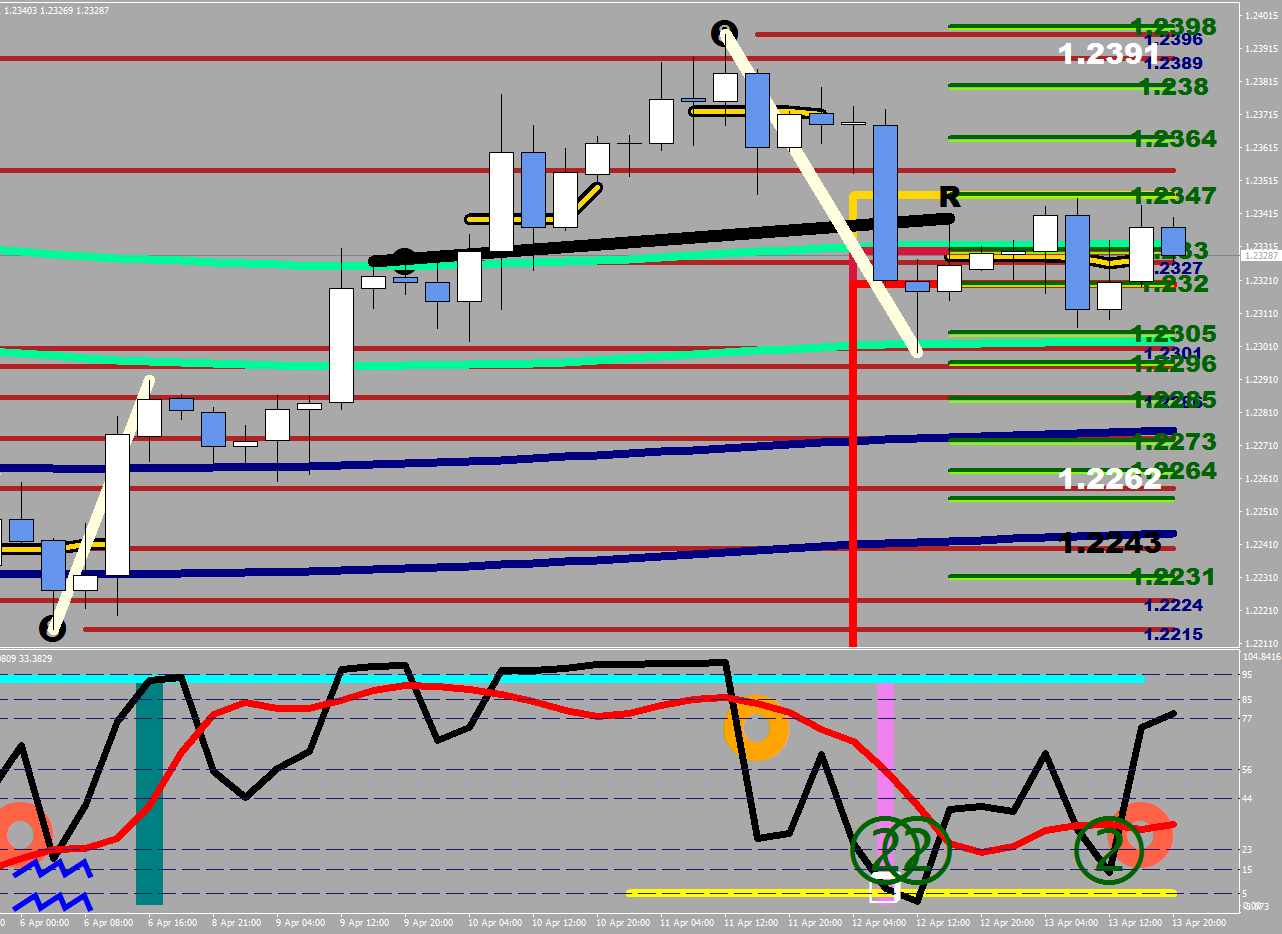
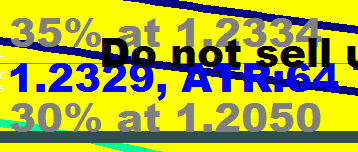
What is so important about 1.2334?

Wave 2
Bottom of upper reversal zone: 1.2265

Wind is down, relentlessly

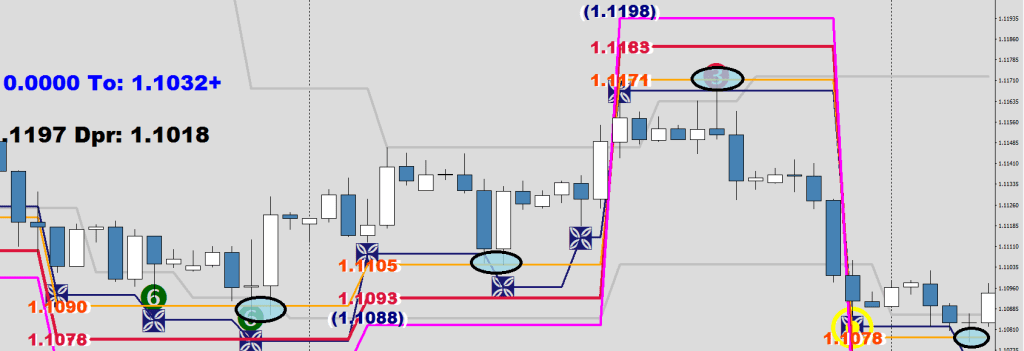
Little noise, nothing serious. Opening move down, 3 maggots lower – the sudden oversold was bought. The head is where the black “3” is at, we are pushing back into Wave 1 to the downside, Skid Rock time…
Buy (cover your short) only after the second downside exhaustion. And recharge afterwards upon a local overbought condition.

As a remark, there was a double pump at the top, check the two brown lines: sell level was/is the inner 8 @ 1.2387 and the stop could be put just beyond the outer one, 1.2396. It is a working trade. Maybe you should get my 88 Routine.

FOMC tomorrow, chaos is a given.
Next market maker level on the upside is 1.242, downside is 1.2280
Can this make it to 1.2445? I doubt it.

New feature: sudden oversold / sudden overbought by the number 2
There is an extension possibility here to back test the confluence of the Wave 1 defense and market maker sell 30-40 pips higher.

…or price could just collapse from here like a ton of bricks…
channel target VS projected distance. My bet is this move was a terminal one.

I see… a double pump (88 Luftb.) which makes the current wave a C?

Drop away, then retrace… where you get to short the hell out of it at the inner 8 with the low risk stop above the outer one.
Does not look good. Currently in Wave C or Wave 3 up, so gap up is a possibility. One more green exhaustion on the upside and bulls are finished. Touching the green river monster that has crossed below the 30 min & the 1h LEMAs. Bearish configuration means TROUBLE.
Short 1.2310, and if it makes it any further, add all the way to 1.2336.


What is 88 Luftballons? (find it in the posts)


Wave 5 missing


Upside break, now in Wave 4

Wave 1 Defender “12”


Tell me that this does not look like a bull flag…
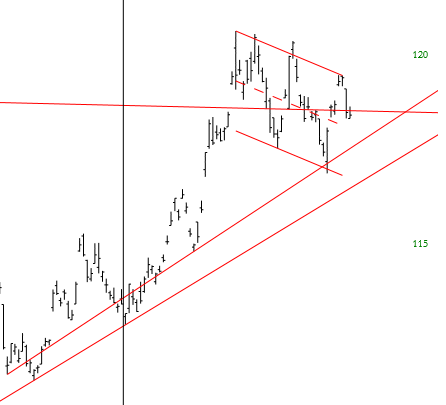
1.2229? 1.2365 first?
“There are only 4 reversal patterns: Upper & Lower Head & Shoulders, Rising & Falling Wedge, all other patterns are continuation patterns.”
Scott Barkley says, no pull back, they want to hit a large options order at 1.25…


(shrug)

Last 4h upside & downside projection values based on projected distance (above)
Quick channel target


You’ve got 4 different time frames’ (different types of traders) heads lined up in a narrow band.
Last D head: 1.2546
Last 4H head: 1.2527
Last 1H head: 1.2526
Last 30m head: 1.2499
How many buy stops (buy to open & buy to close) would trigger if the price was driven above 1.2560?
Imagine for a second that you are a blind believer of E.W. principles, such as Wave 4 cannot penetrate Wave 1.
You are going in short up to the arrow, and placing your stops nearby. If that stop was within 15-20 pips of your entry, you were probably knocked out for a loss by the MMs immediately.
Now, if that down move was merely a Wave 1, and we are in Wave 3 to the downside… How bad would you feel about that almost perfect short entry upon seeing the gap down?
If you were a market maker and still had longs you wanted to get rid of, what would you do?
I would run the stops of people currently short, that are placed above the visible, long wick – and for extra safety – just above 1.25, and if there is more to be had, 1.2525, 1.2530 (the break out traders to go long) may be visited as well before the move down towards 1.1750.
Now, look at the targets prompted by the projected distance of the current move up and the channel target calls.
As a reminder, EUR is not likely going higher in the near term. Market Makers were dumping out on the way to 1.25.

I saw some very bot-like action not long ago, in the after hours
I think I could write the program for this


Wave 3 to the upside
Wave 3 can be impulsive or corrective
Golden Rule: Whatever you do, don’t sell!!!
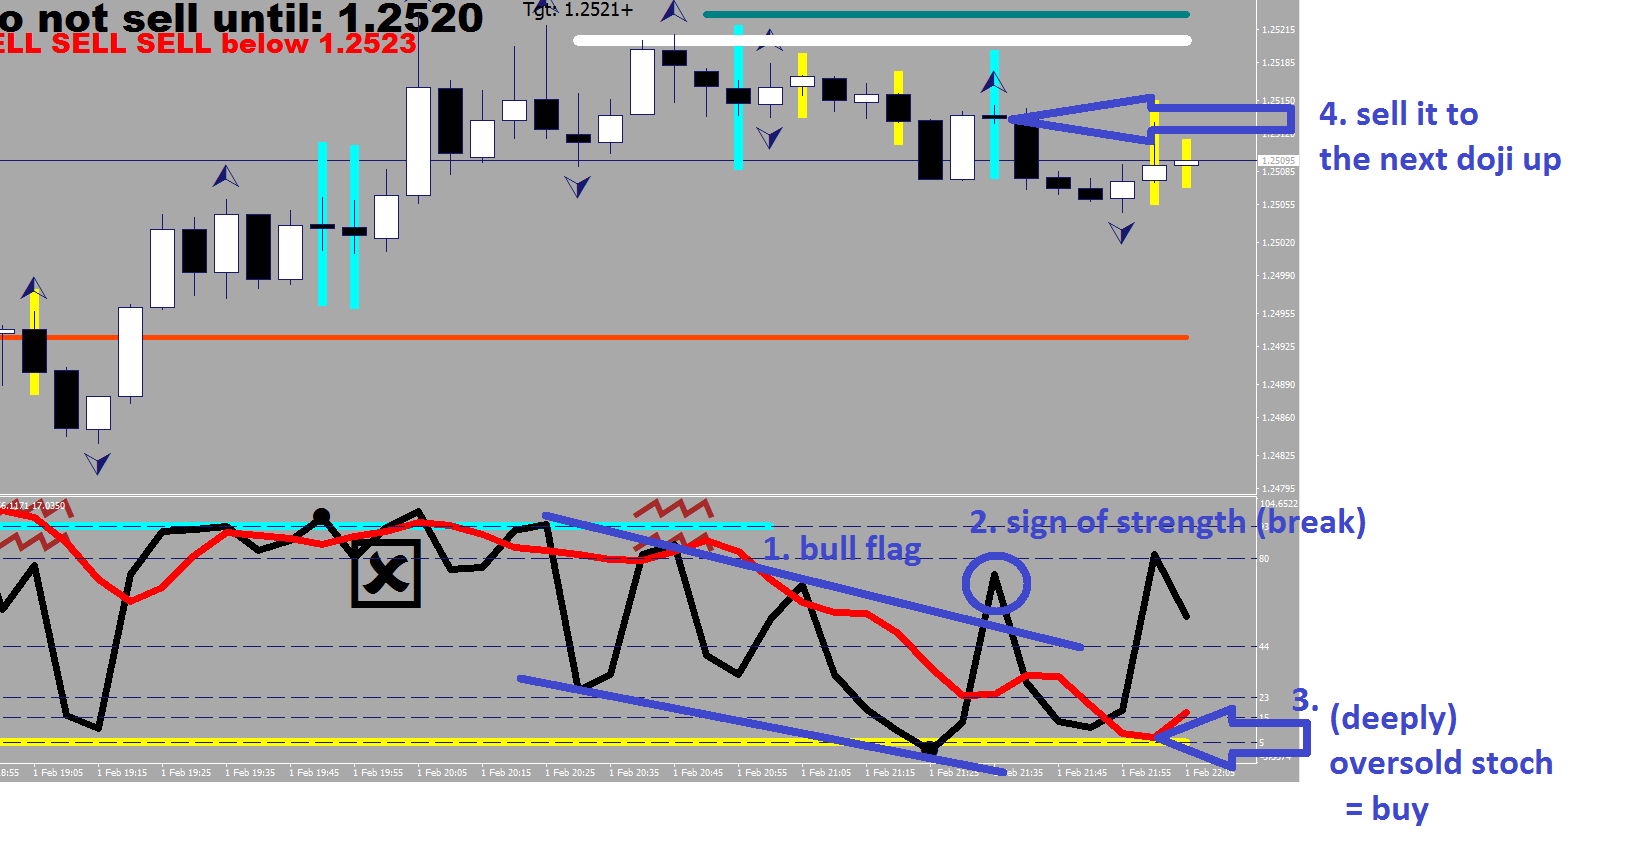
Features: stochastic readings can embed in the overbought; there are plenty of bull flags, the deep pullbacks are the ones with oversold stochastics, but local oversold is also buyable (15 min), your bet is a higher high, but there is no need to sell until an SOB shows up, that breaks the price below its channel – you should sell out after this happened at/above the top.
Wave 4 to the downside
Features: it goes local oversold (RIS2) twice, and oversold at least once.
During trending, wave 4 would fall shy of the terminal point of wave 1.

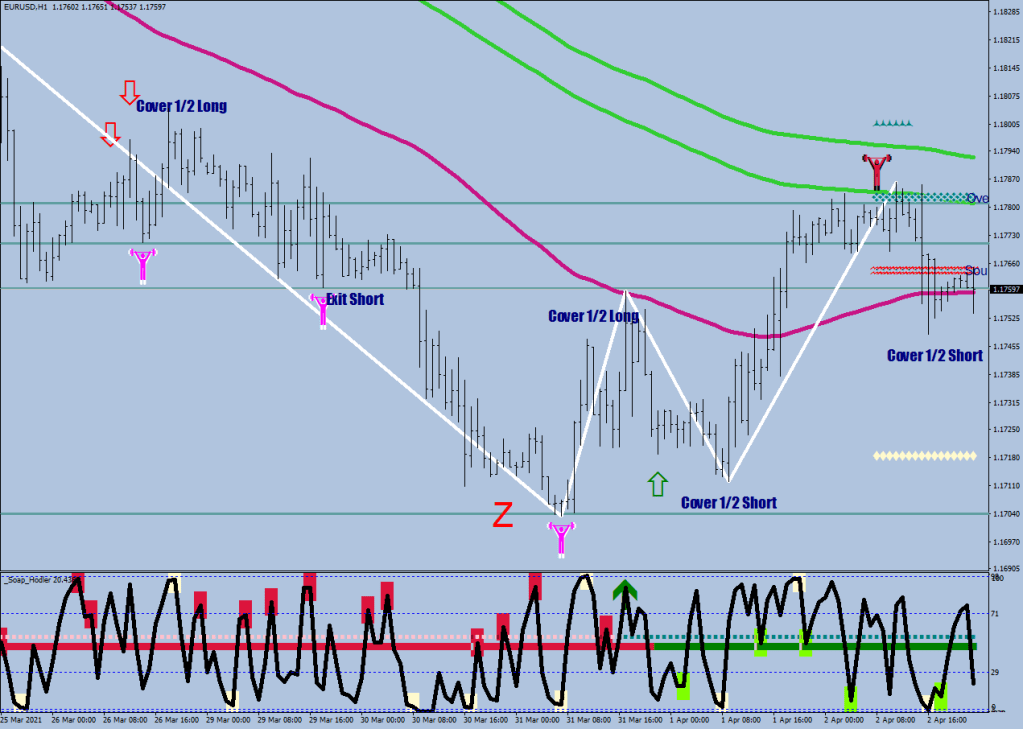
Double dump

There are different ways to a market turn. A double dump (X) is when a wave 3 runs out of participants, and has a last push within it. Wave 5 would be missing and so the result is a 2-wave move instead, a C.
if ( Period()==15 && RSI2[i]<5 && RSI2[i+1]>5 && (RSI2[i+3]<5 || RSI2[i+4]<5 ) && RSI2[ArrayMaximum(RSI2,4,i+1)]<23) doubledump[i]=13;
COT out
With a week’s delay, as usual. I’m not trying to read too much into this, but there is a feature that I can point out. The next leg up seems to revolve around the small speculators getting wrong footed (sudden drop). This is a limited number people poker, and when the official loser folds – or blinks, someone else wins their bet.
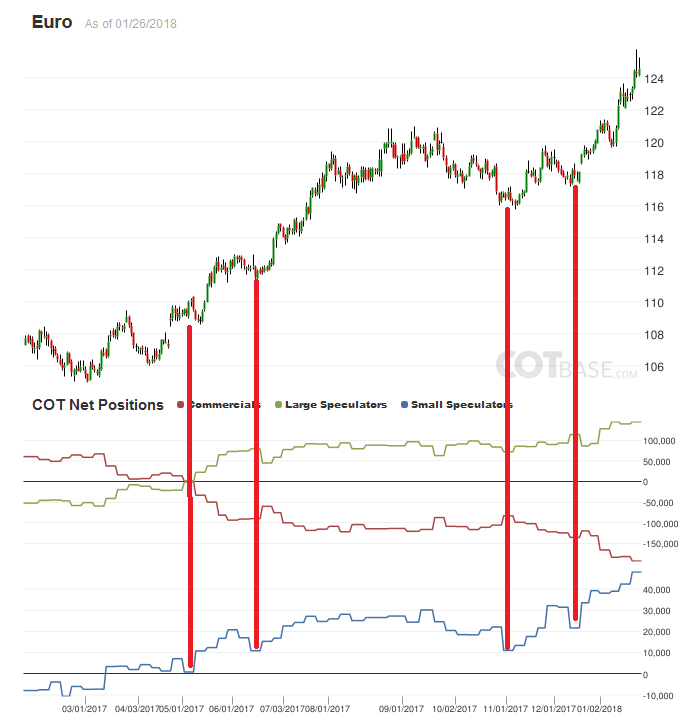
Out of the limited number of players, you can see how a top is made: when there is no one left to buy.
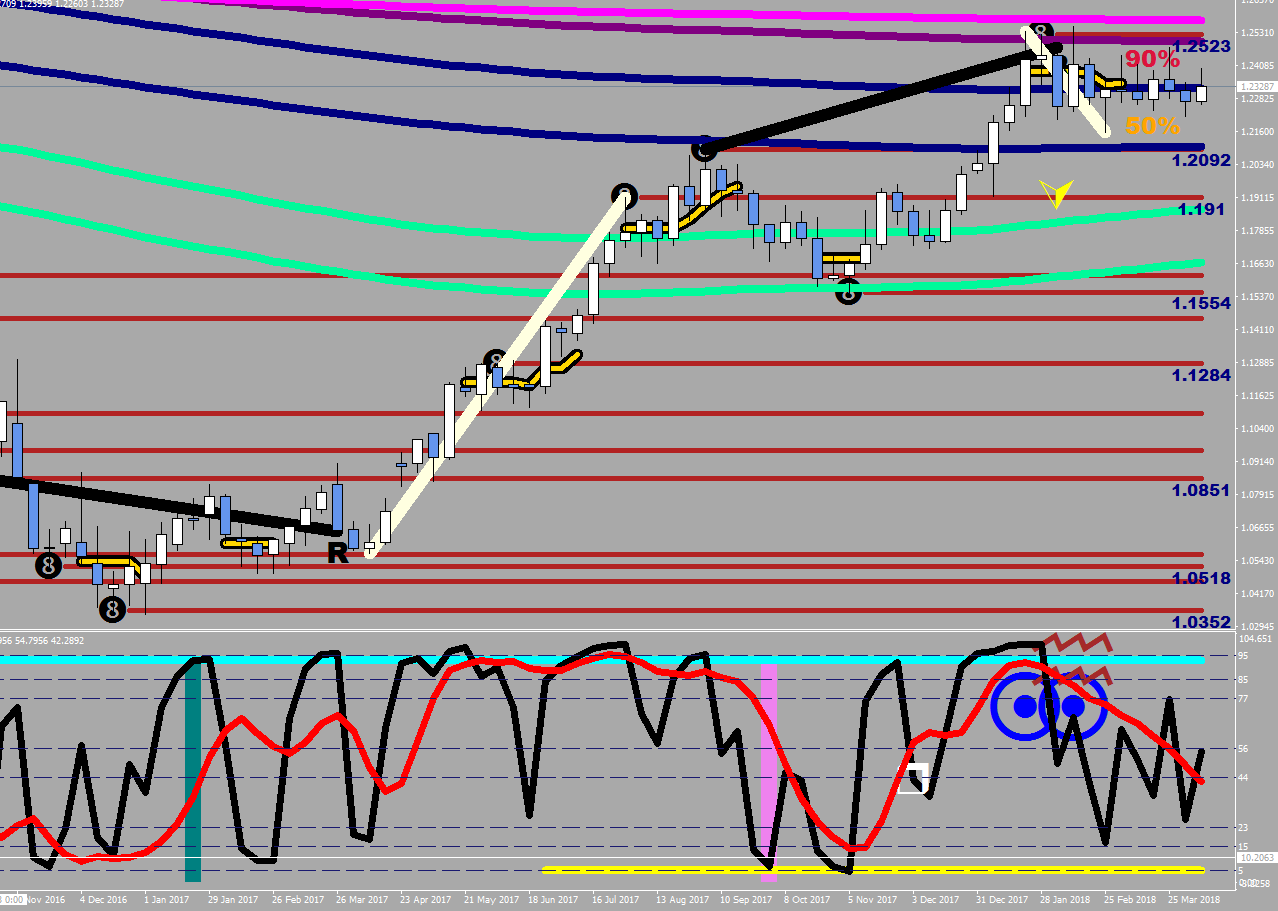
I’m having a hard time approving of the last move up to 1.25 as a wave 5. The wave 4, if it has not ended yet, is the weirdest correction I have ever encountered. I would think the price is going to play catch up to the bottom of the channel, by when it would be over the recent top.

Now, is it possible that it would move lower first, and if, how far?
Friday’s close was awkward, for price stayed oversold for a bit and it went beyond the root effectively eliminating it. So, support’s gone. There was a quick rally back up after this, that fizzled out around 50% of the last leg up. Gap below is what you have in mind, to hand out your shorts before the sucker rally, dear institutional trader?

Yes, the measured move is 1.2515, but, there is a channel target first…

Something between 1.2380 & 1.2369? An undercut of the head at 1.2364 would do it? Would you let it slip all the way to the deeply overbought neckline at 1.2332? Can we even get a full back test, the measured move of the impulse wave down to 1.2285?
We shall find out soon…
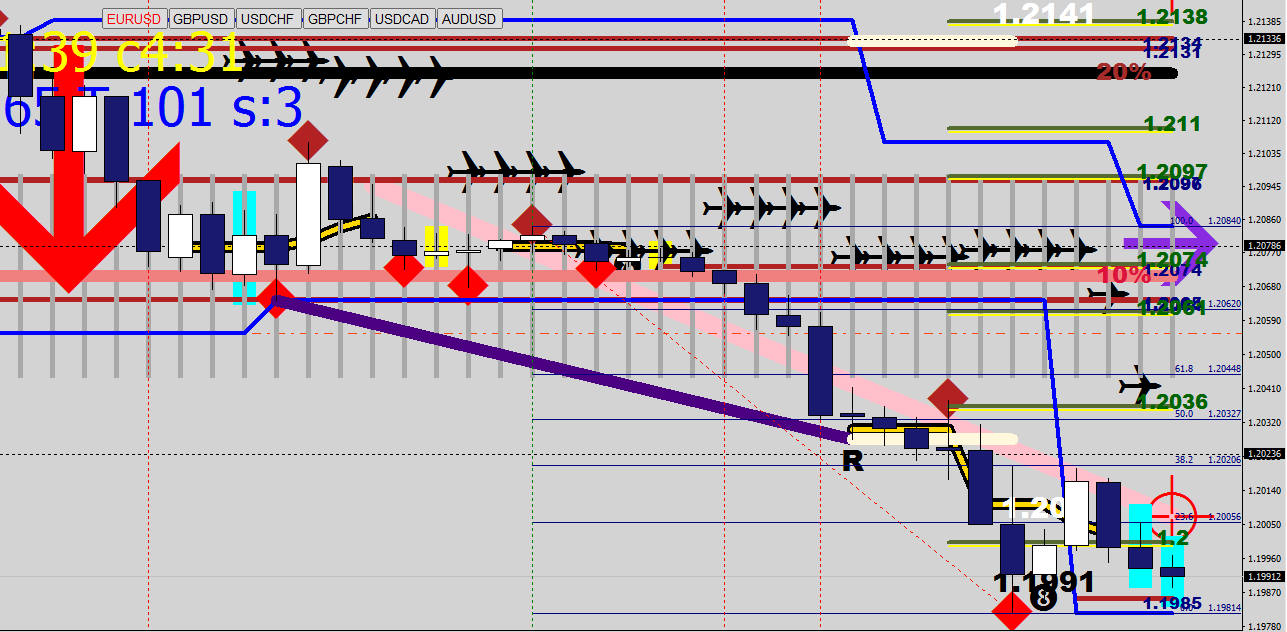
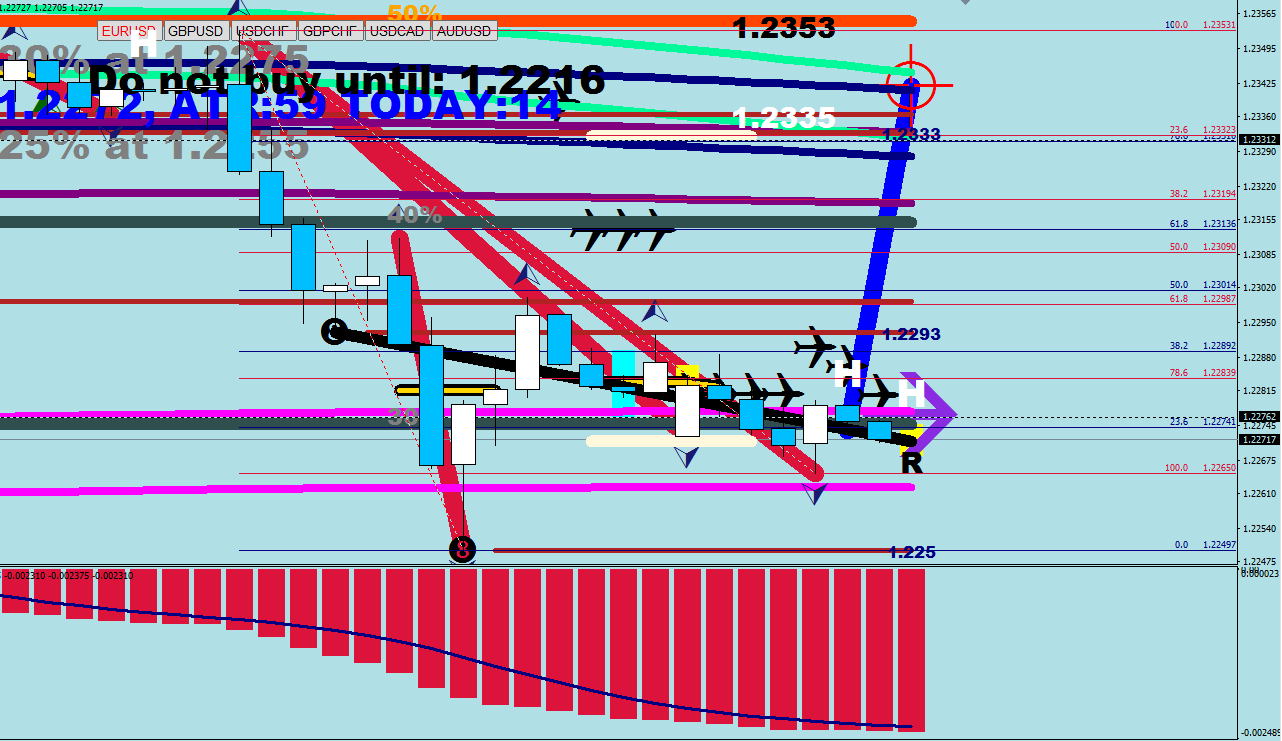
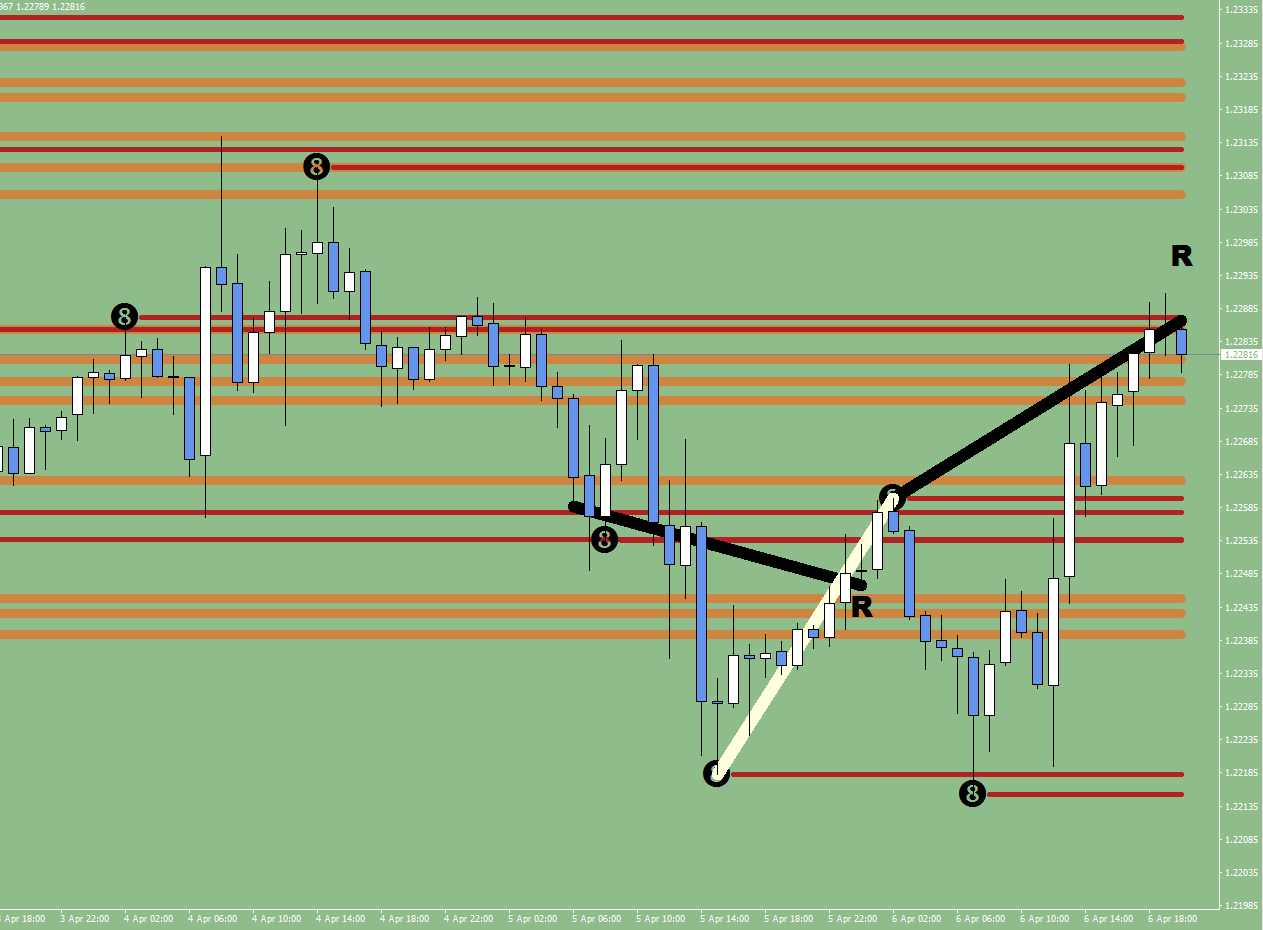
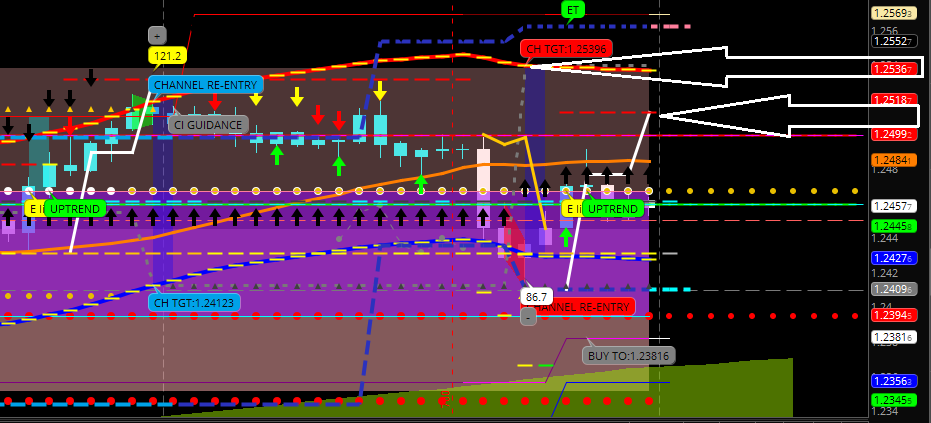
R stands for Root

I post a popular article, I get 100-125 visits that day, some people would come back for the next 3 days, on the 4th I have virtually no visitors. Conclusion: people are not interested in checking my EUR/USD current read page, and all works with this are in vain. Therefore this page from now on is merely a store of images, that I keep up for myself to look at on occasions while I am away from home.
Buy “15” (2x) =
if ( Period()==30 && RSI2[i]<23 && RSI2[i+1]>44 && RSI2[i+1]<80 && RSI2[i+2]<80 && RSI2[ArrayMinimum(RSI2,10,i)]<15 && RSI2[ArrayMinimum(RSI2,6,i)]>5 && RSI2[ArrayMaximum(RSI2,6,i)]<90 )
- 6-sample minimum >5
- 10-sample minimum <15
- 6-sample maximum<90
- current rsi2 <23
- 44< previous rsi2 <80
- rsi2[i+2]<80
if (Period()==30 && RSI2[i+1]>35 && RSI2[ArrayMaximum(RSI2,8,i+1)]==RSI2[i+1] && RSI2[ArrayMinimum(RSI2,10,i+1)]<12 && RSI2[ArrayMaximum(RSI2,9,i+1)]<80 && Close[i+1]>direction ) strength[i]=23;
- a 10-sample low below 12
- the previous RSI2 read was the highest in 8 samples
- the previous RSI2 read did not exceed 80

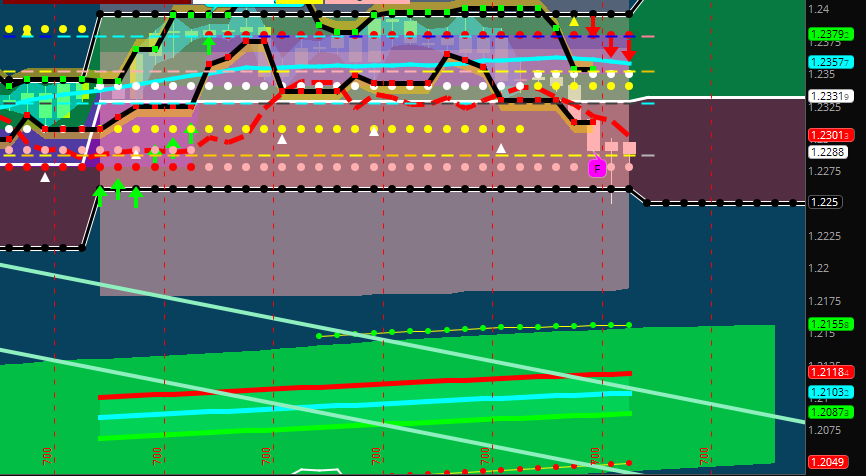
L/F = last failure (derived from 60 minutes values)
DVG4 = last 4h divergence level
CPS = 1h Compass level
*8* = last 8 Ball level (current time frame)
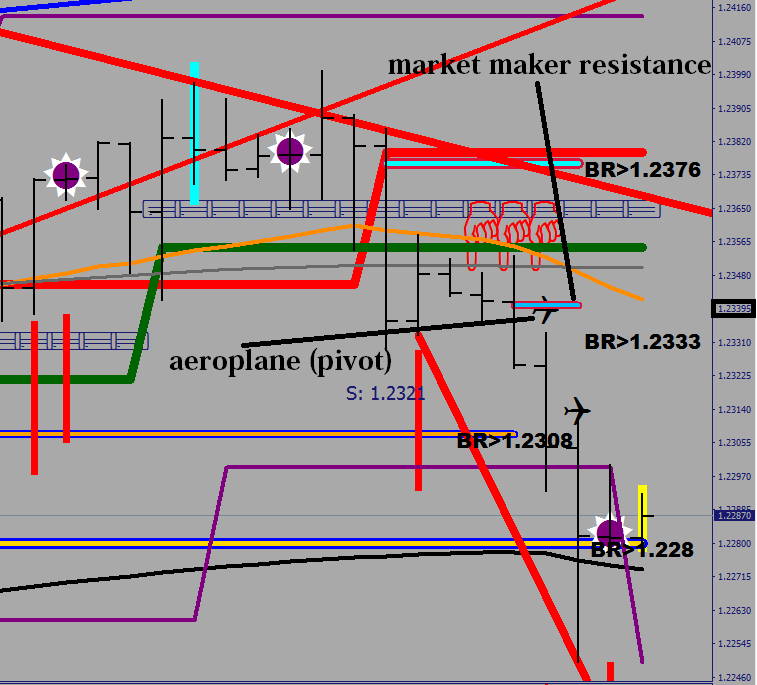
MMR = closest Market Maker Resistance
MMS = closest Market Maker Support
1.2382, 1.2521, 1.2546 are on the map.
COT>
https://www.tradingster.com/cot/futures/fin/099741
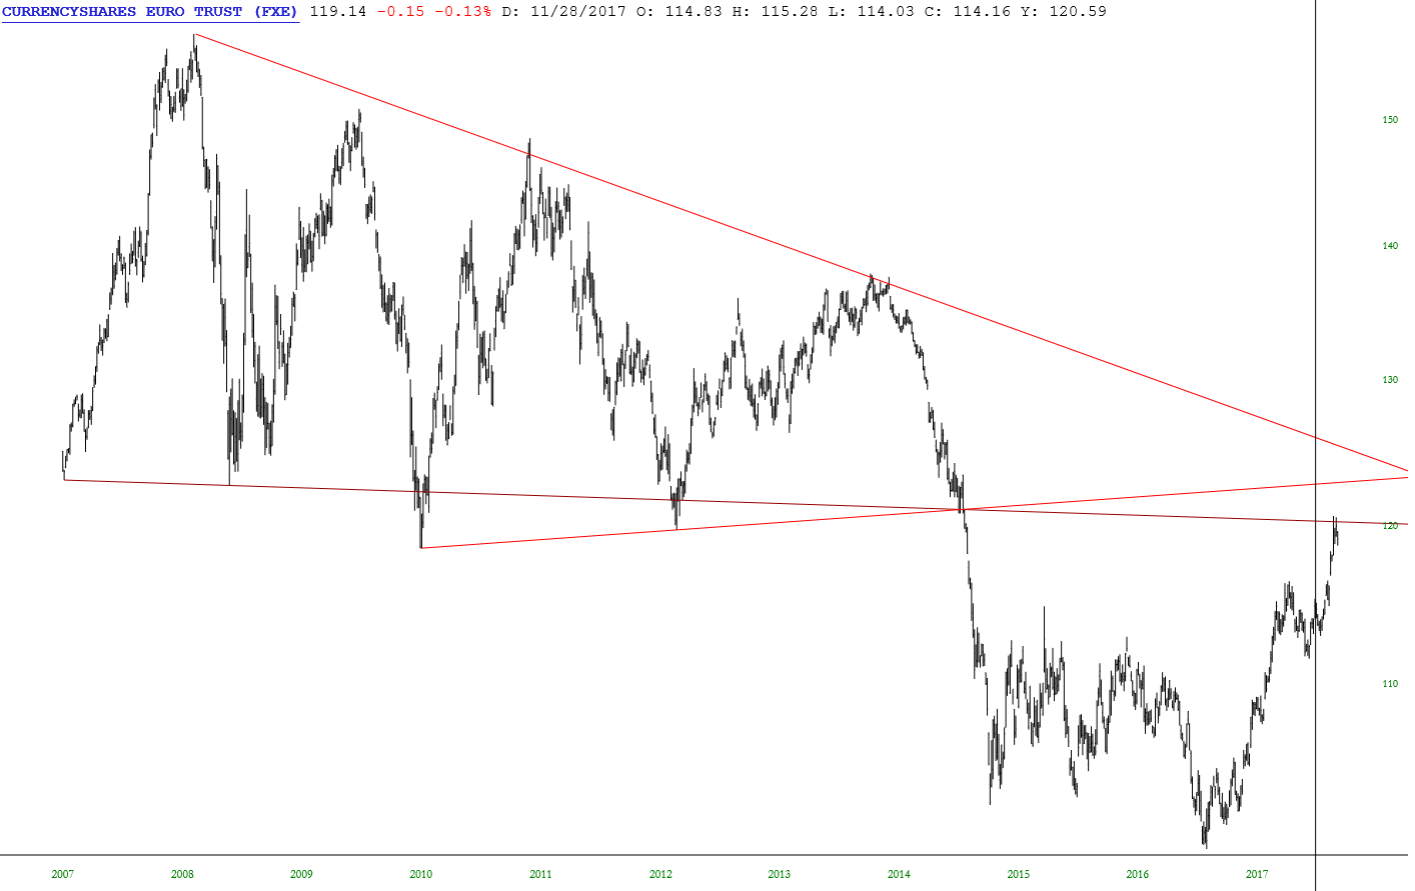
The big picture as follows (from last year):

As for future reference, on the http://maximum-pain.com/options/max-pain/
That sounds like a failure for the first 3 weeks and an incredible rally on the 4th.

