
Once you have the direction of progression right,
you can start to anticipate the road blocks (market maker levels) that would trigger a reaction.
These reactions do not change the direction of the progression, these moves would be mere retracements.
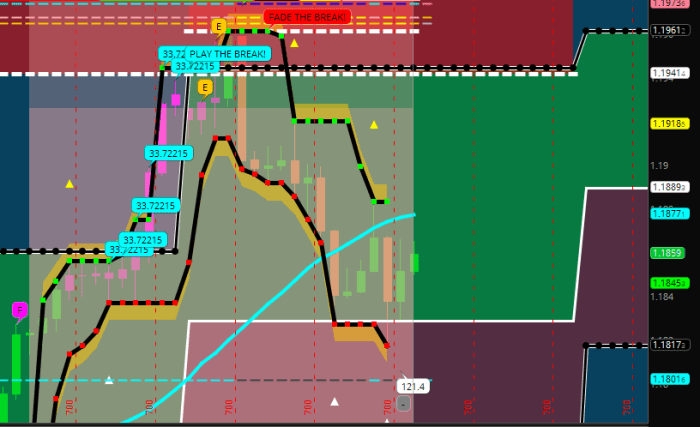
Sunday night started with a gap up in EUR/USD. Gaps occur in the 3rd wave, and this was not any different: an exhaustion gap up.
Wave 5 followed, and as soon as there was a fake out (red #3), the direction of progress got reversed.
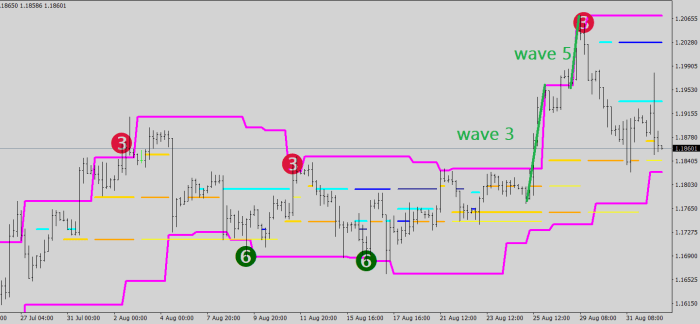
The correction first reacted around the yellow lines, which was a market maker support level. Since there was no violation of the 28-bracket, this bounce back up was a reaction, not a reversal, so as soon as it ran out of steam, the direction of progression came to play by default.
The low risk short level was easy to figure and you had at least two days to set your limit sell up. This is what my tools are for.
The first two:

ATR target on the left, circled, and projected distance on the right, the green beam up (ABC correction target).
There were other ways as well, of course, i.e. if you keep track of professional volume (green high light below), and the blue framed white line is an MM resistance after all.
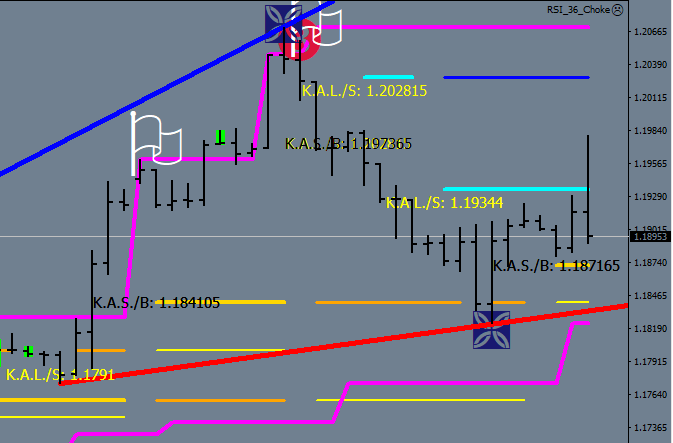
(This lat image shows price being in no man’s land, right below the green-yellow close line – it is oversold here and to break the low would normally require a scurry move up first.)
Think about this for a second: where did it matter that who was the ECB president, what was he doing or what was the NFP number compared to what?
Your bet of course is that the current low would be exceeded.
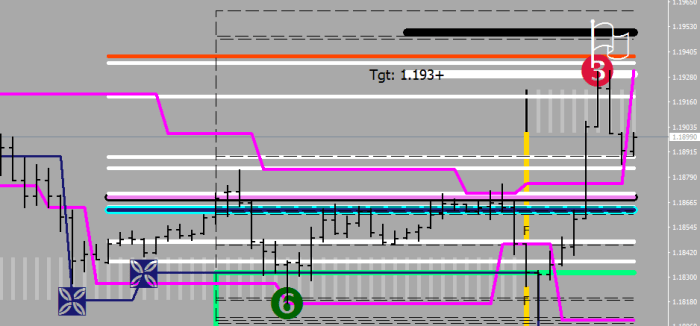
Another Example
(Archive)
29/11/17 20:15 GMT
Stalling at 1.1861
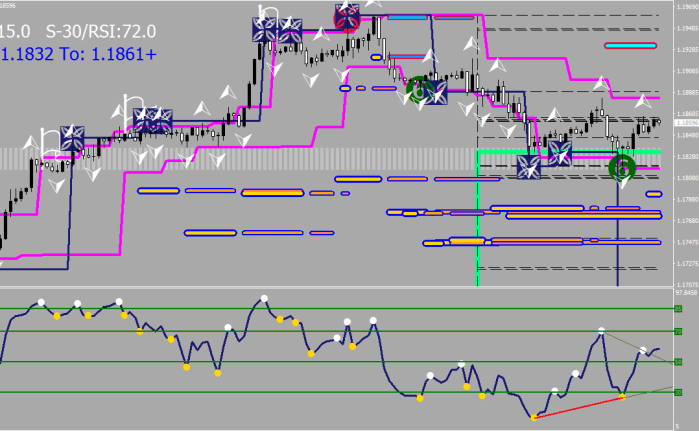
Gonna clear it? I think so.
There is a new MM resistance level glowing at 1.1932.
The colored section is sponsored by my Boot Camp series. Running away from these heads (heads can be re-visited):
Last M head: 1.0510
Last W head: 1.2100
Last D head: 1.1554
Last 4H head: 1.1969
Last 1H head: 1.1819, 1.1832
Last 30m head: 1.1873
Weekly resistance: 1.2050
Weekly support: 1.1480
ATR upside limit: 1.1931-1.1951
ATR downside limit: 1.1803-1.1783
4H projected distance (upside): 1.19976
4H projected distance (downside): 1.17786
4H overbought neckline: 1.17415
4H deeply overbought: 1.1918
stand out support: 1.1780 (¬ 2H LEMA)
We are at the weekly pivot. Nothing bearish about this, one more dip to 1.18 is not out of the question though.
channel position: closer to the bottom, at E36
channel target: 1.1910
E36: 1.1853
professionals: 1.1930, 1.19, 1.1850
amateurs: confused, but heavily short
last exhaustion: 1.1825
uptrend from: 1.1840
1H cycle support: 1.1840
1H cycle resistance: 1.1930
&&&&&&&&&&&&&&&&&&&&&&&&&&&&&&&&&&&&&&&&&&&&&&&&&&&&&
this is what happened that day:
- there was a pullback towards 1.18 (see above) that violated the last head
- there was a rally to the shiny, fresh Market Maker sell level (ditto)
- – from where there was profit taking that took back price to the black dash ex resistance level plotted by my 36 VRLD routine
- you can also see the shaded area where price would likely settle today
It is not possible to cater for anyone more than this for a day.
