
What makes a tool professional?
In my view they can provide you with valuable information that you could hinge a decision on.
Such tool is usually dedicated to a single timeframe and or a single instrument, which may help with risk / reward calculations due to known statistical values.
A pro tool pre-digests, crunches the data and prompts you about imoprtant changes / tradeable events.
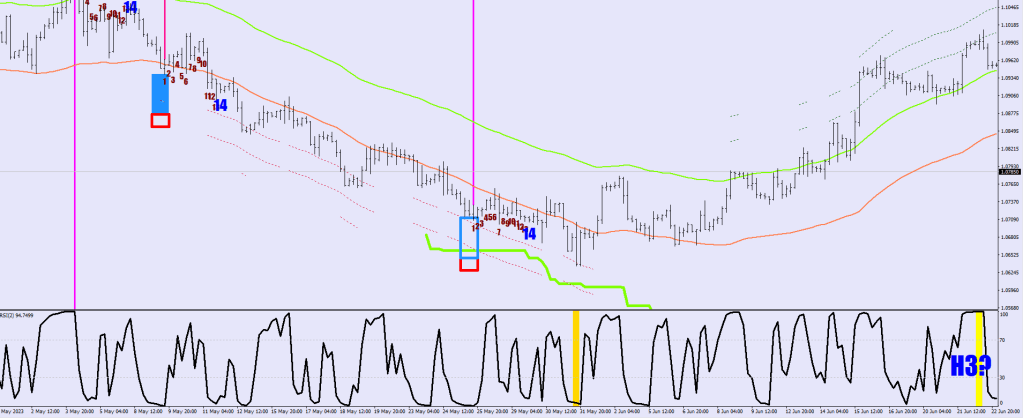
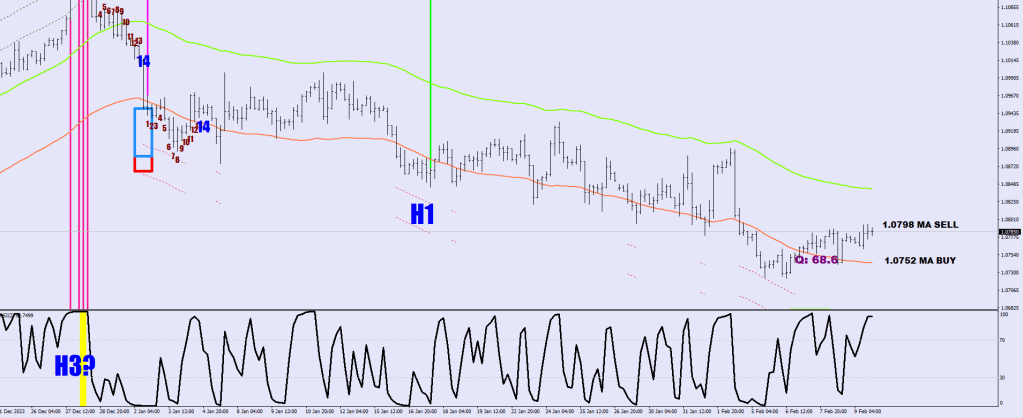
Here’s for instance Nick Rhodes (for the Daily). It functions as a digitalized RSI2. Since you don’t have X-Ray eyes, you would not by default have an interpretation between a 3.6 and a 4.5 RSI2 reading on top of not even considering this sample size and/or setting it onto Closing prices instead of Medians. Nick has a daily levels ticker and the red and green highlights are based on the last consolidation level’s projections, these numbers are the closest to the 3-day ATR limits.

This professional tool would signal you in a binary manner, plotting a magenta brick showing that the RSI2 was low / high enough for a reversal to have taken place. What is the use of this? Say you have a top in place and the market is gyrating lower from day to day. Until the first magenta print, you can sell rallies and have some sort of security that there would be a lower low. Scale in, don’t over commit.

A magenta print is not a guarantee that the last low/high would be made the next day, but a caution sign: it is possible that the low / high would be printed the next day and the market could reverse from here. Thus a professional tool can help you with the development of your own thinking.

Nick Rhodes 1.0 is for free
Another example for you: the Axel S (for the 1-Hour) plots P/NRs (point of no return). A re-visit of this level (carried over as a thick yellow line until the first touch) prompts a reaction. You can have a minimum of 16 pips.

Put up 10 lots and score an extra $1600 on the trade that day, no questions asked. Of course there should be more meat on the bone if the P/NR receives the approach from the opposite direction.

The 1.3 had some color changes and it should be plotting the P/NRs without re-visits with numbers as well on the right.
The Tie Machine (30 minute) plots the spinners and can keep plot the first back test of one such spinner’s middle in blue after 25 hours of silence (the numbers behind are the candle’s number from the right). There are 2 quick return plots, the Break Down / Up failure and the Break & Close Failure (more pronounced).
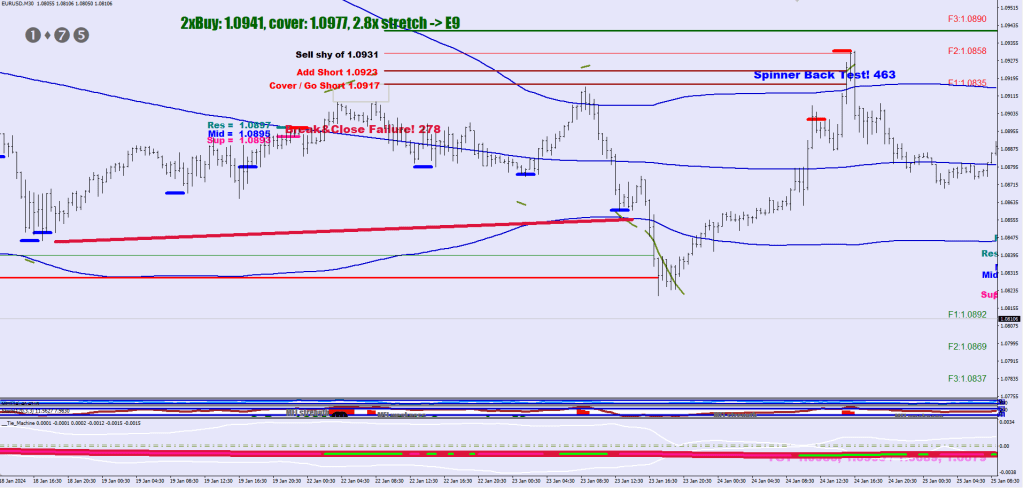
The gray numbers upper left are the distance from the E-9 measured in fluctuation size. 2.8x stretch would light up to signal ripe conditions for a reversal.

This is of course all besides the money flow droop, which is the most accurate thing to get a money flow beat reversal right.
Tie Machine would require a payment. Since there was Nena playing today, I would accept $99 for it. My email is still macdulio@yahoo.com
Despite the name, this tool is not dedicated to any timeframe (or even an instrument), it merely figures the last consolidation mean (purple arrow) from 15-minute energy data and then makes its projections.
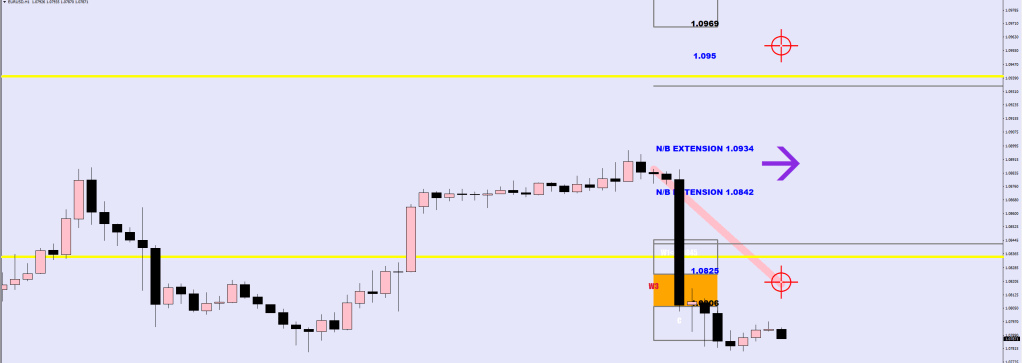
The projections are the W1 box close and far end (from 20-pips back from the 3-day ATR distance).
The yellow lines are the Goldilocks levels, both a Wave 1 and a Wave 3 would likely get to this level.
The W3 box is from 3-day ATR to 30% extra field.
The last box is another 20 pips beyond the W3 field. A major break of volatiliy would land price here on a closing basis.
Powder boxes 14 count down, approximate locations of Upper & Lower Guard Rail, Bumper Lines, support / resistance levels dotted upon approach, vertical highlights, Wave 2 Ma Ribbon Resistance & Support.
It plots also into indicator window one, so an RSI2 HL2 plot is suggested.
From here on the original Evironment/Downloads page commences.
You may download in this section the .ex4 files that I decided on sharing in a zipped format.
You shall need to transfer the unpacked files in the Indicators folder of your MT4 and after restarting the application, these should show up amongst the indicators.
Since these routines use colors from white to black, a mid to light shade gray background is suggested.
I have nothing against the Yen pairs (other than the constant interventions), but they would require a multiplication of 100 for every calculation and this I did not implement.
If you always feel an urge to trade (a bit of a problem) the 6 pairs that I have buttons for,
EUR/USD, GBP/USD, USD/CHF, GBP/CHF, USD/CAD, AUD/USD
should provide you with an opportunity in any trading session.
16 Bracket – fake out reversal finder for 4H charts – form fitted to EUR/USD
V1.2.3 has added pro volume filter and deep water upside reversals included
V1.2.4 one added condition for sell
V1.2.9 back to back eliminated; an additional sell that falls short from the bracket; some additional sell filter; and an exhaustion buy signal
V1.3R added RSI divergence heads
V1.5 has 4h Doji Highs and Lows plotted by shaded rectangles
Custom finder of white flags / left shoulders that would likely be re-visited
and blue butterflies / heads – fake out, break, back test should happen here
use it on 4H or 30 min
blue bar – strong updrift, left shoulder printed
red bar – strong downdrift, left shoulder printed
This version does not allow for parameter changes
Projected distance of an impulsive move
No time frame restrictions, but I use it on 4H mainly
Don’t forget to put the chart in the foreground
calculates a possible distance from the las full consolidation level and makes suggestions
based on 15min readings; w means the weight (the root)
Stochastic lines at every 10% mark from 10% to 90%
of the 1590 Sample highs and lows
black lines: oversold/overbought (20%, 80%)
coral lines: deeply oversold/ deeply overbought (10%, 90%)
orange line: median (50%)
The plus marks up the upper and lower reversal zones in addition
For more info on this one look up the Blog Post with the same title.
V1.2 has “End game mode” sell included
Plots 2 lines on any time frame, that are based on RSI 2 readings and they should define a restrictive frame around the price movements.
Skid Rock plots the curious skid marks in recent time that represent entrapment, a divergence. 30 minutes and below: play the break-outs. Higher time frames: play the failures – when price comes back through these lines.
Bonus for those who cared to visit here.
207, 414, 828, 1656 (long term) EMA channels between the highs and the lows – plus the consolidation weights/maggots (deflectors) in one package. Works on 30 min and up.
414, 828, 1556 (long term) EMA channels, and 1,3, 5x Fluctuation Displacements. Works on 30 min only.
The new version has 26 instead of 16 range of examination sample above the daily time frame.
If you find the tool you have obtained from me useful for your trading, please consider a donation to macdulio@yahoo.com thank you.
