
I find these things to be true. Some miscalenous knowledge might come in handy if you want to stay ahead of the market.
No counter volatility (less than 29 pips) = continuation.
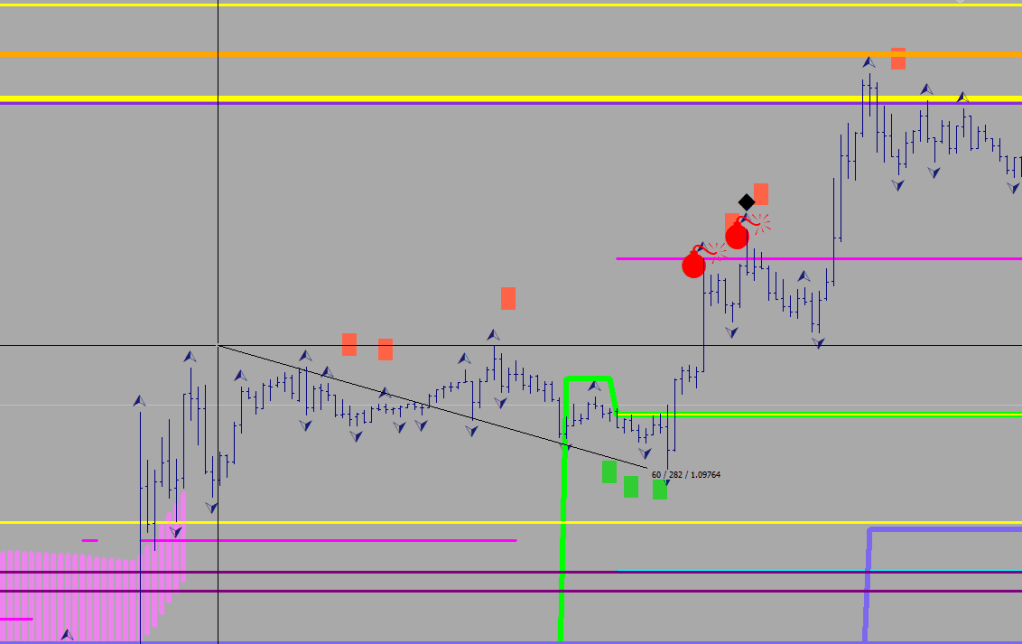
Teal T (4H fractal falling shy of the 30-sample 4H BB HL2 after a fractal print outside) = Return to 4H S30 / E32
case & point:

Other
A Goldie hit is a registration for a No Break Extension the next day.
Two consecutive Goldie moves = ABC
(Goldie is the 3-Day ATR minus 10 pips)
When I said about my 5-count idea, you didn’t think for a second that it isn’t gonna be implemented…

///8EMO Counts


if (Period()==60){
   for(i=420; i>=0; i--){
         if (Close[i+1]>E8[i+1] && Close[i]<E8[i]){
            dcount[i]=1;
            ucount[i]=0;
         }
      else   if (Close[i+1]<E8[i+1] && Close[i]>E8[i]){
            ucount[i]=1;
            dcount[i]=0;

         }
      else if (Close[i+1]>E8[i+1] && Close[i]>E8[i]){
           ucount[i]=ucount[i+1]+1;
         }
      else if (Close[i+1]<E8[i+1] && Close[i]<E8[i]){
           dcount[i]=dcount[i+1]+1;
         }

      else {ucount[i]=ucount[i+1]; dcount[i]=dcount[i+1];}

   }
}

deletetxt1("Counter");


///8EMO Plots


if (Period()==60){
   for(i=420; i>=0; i--){
   dir[i]=dir[i+1];
     if (dcount[i]>0 && dcount[i]<6){
        ObjectCreate("Counterd"+IntegerToString(i), OBJ_TEXT, 0, Time[i], Low[i]-40*Point);
        ObjectSetText("Counterd"+IntegerToString(i), IntegerToString(dcount[i]), 11, "Impact", Maroon);
        if (dcount[i]==5) ObjectSetText("Counterd"+IntegerToString(i), IntegerToString(dcount[i]), 31, "Impact", Maroon);
      }
     if (dcount[i]>=5) dir[i]=-1;

   if (ucount[i]>0 && ucount[i]<6){
        ObjectCreate("Counteru"+IntegerToString(i), OBJ_TEXT, 0, Time[i], High[i]+90*Point);
        ObjectSetText("Counteru"+IntegerToString(i), IntegerToString(ucount[i]), 11, "Impact", Blue);
         if (ucount[i]==5) ObjectSetText("Counteru"+IntegerToString(i), IntegerToString(ucount[i]), 31, "Impact", Blue);
      }
     if (ucount[i]>=5) dir[i]=1;
  }
}
Thought Beings keeps on coming out with original stuff
What next?
I’d expect the 60-sample 60-minute slow stochastic to go oversold.
We hit S2,
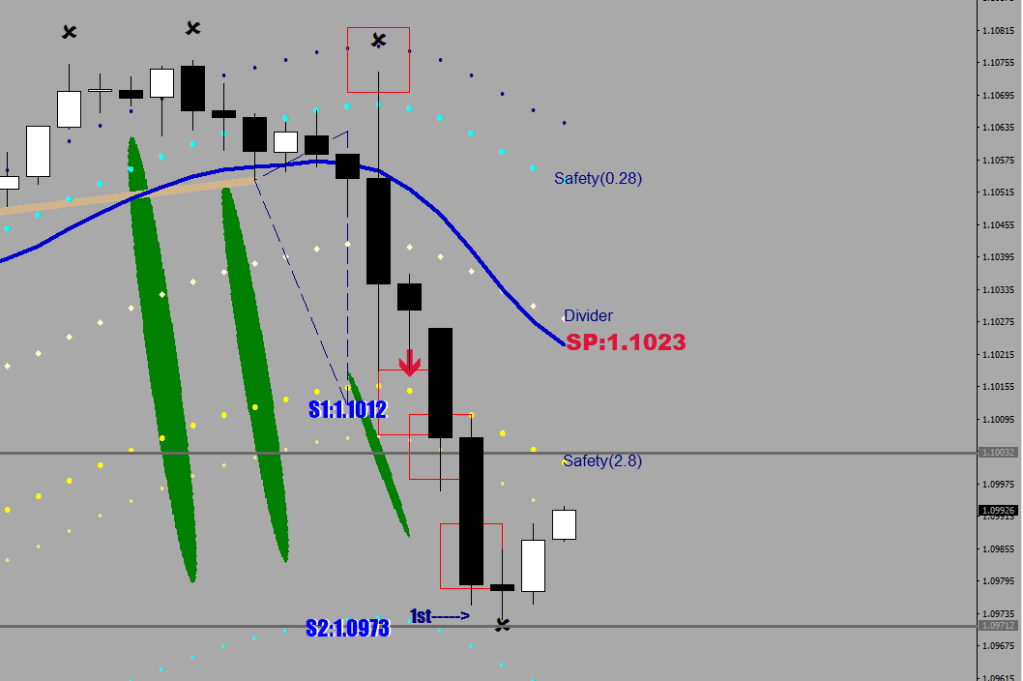
the bounce in theory should make it back to the 8-EMO with this B leg up. It should do a count again with 1 or 2 hourly closes above it, then proceed down to the low 1.09s.
There may still be buyers at the Red arrow, the daily stochastic embedding is still strong, but to get a deal, they would probably want to see a discount first.
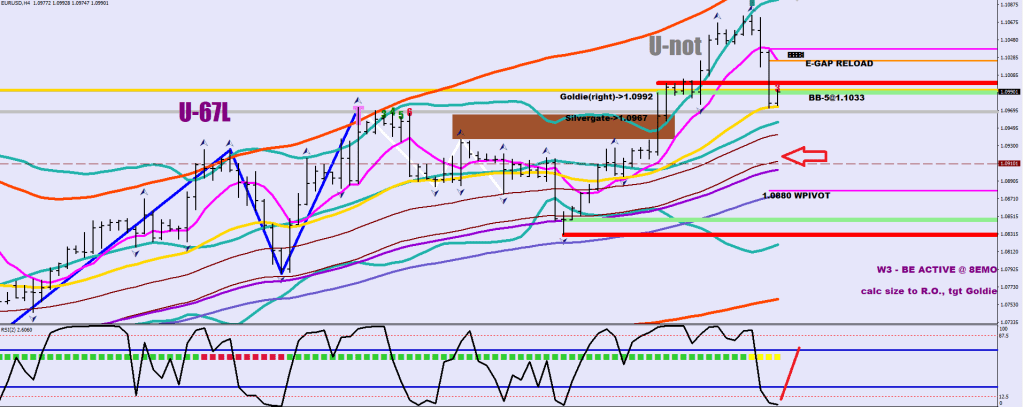
The red line on the RSI2 shows what a Wave 2 up print would look like on the 4H chart.
Discount starts below 1.0954 (green yellow line = S480)
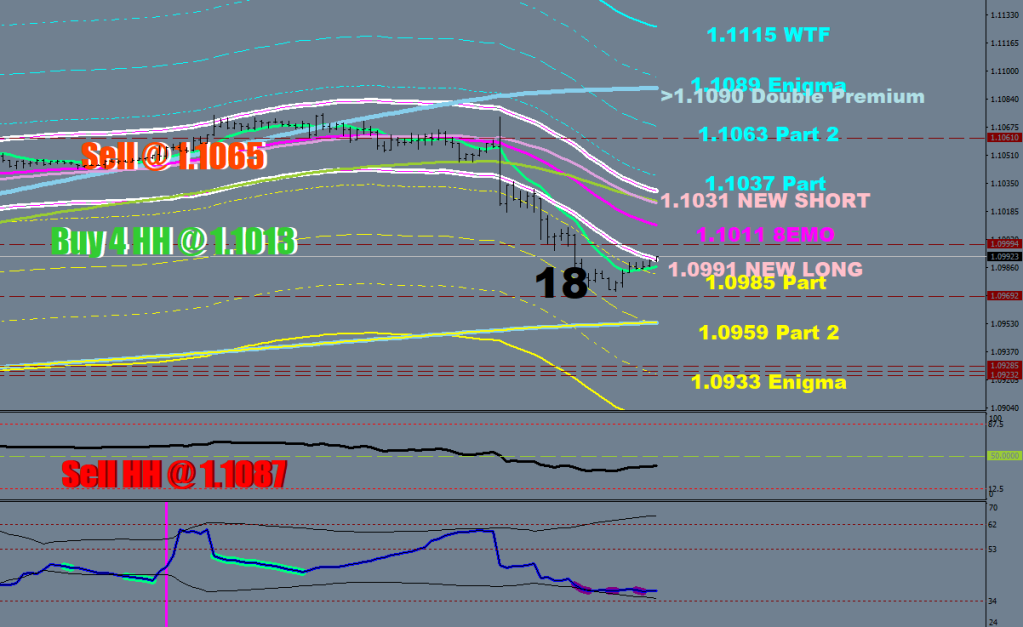
If nothing else, the Lower Guard Rail should pose a limit as a completion of a mean reversal.
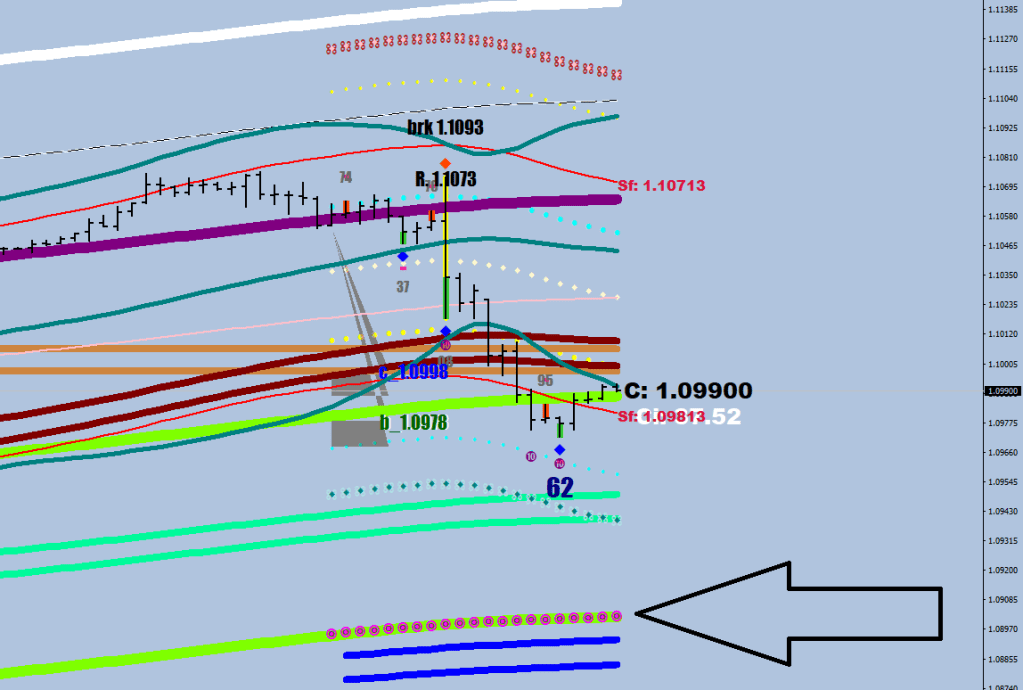
A white rabbit should confirm the new low.
