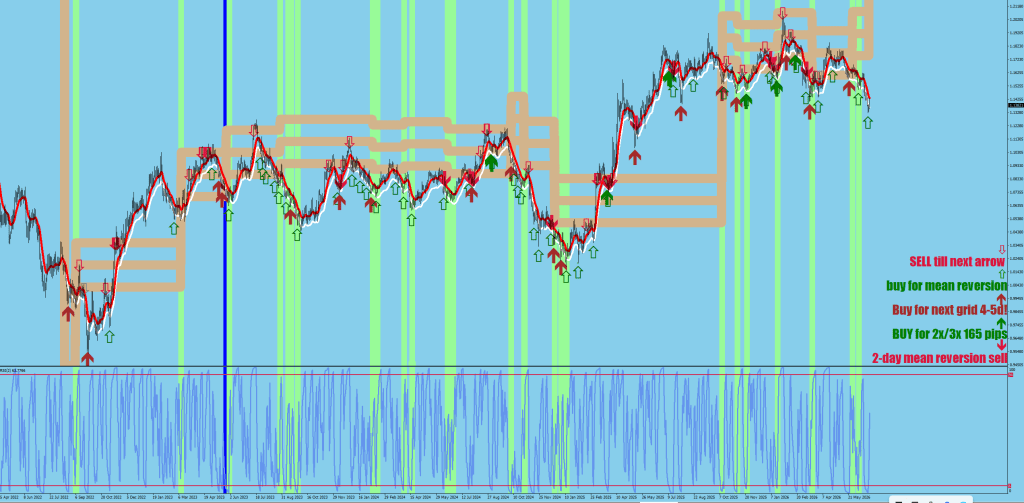
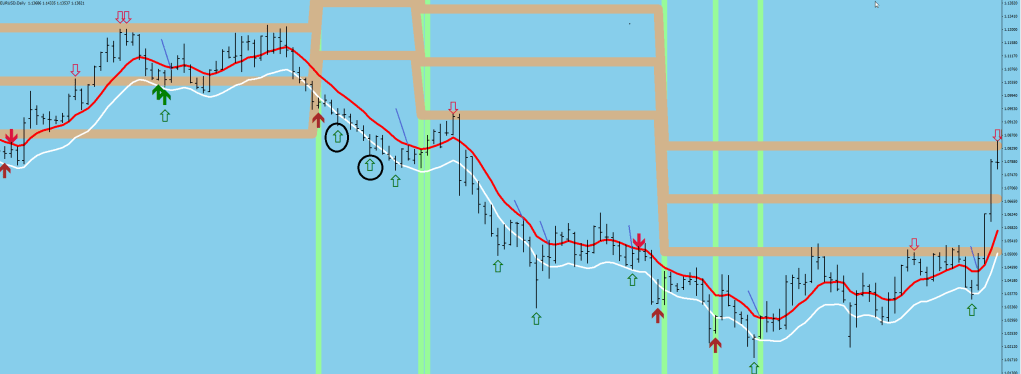
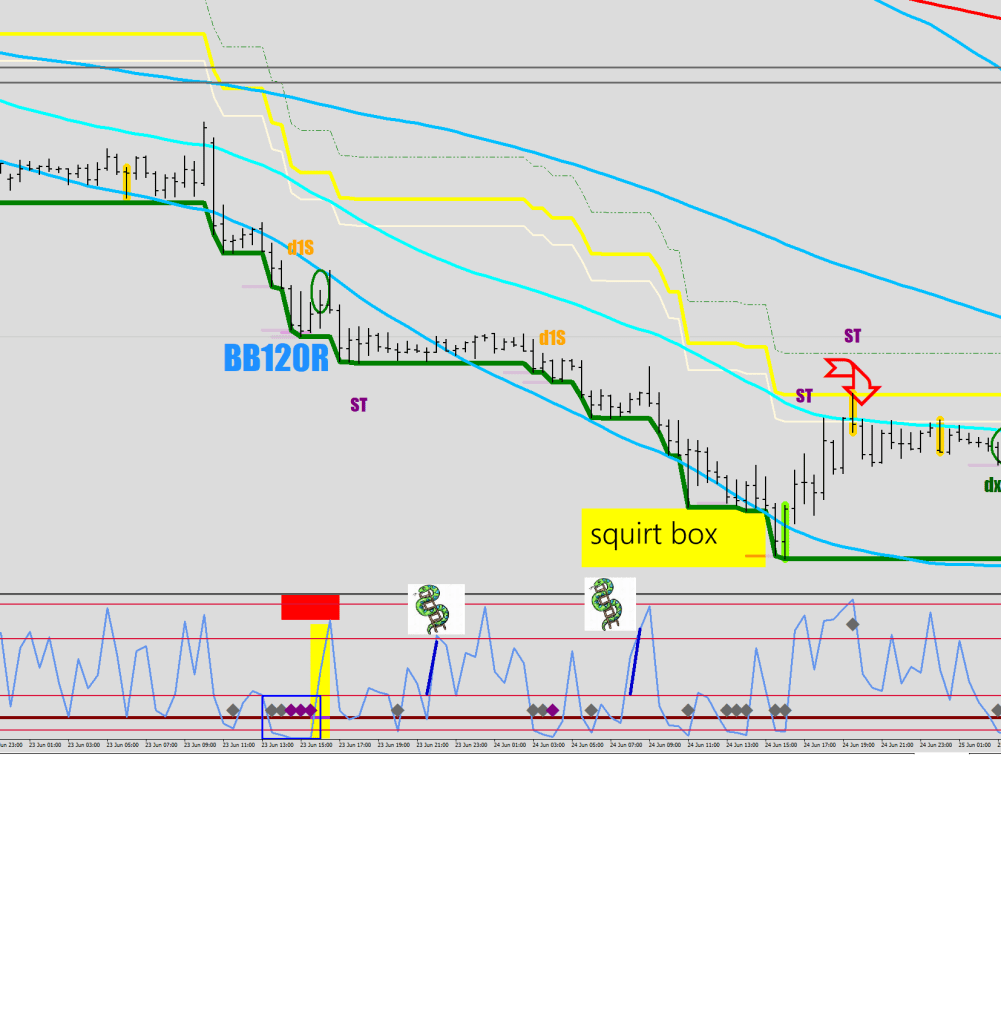
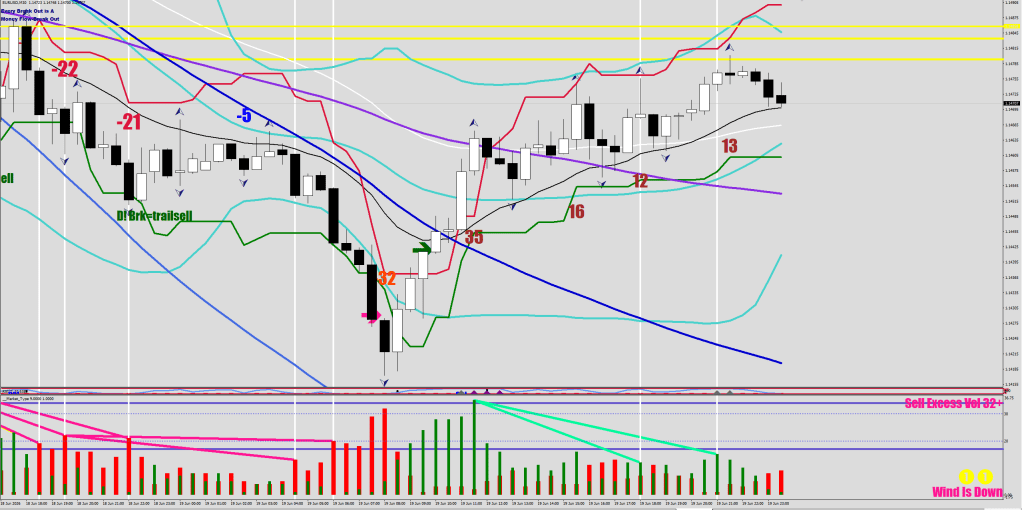
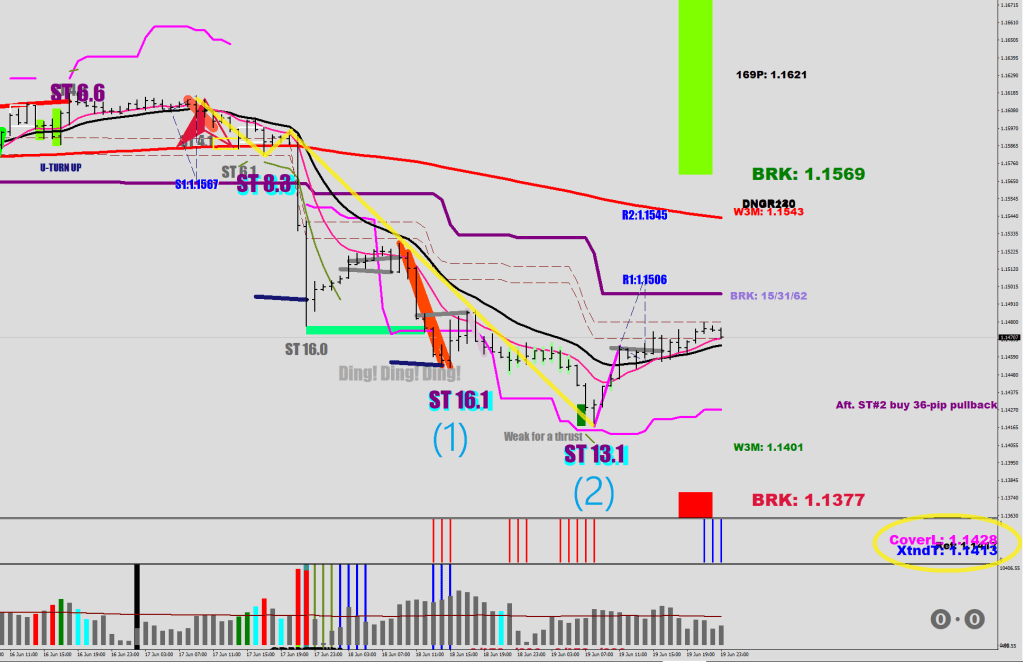
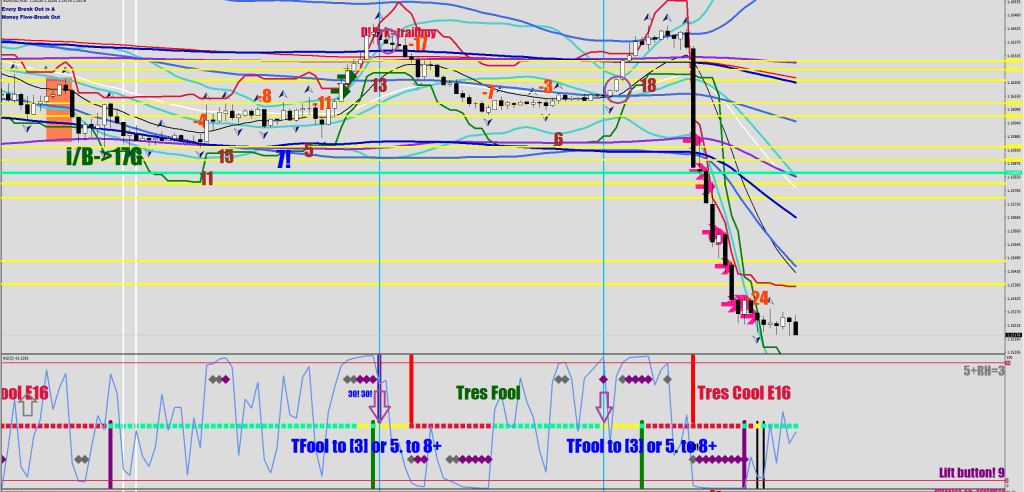
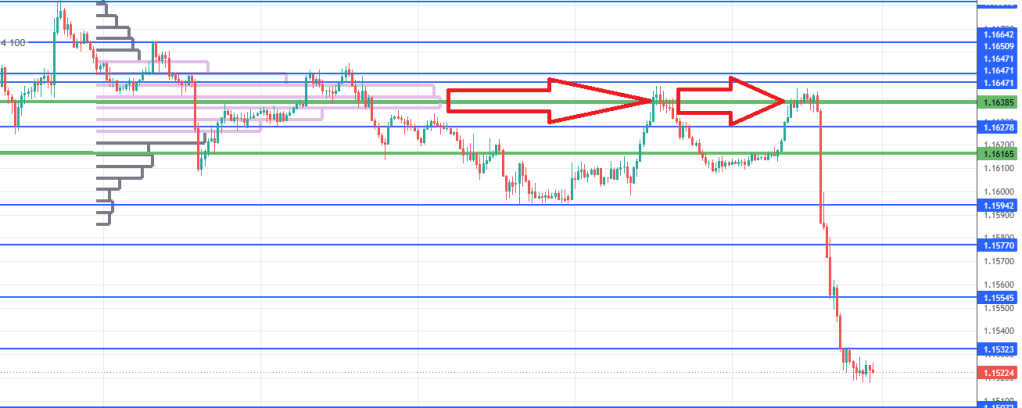
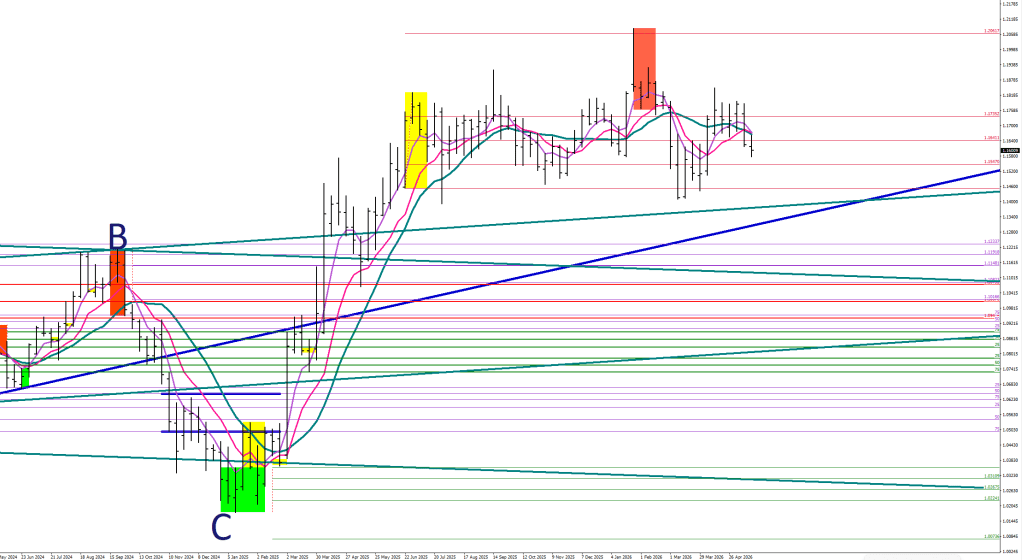
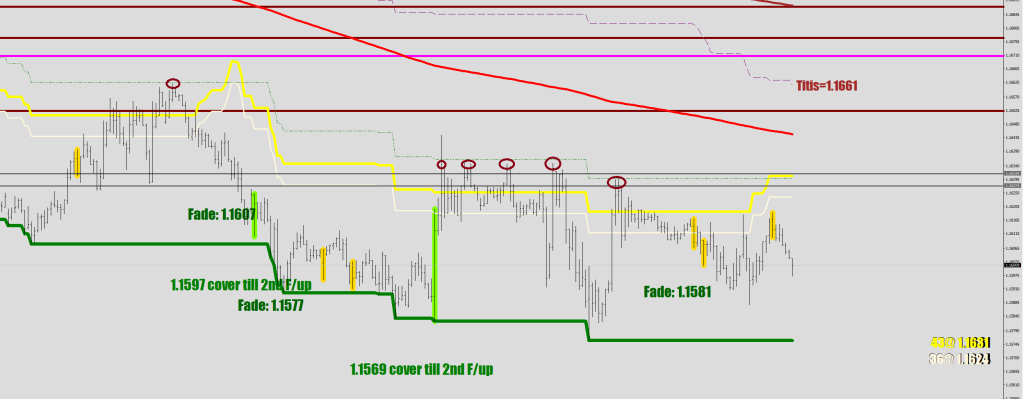
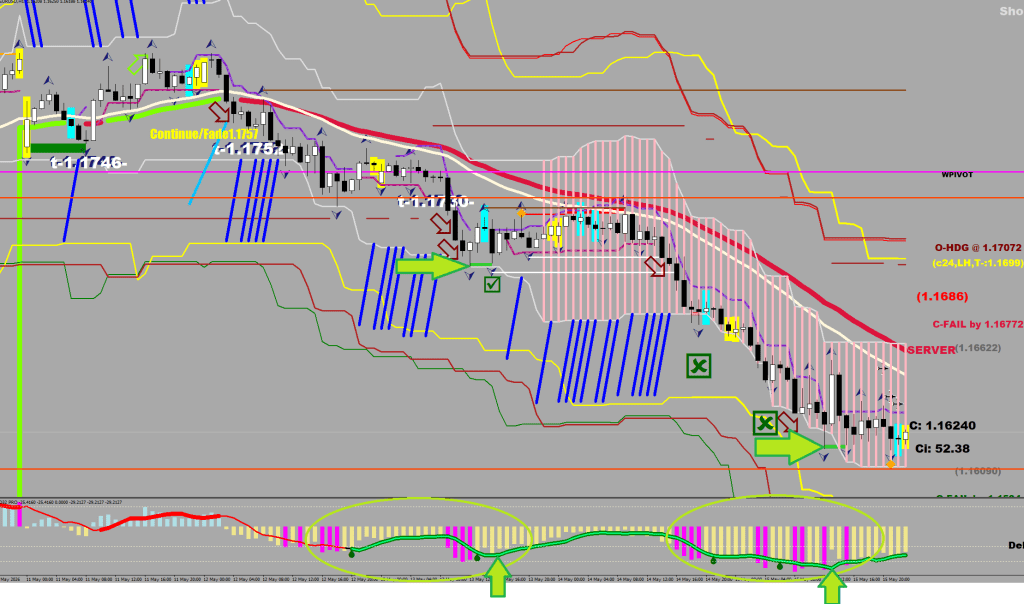
Where are we at?
I believe there are two, maybe 3 more lower lows that are missing.
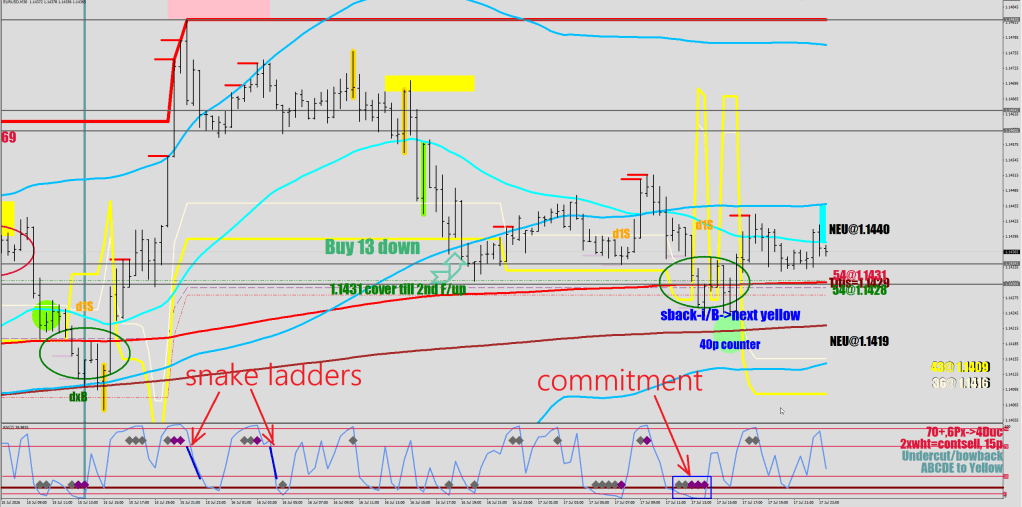
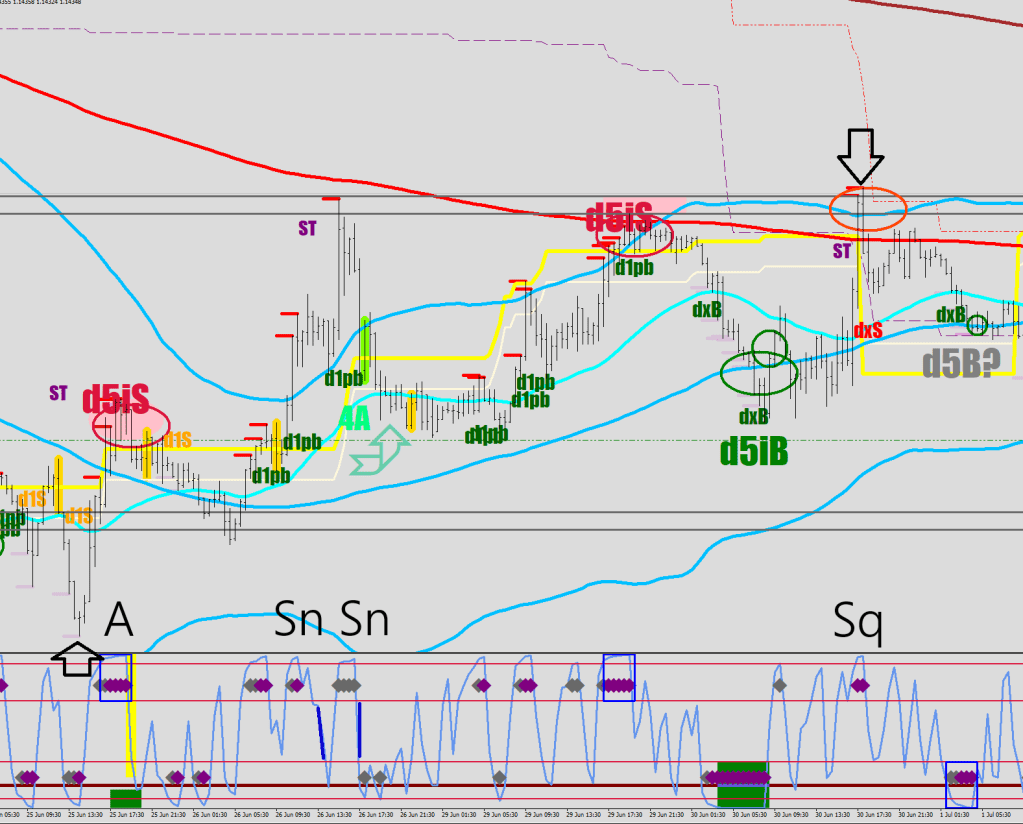
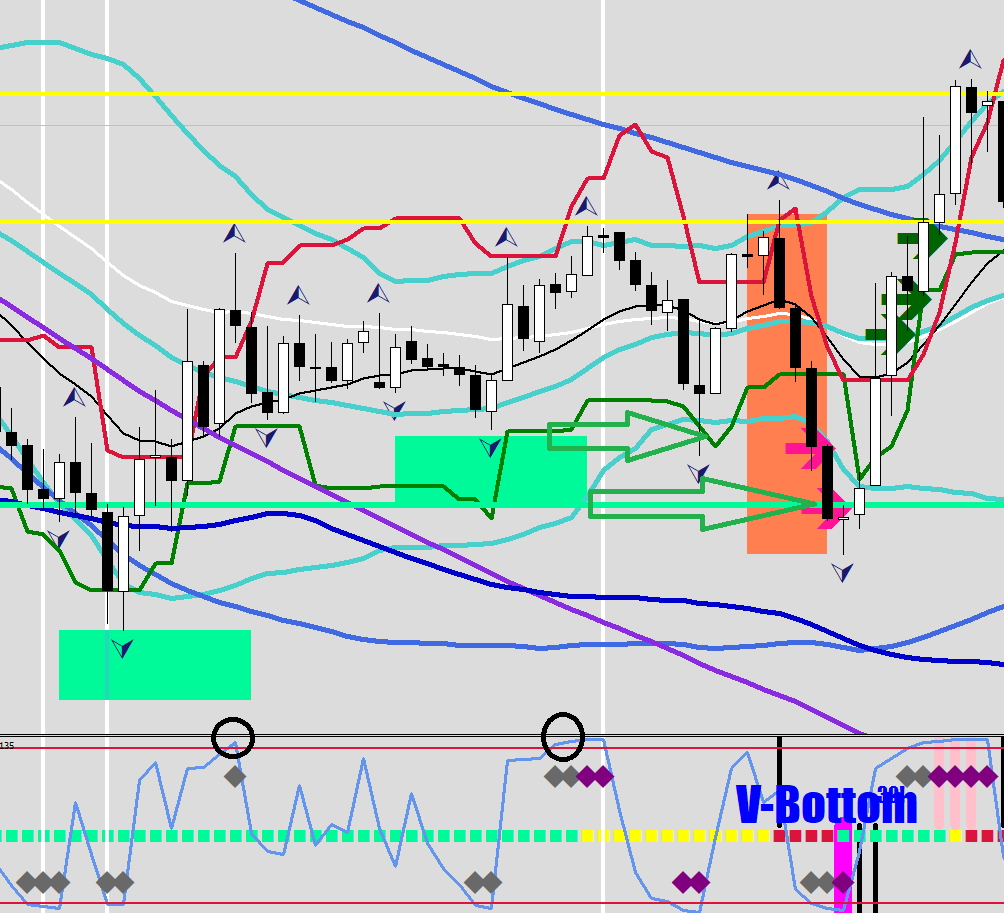
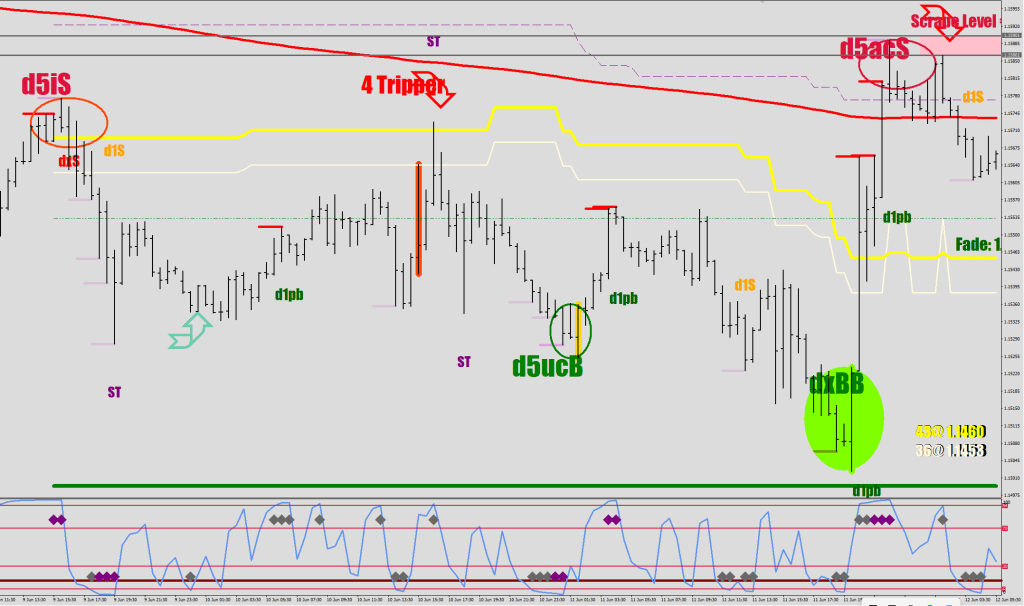
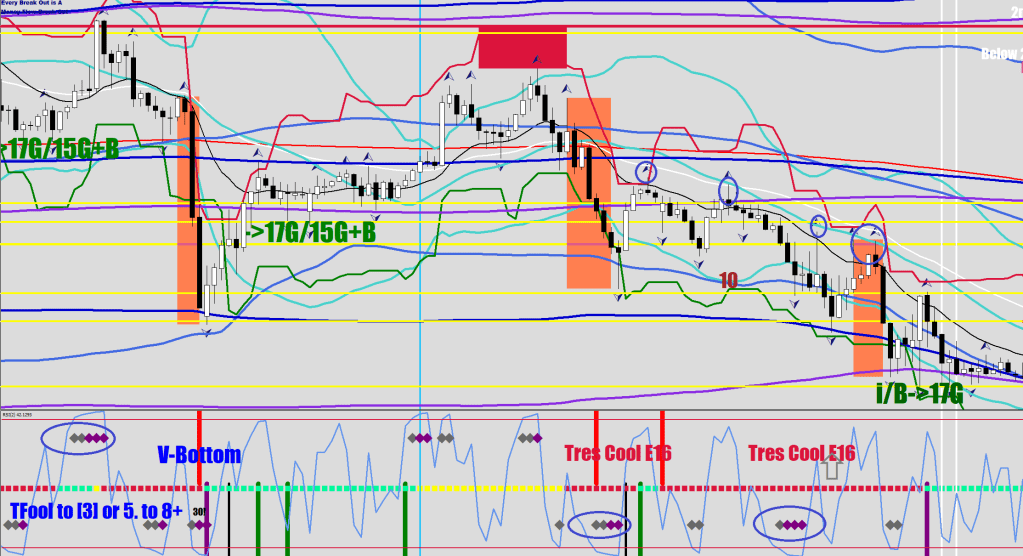
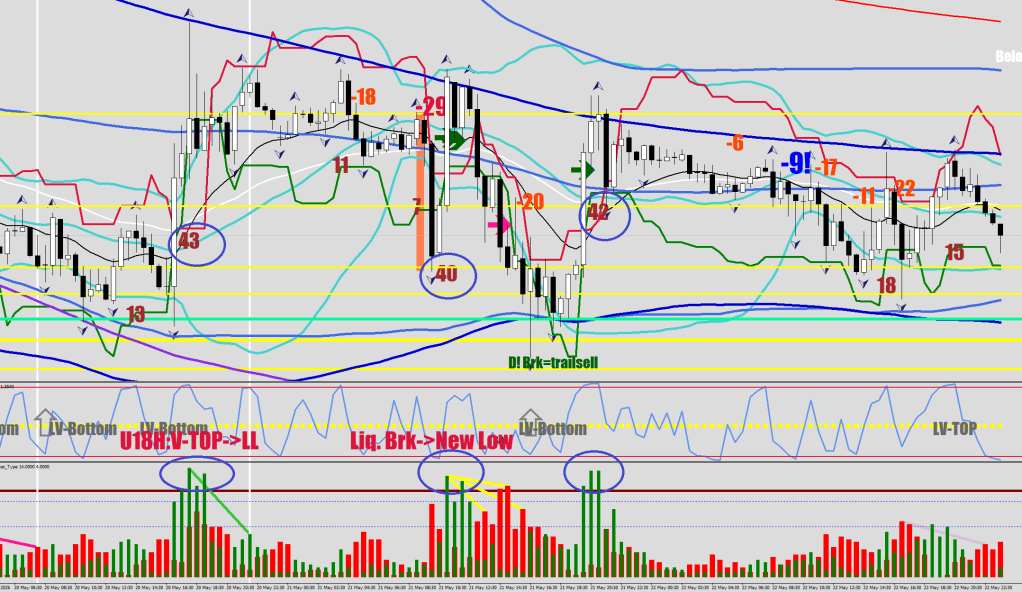
As a reminder, the End-Of-Wave sequence (a symptom of a healthy, trending market) is made up of a failed auction, two snake ladders, and some squirt (not always present).
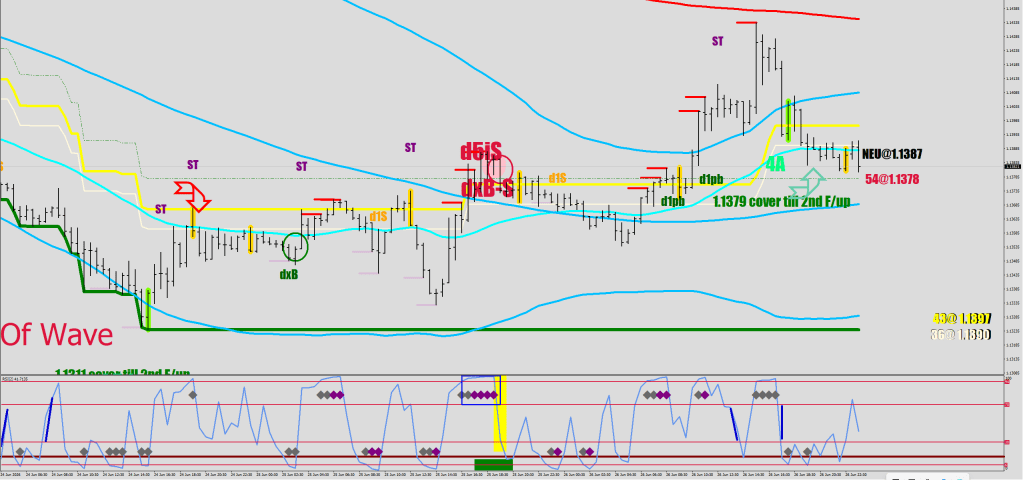
Next up, a comparison of two end-of-wave sequences, where the squirt was a shortfall, and so was the peak before the second ladder.
With this kind of End-Of-Wave sequence, it is the hardest to put on adequate volume for the reversal, as there is no higher high getting made, and scaling in does not have a defined, narrow range.
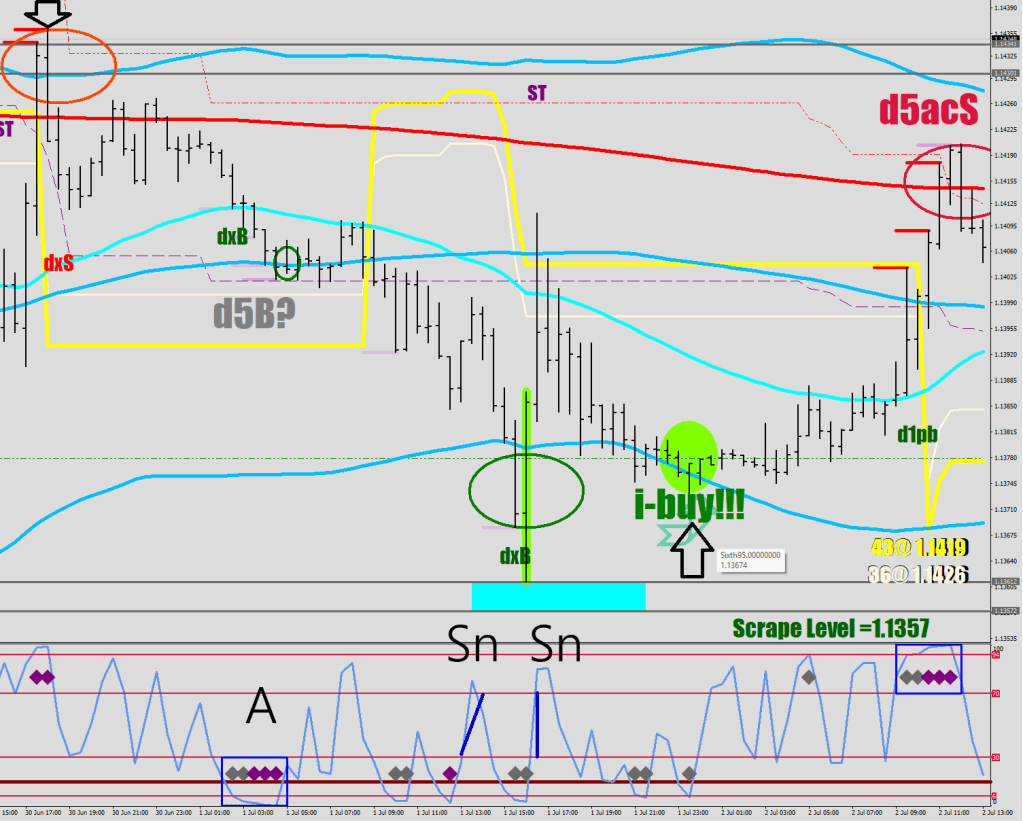
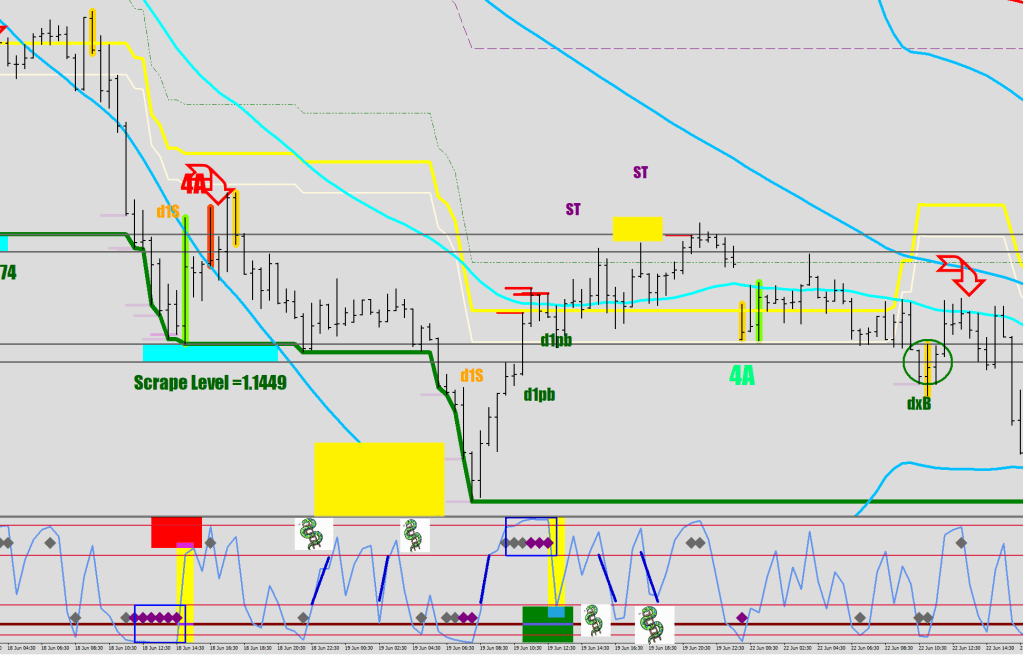
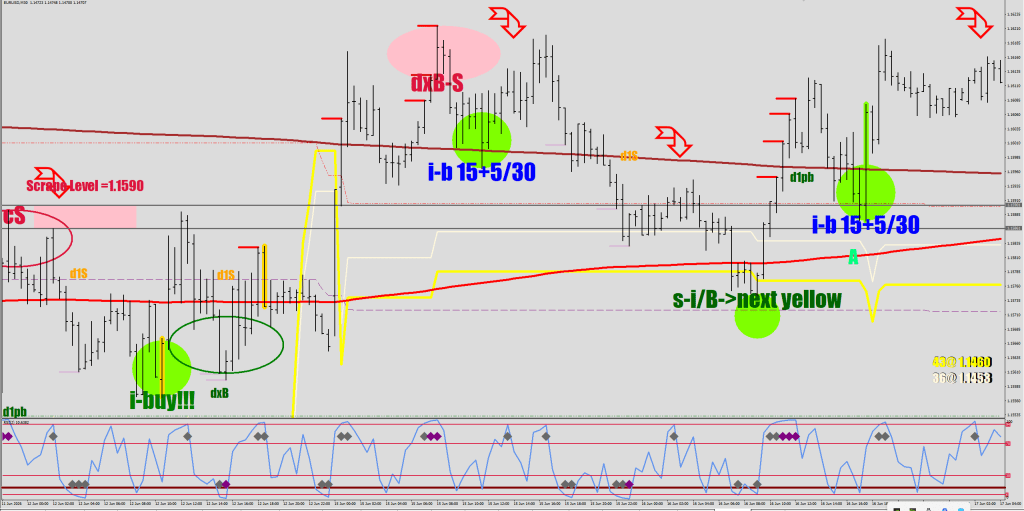
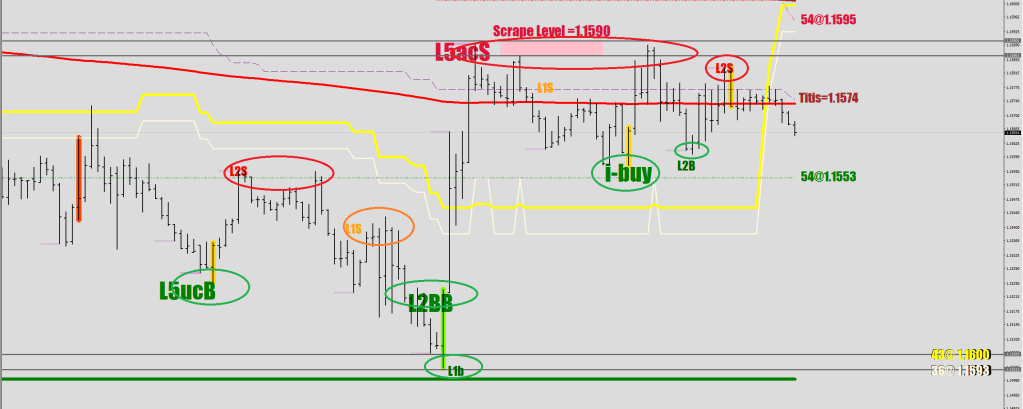
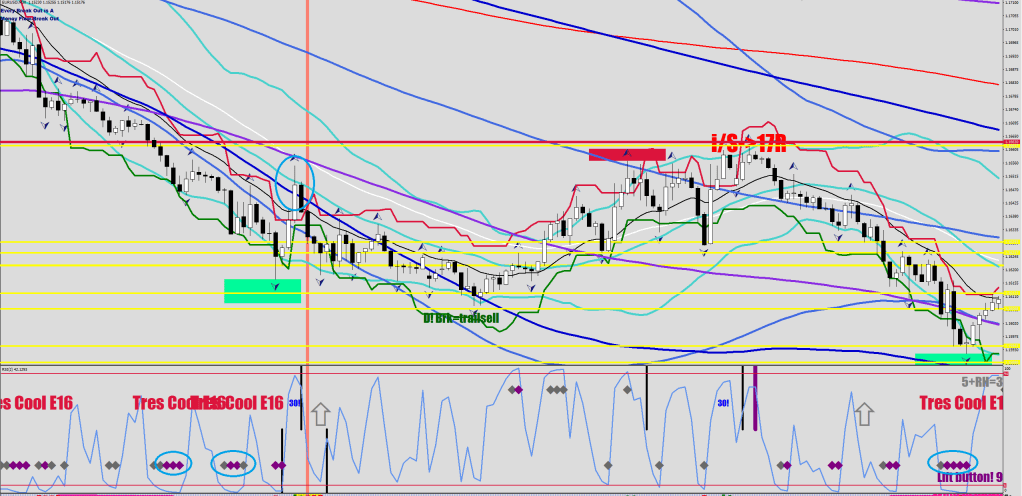
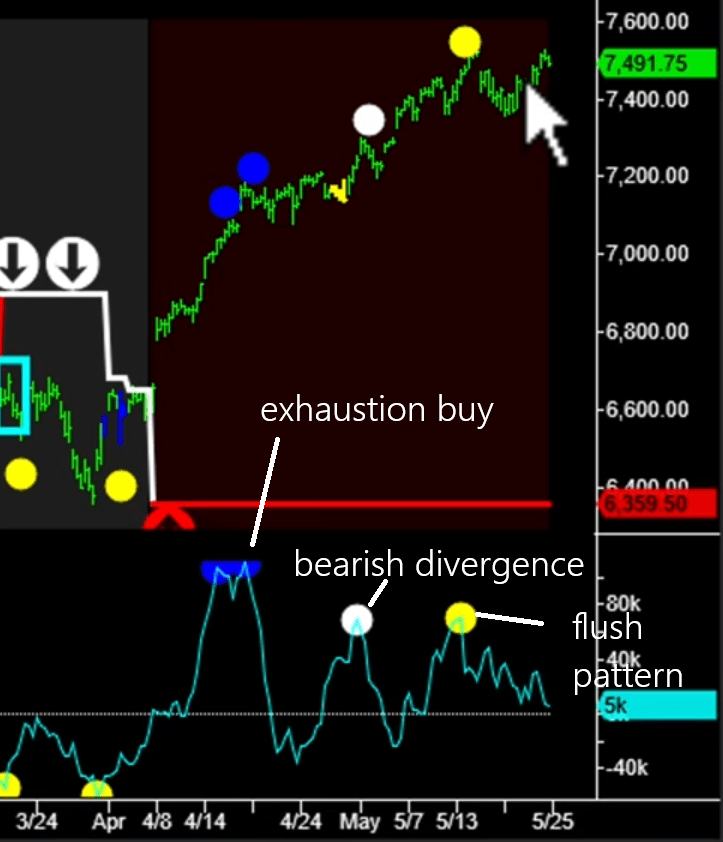
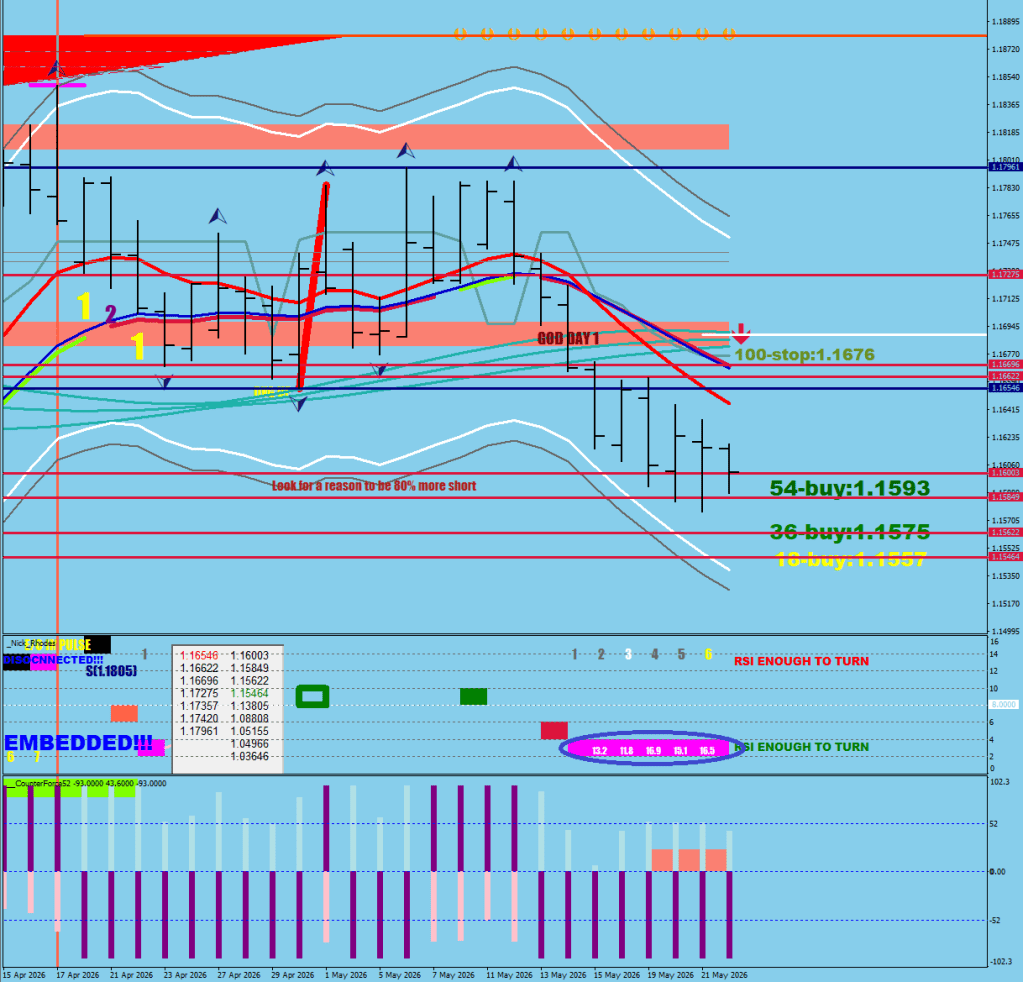
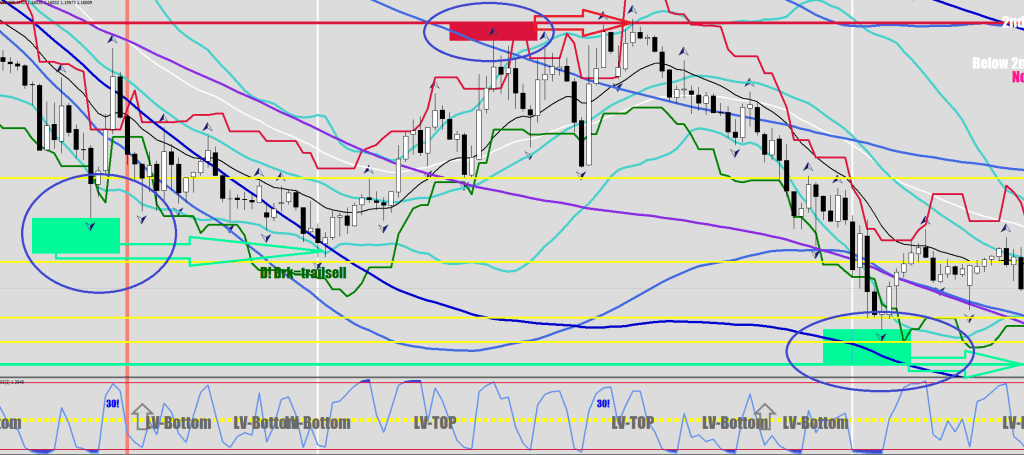
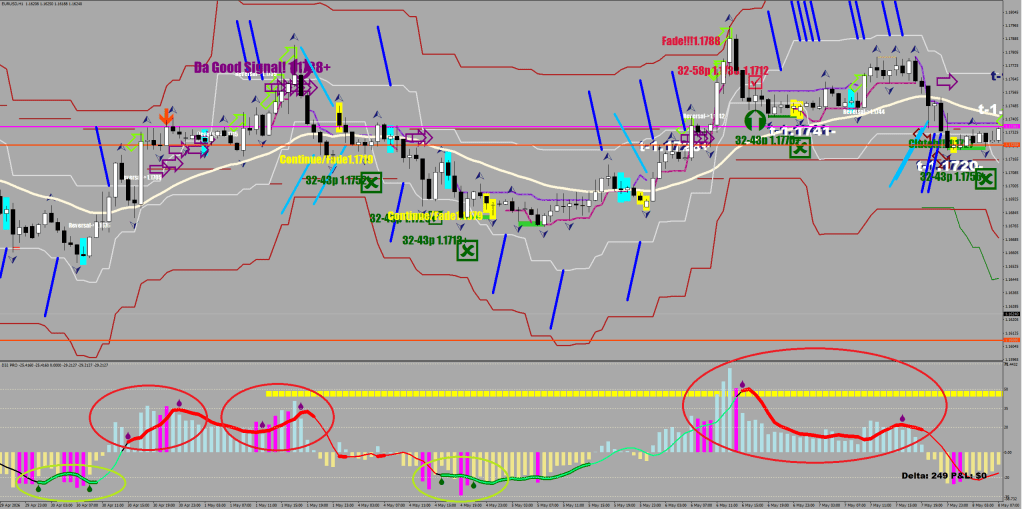
Earlier example:
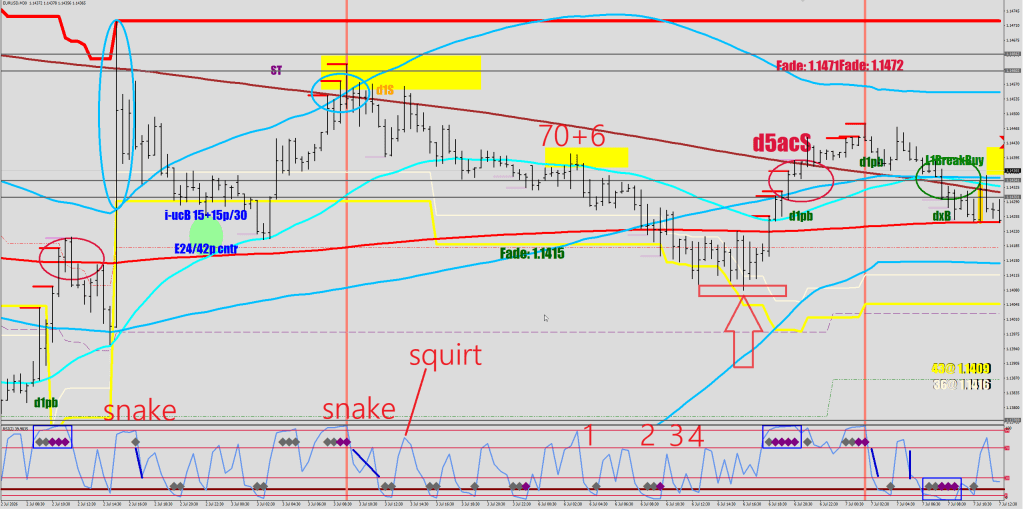
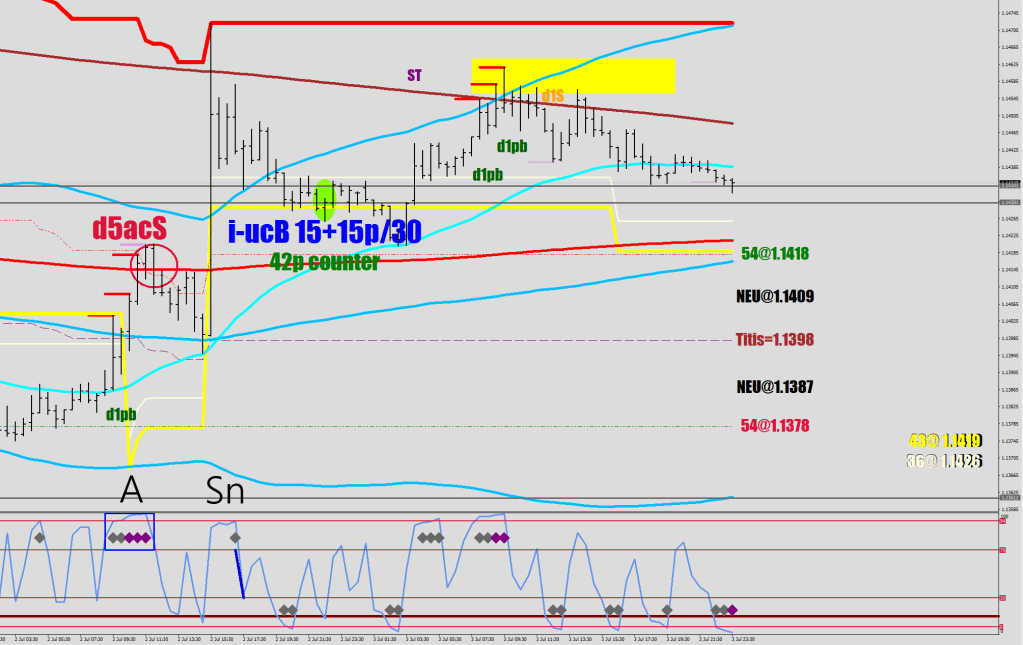
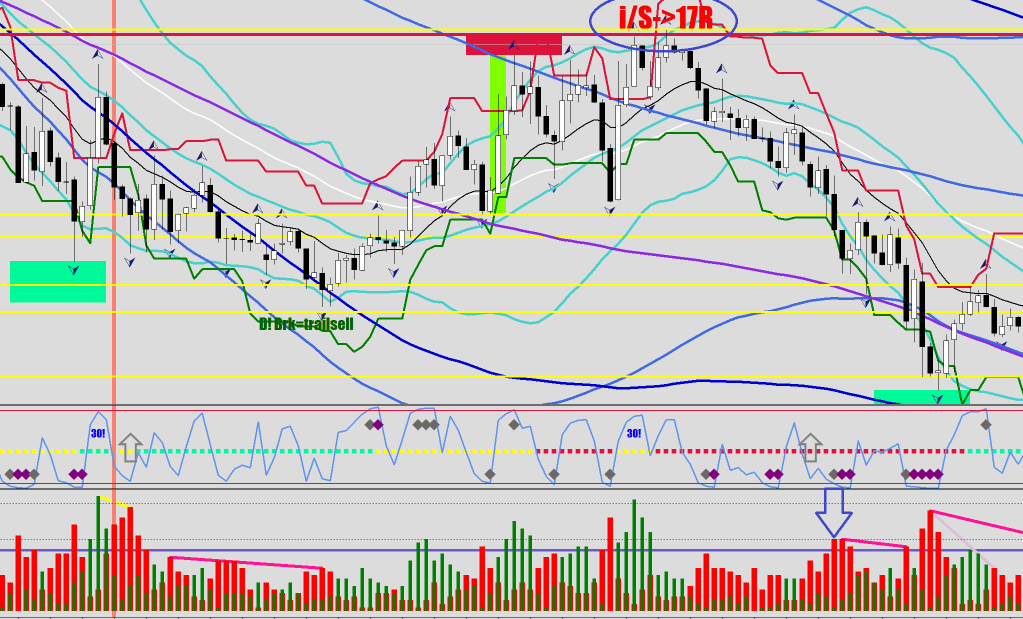
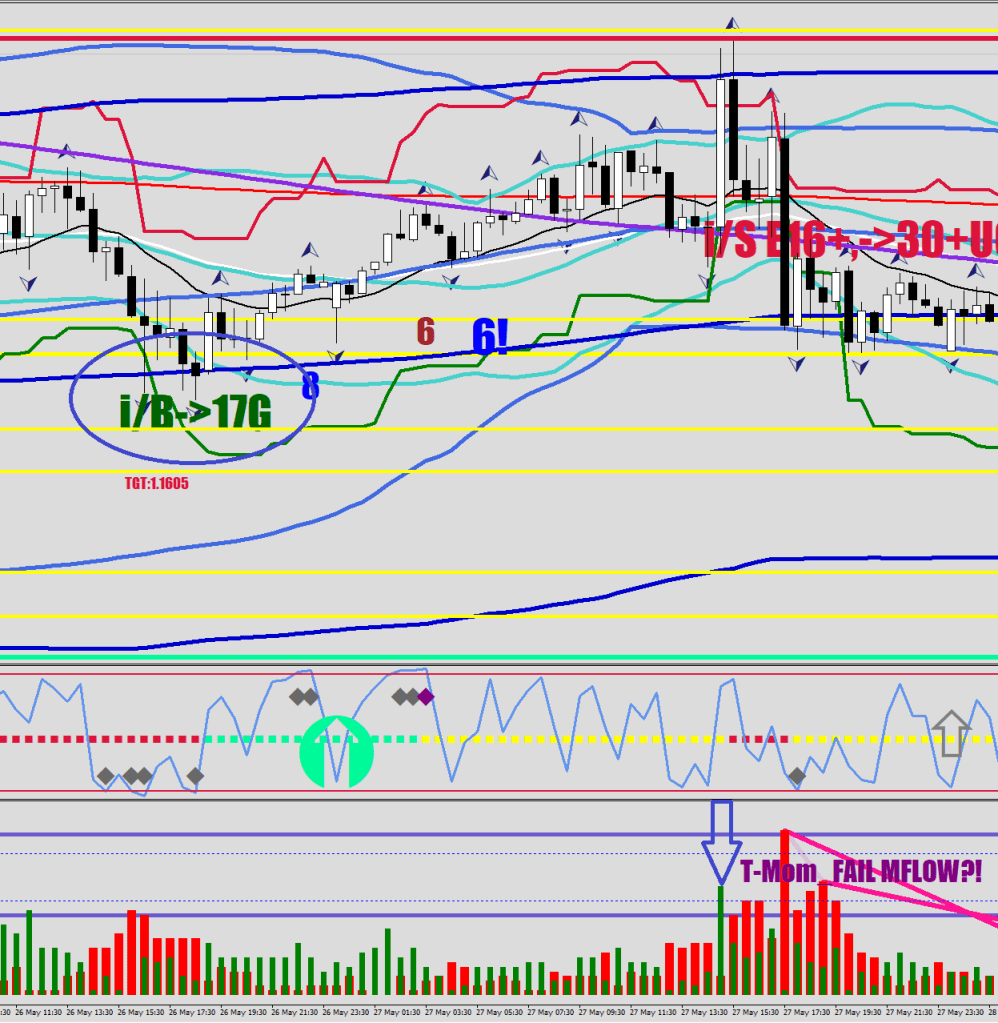
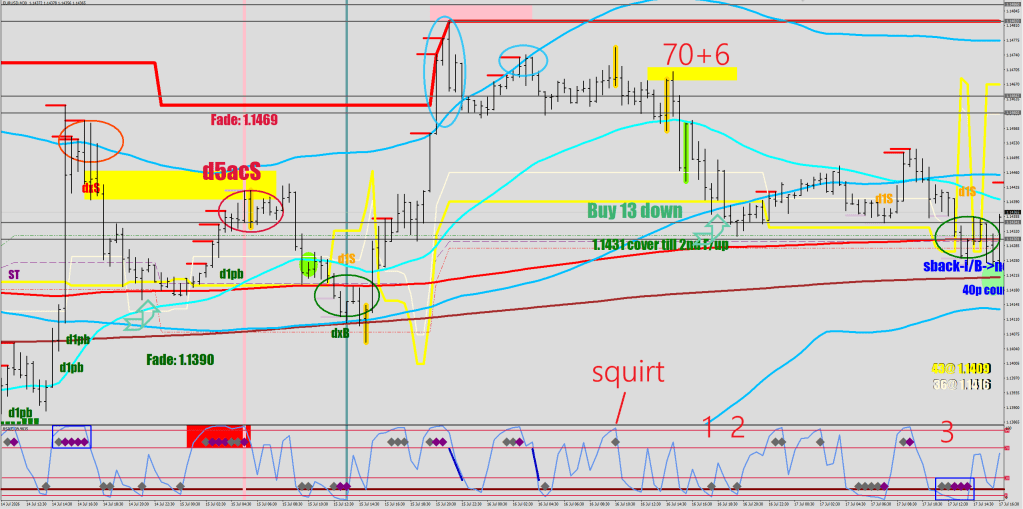
Now, compared to this previous example that I had, where the breakout also went parabolic (way outside the 120BB), the second high was capped by the 120 BB itself (second blue oval), and there was one squirt. The tiny twist on the current one is that the squirt wasn’t coming from next to the E44, but much earlier, and it did manage to beat the first lower high. About the 70+6 4D chess later.
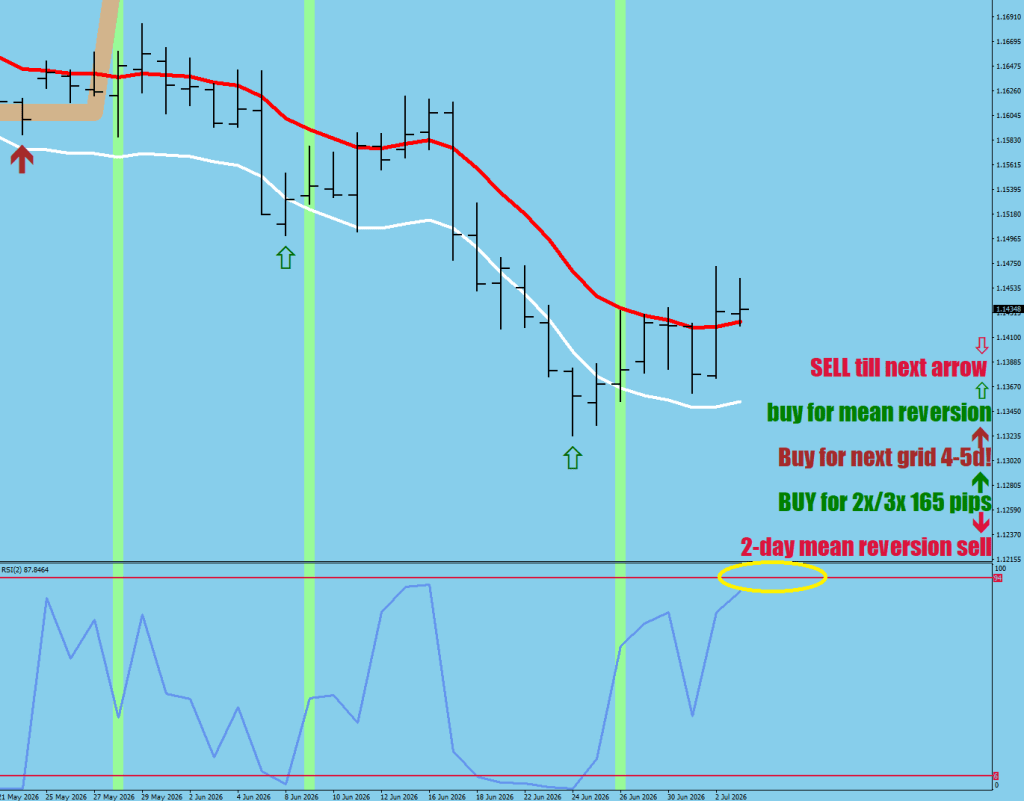
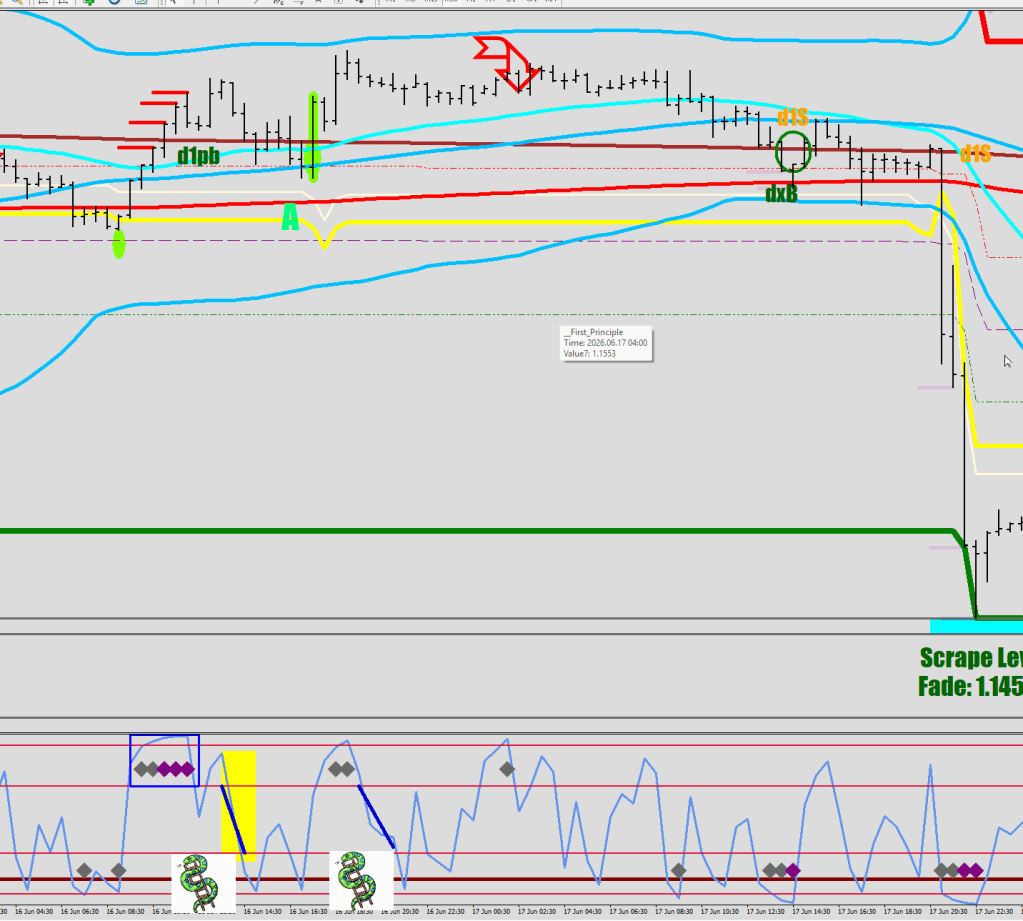
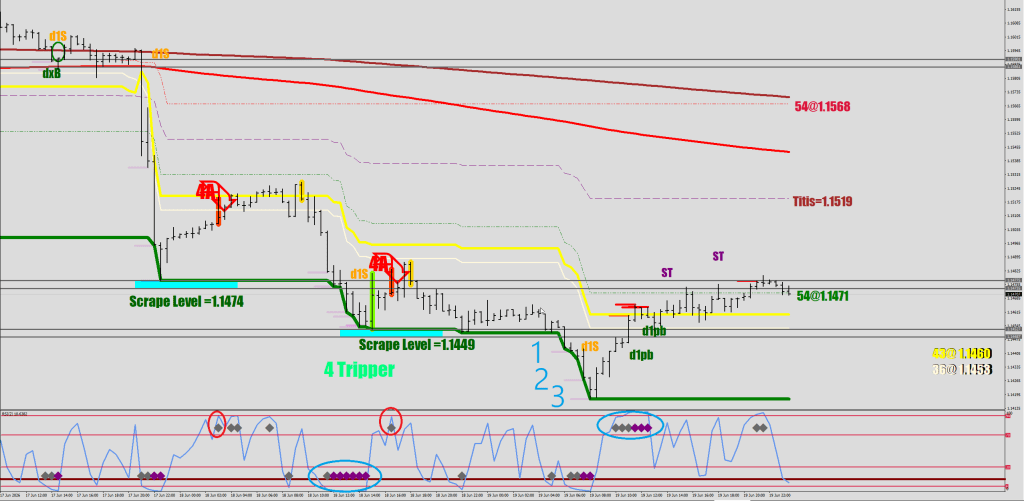
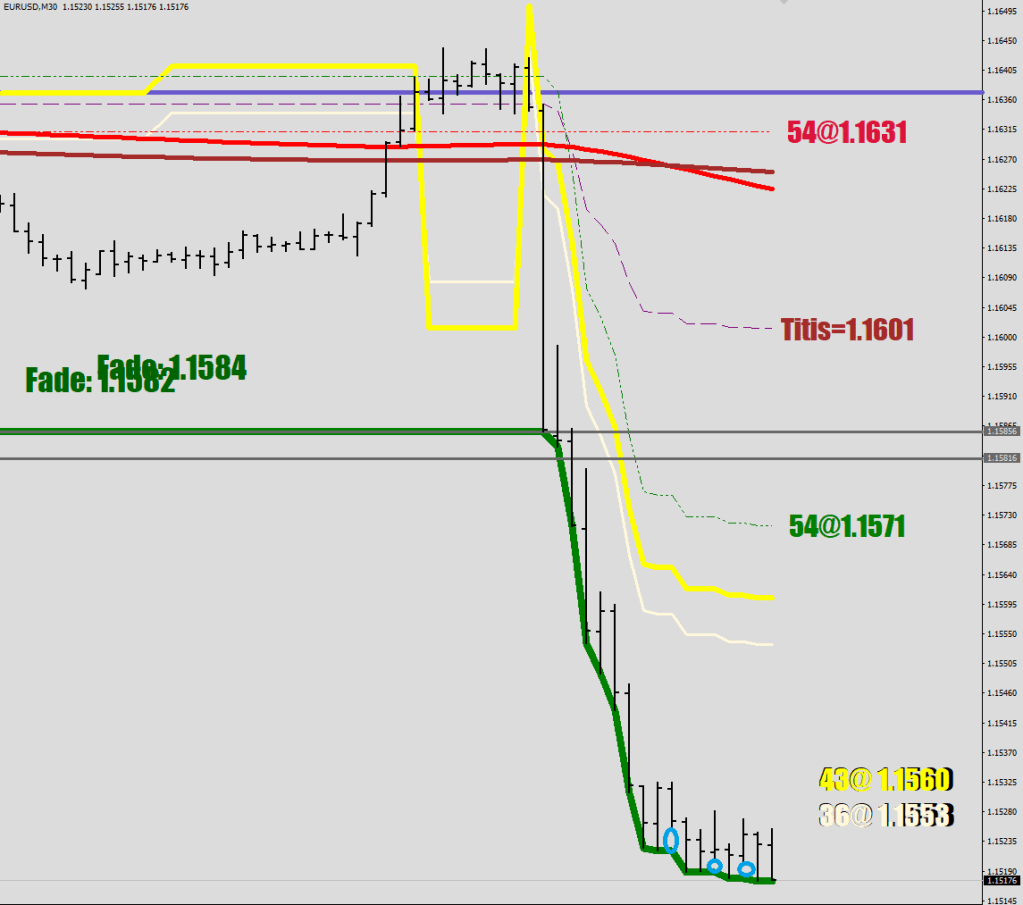
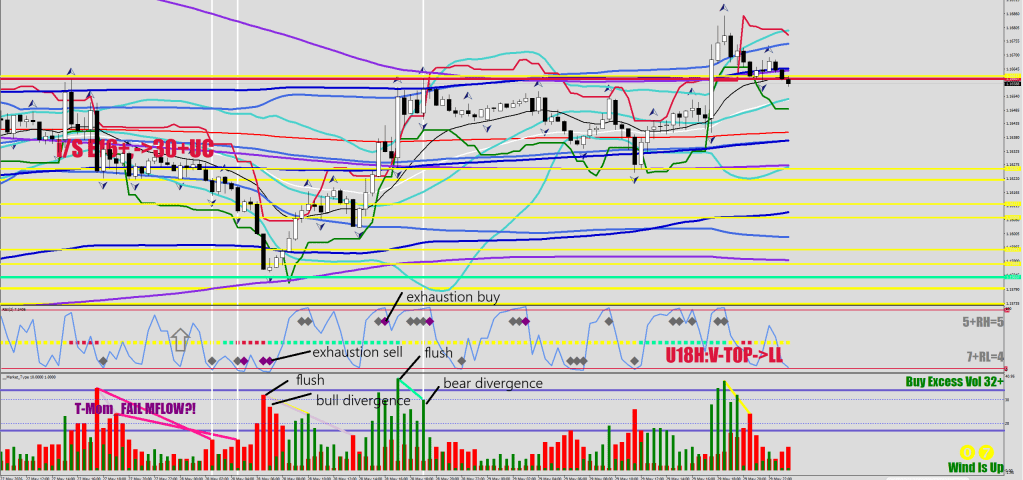
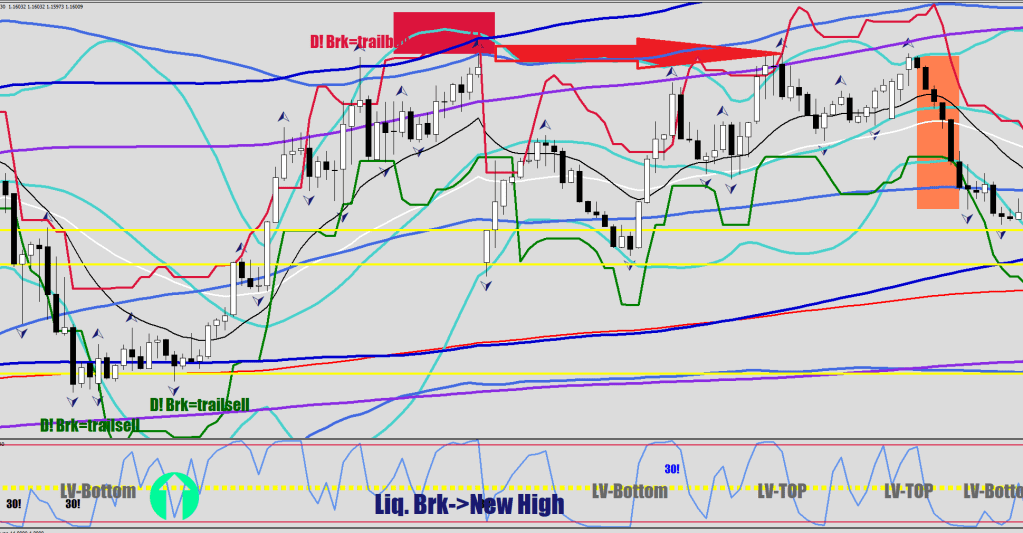
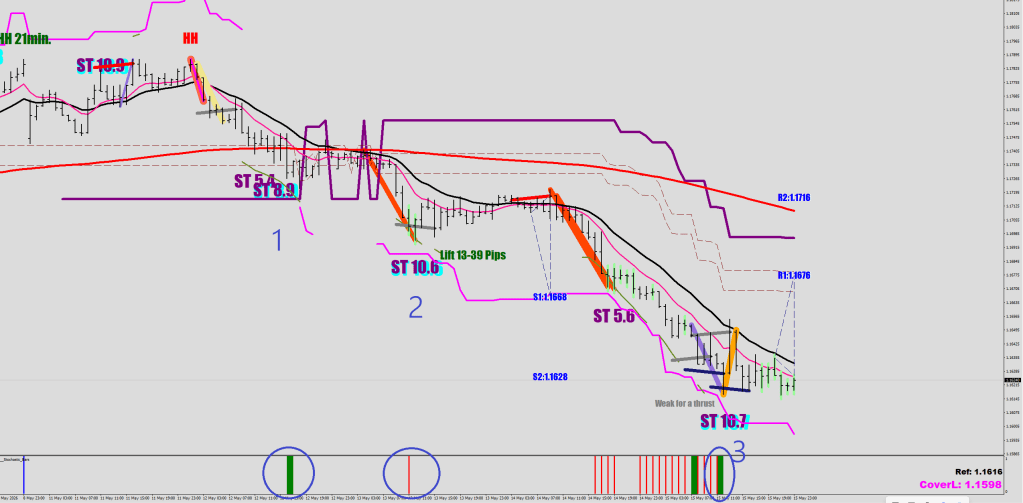
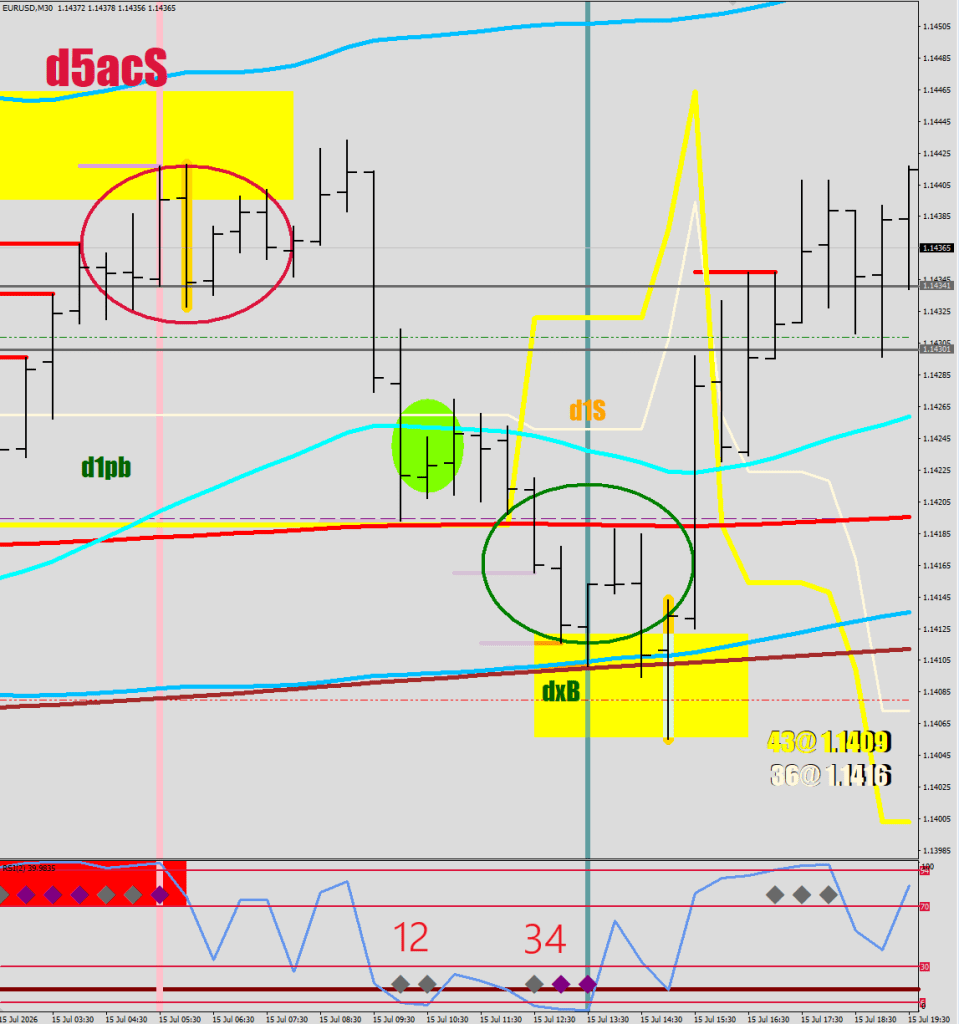
While on the upside, I’m trying to count 3 waves up – i.e.:
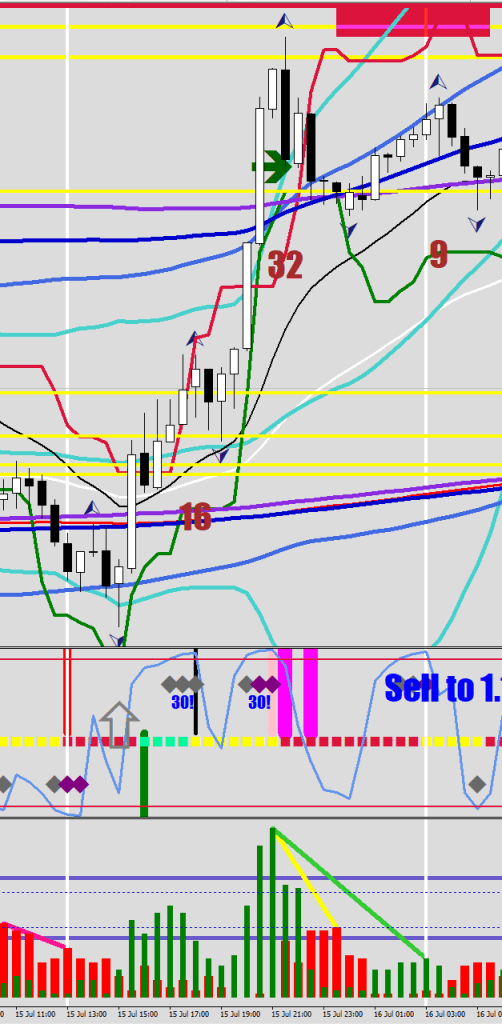
Every black candle was a close of a leg up.
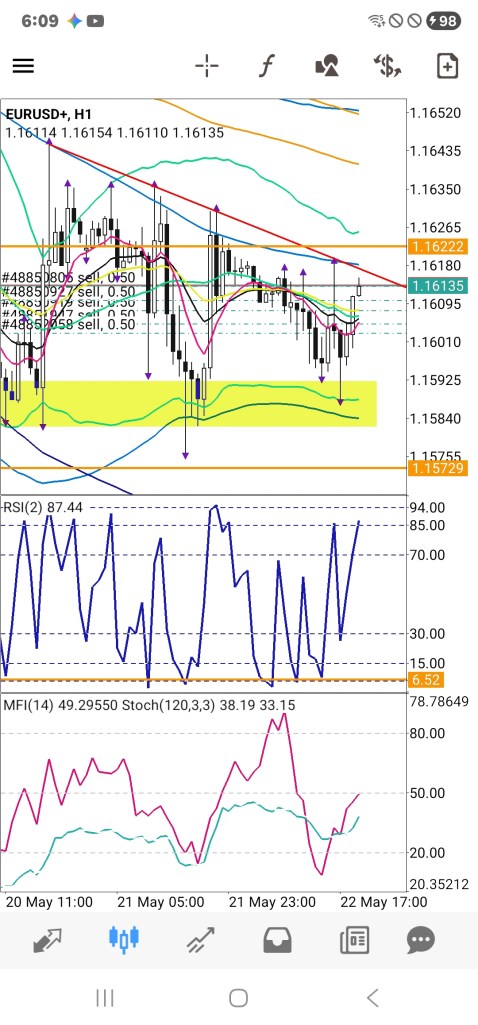
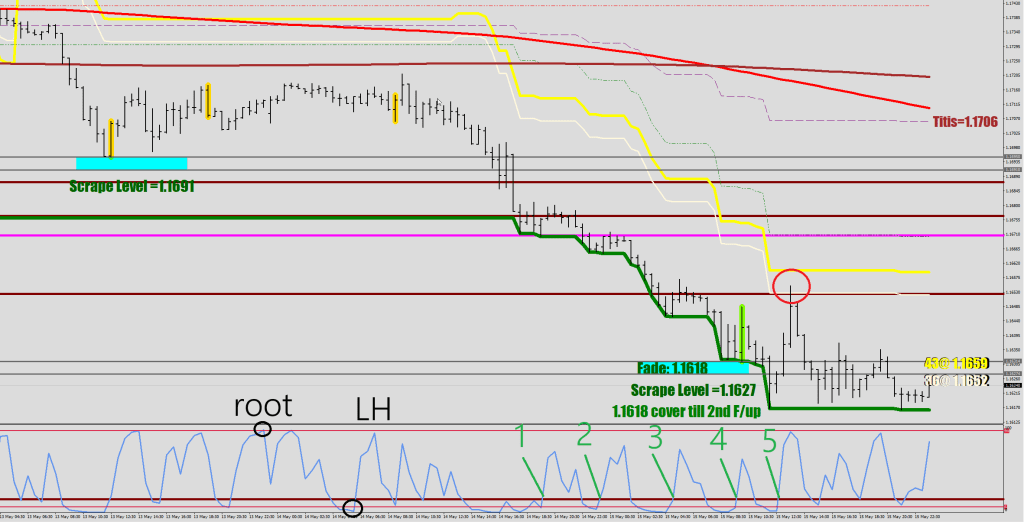
On the downside, I am looking for 4 RSI2 extreme dips and a slight undercut of the 4th. 4D stands for 4 diamonds.
70+6 means 70+ for an RSI2 peak, the 6 is up to 6 pips of a beat, the low risk entry (yellow square) that sets off a low-extremes counter.
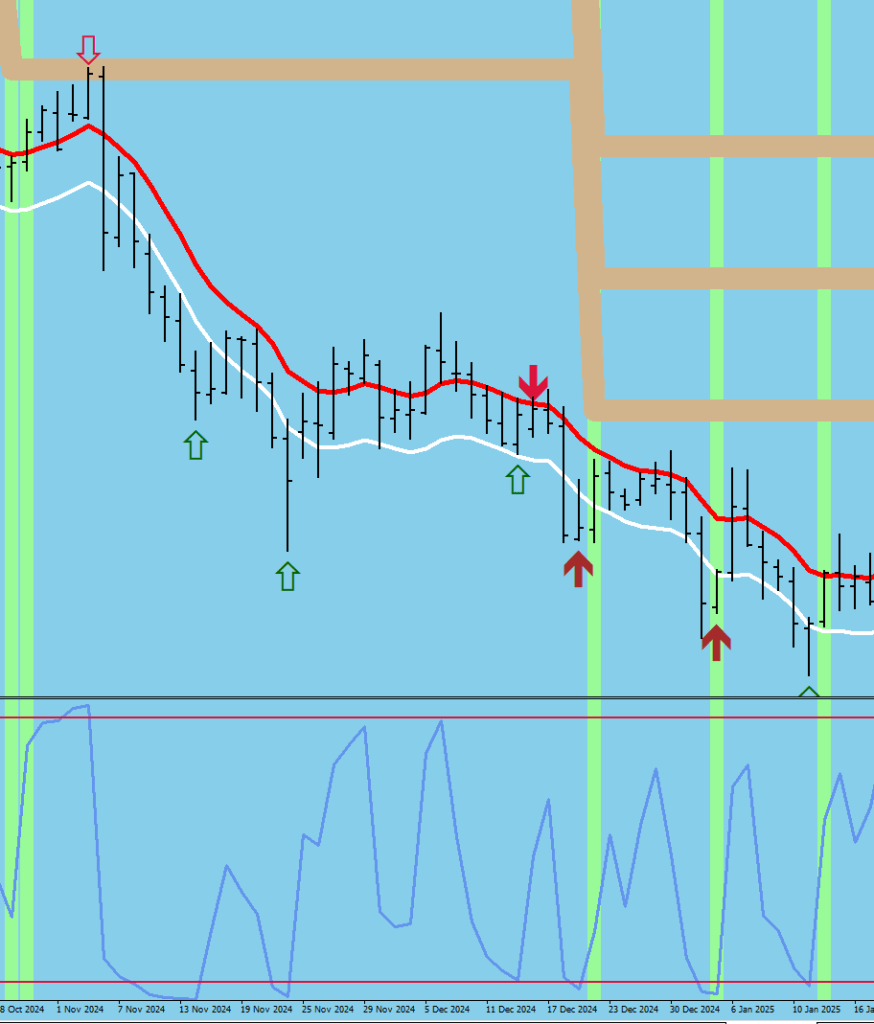
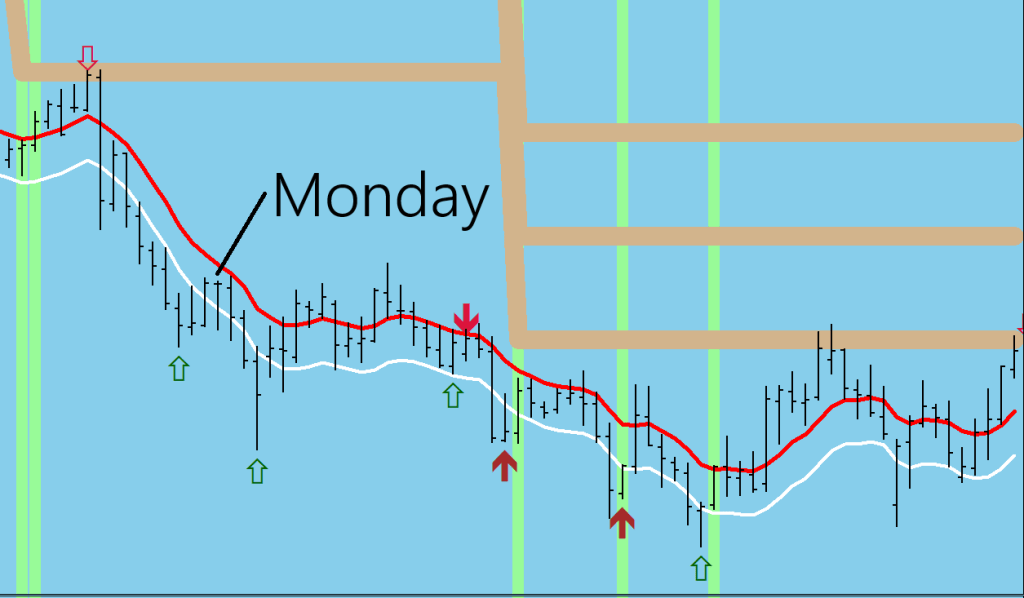
Bonus material: some of the dumbstruck markers=unhookings (vertical lines).
///Unhooking upside
  if (RSI2[i]<85 && RSI2[i+1]>98 && RSI2[i+2]>98 && RSI2[i+3]>92.5 && High[i+1]>iMA(symbol,0,414,0,MODE_EMA,PRICE_MEDIAN,i+1)
  && RSI2[i+5]>60 && RSI2[i+6]<80
 // && MFI14[i]>76
  )
  {
      ObjectCreate("PatusX"+IntegerToString(i),OBJ_VLINE,0, Time[i+1], 0);
      ObjectSet("PatusX"+IntegerToString(i), OBJPROP_COLOR, clrSalmon);
        ObjectSet("PatusX"+IntegerToString(i),OBJPROP_WIDTH,6);
      ObjectSet("PatusX"+IntegerToString(i),OBJPROP_BACK,1);
  }
  ///Unhooking down
  if (RSI2[i]>15 && RSI2[i+1]<2 && RSI2[i+2]<2
  //&& RSI2[i+3]<7.5
  && (RSI2[i+4]<2 || RSI2[i+4]>7.5)
  && Low[i+1]<iMA(symbol,0,414,0,MODE_EMA,PRICE_MEDIAN,i+1))
  {
      ObjectCreate("PatusX"+IntegerToString(i),OBJ_VLINE,0, Time[i+1], 0);
      ObjectSet("PatusX"+IntegerToString(i), OBJPROP_COLOR, clrCadetBlue);
        ObjectSet("PatusX"+IntegerToString(i),OBJPROP_WIDTH,6);
      ObjectSet("PatusX"+IntegerToString(i),OBJPROP_BACK,1);
  }
During the inside waves and when there is no commitment (no trend), the 4D is not the number of the deep dips, but the actual 30 minutes spent deeply oversold, meaning the actual diamonds.
Also, I have added a filter to the upside commitment; the RSI2 should not reach below 30 in the next 2 prints (RSI2[i-1]>30) – rather counterintuitive.
///failed auction up if (RSI2[i]<92.5 && RSI2[i+1]>92.5 && RSI2[i+2]>92.5 && RSI2[i+3]>92.5 && RSI2[i+4]>92.5 && RSI2[i+5]>92.5){ ObjectCreate("RayRect"+IntegerToString(i),OBJ_RECTANGLE,1, Time[i], 100, Time[i+6], 70); ObjectSet("RayRect"+IntegerToString(i),OBJPROP_COLOR,clrBlue); ObjectSet("RayRect"+IntegerToString(i),OBJPROP_WIDTH,3); ObjectSet("RayRect"+IntegerToString(i),OBJPROP_BACK,0); if (MFI14[i+1]>80 && MFI14[i+2]>80 && MFI14[i+3]>80 ) {ObjectSet("RayRect"+IntegerToString(i),OBJPROP_COLOR,clrOrangeRed); ObjectSet("RayRect"+IntegerToString(i),OBJPROP_BACK,1);} if (i>1 && (RSI2[i]<30 || RSI2[i-1]<30)) { ObjectCreate("RayRecta"+IntegerToString(i),OBJ_RECTANGLE,1, Time[i-1], 100, Time[i+1], 20); ObjectSet("RayRecta"+IntegerToString(i),OBJPROP_COLOR,clrYellow); ObjectSet("RayRecta"+IntegerToString(i),OBJPROP_WIDTH,3); ObjectSet("RayRecta"+IntegerToString(i),OBJPROP_BACK,1); ObjectCreate("RayRectb"+IntegerToString(i),OBJ_RECTANGLE,1, Time[i-2], RSI2[ArrayMinimum(RSI2,3,i-2)], Time[i+4], 0); ObjectSet("RayRectb"+IntegerToString(i),OBJPROP_COLOR,clrGreen); ObjectSet("RayRectb"+IntegerToString(i),OBJPROP_WIDTH,3); ObjectSet("RayRectb"+IntegerToString(i),OBJPROP_BACK,1); } } ///CANNIBAL auction up if ((RSI2[i]<92.5 && RSI2[i+1]>92.5 && RSI2[i+2]>92.5 && RSI2[i+3]>92.5 && RSI2[i+4]>92.5 && RSI2[i+5]>92.5 && RSI2[i+6]>92.5 && RSI2[i+7]>92.5 && RSI2[i+8]>92.5) || (RSI2[i]<85 && RSI2[i+1]>98 && RSI2[i+2]>98 && RSI2[i+3]>98 && RSI2[i+4]>98 && RSI2[i+6]<92 && i>0 && RSI2[i-1]<40) || (RSI2[i]<85 && RSI2[i+1]>98 && RSI2[i+2]>92.5 && RSI2[i+3]>92.5 && RSI2[i+4]>92.5 && RSI2[i+5]>98) ){ ObjectDelete("RayRect"+IntegerToString(i)); ObjectDelete("RayRecta"+IntegerToString(i)); ObjectDelete("RayRectb"+IntegerToString(i)); ObjectCreate("RayRect"+IntegerToString(i),OBJ_RECTANGLE,1, Time[i], 100, Time[i+10], 70); ObjectSet("RayRect"+IntegerToString(i),OBJPROP_COLOR,clrRed); ObjectSet("RayRect"+IntegerToString(i),OBJPROP_WIDTH,3); ObjectSet("RayRect"+IntegerToString(i),OBJPROP_BACK,1); if (i>0 && RSI2[i-1]>30){ ObjectCreate("PatusX"+IntegerToString(i),OBJ_VLINE,0, Time[i+1], 0); ObjectSet("PatusX"+IntegerToString(i), OBJPROP_COLOR, clrPink); ObjectSet("PatusX"+IntegerToString(i),OBJPROP_WIDTH,8); ObjectSet("PatusX"+IntegerToString(i),OBJPROP_BACK,1);} }
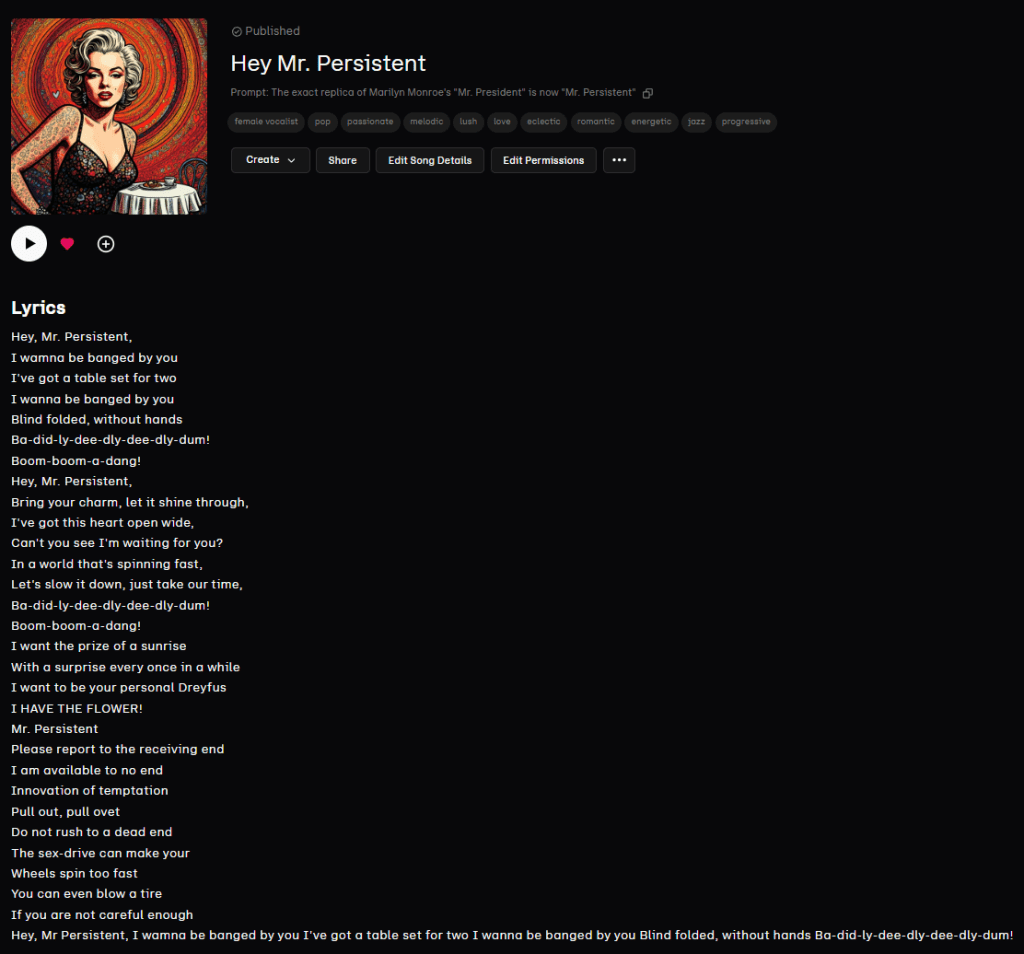
3000-View special.
A remark here is that a song’s quality is never objective. I used to listen to a song every day, Eric Lemon’s remix of a Dave Gahan presentation. I don’t recall ever having issues with the quality.
Recently, I came across it again. I had to check if the song was re-uploaded with a slower bitrate. It was poor. Most of my songs have way better quality than this.
Conclusion: things that you like get a quality upgrade from your mind.
What an IQ test?
When I was young, this was making the rounds. It was attributed to Einstein.
Sit down and measure your time. I’ll tell you how long I took next week.
TEST
There are 5 houses, each with a different color.
There is one tenant in each, and they all have different nationalities.
They all consume different kinds of liquids, smoke different kinds of cigarettes, and have different pets.
- The Brit lives in the red house.
- The Swede has a dog.
- The Danish person drinks tea.
- The green house is on the left of the white house.
- The tenant of the green house drinks coffee.
- The person who smokes Pall Mall has a bird.
- The tenant of the yellow house smokes Dunhill.
- The tenant in the middle house drinks milk.
- The Norwegian lives in the first house.
- The person who smokes Blend keeps a cat.
- The person who has a horse lives next to the Dunhill smoker.
- The person who smokes Blue Master is a beer drinker.
- The German smokes Prince.
- The Norwegian lives next to the blue house.
- The Blend smoker lives next to the person who drinks water.
Question: Which person has a pet fish?
I made 2 new Spandaul Ballet-like songs recently, boosting the collection to 5.