
A start of a conversation with the daily volatility trends / changes.
So the plots are the previous 3 days’ ATR in pips in gray, and if the current day exceeds this level, the paint over is gold.
ExtATRBuffer[i]= ((High[i+1]-Low[i+1]+High[i+2]-Low[i+2]+High[i+3]-Low[i+3])*10000/3);
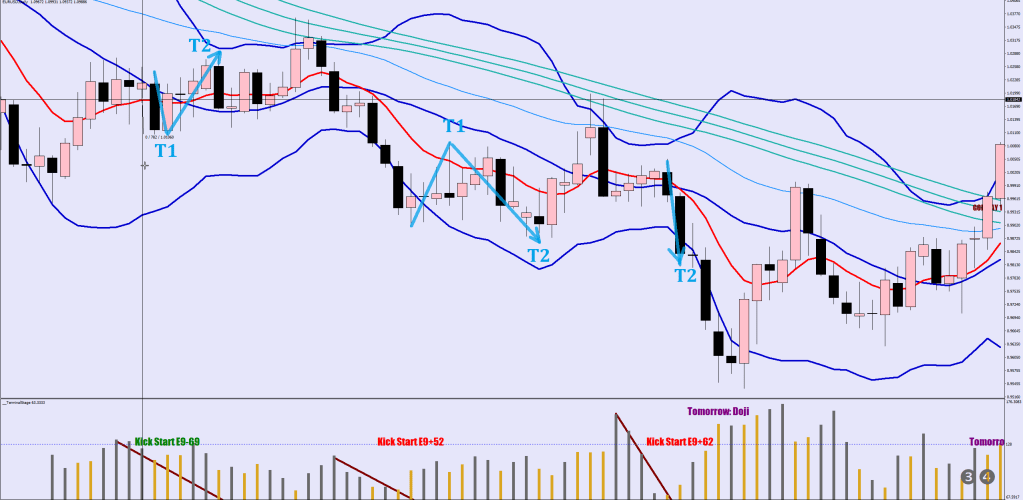
if ((High[i]-Low[i])*10000>ExtATRBuffer[i]) ExtATRBuffer2[i]=ExtATRBuffer[i];As a Stage 1, we notice a contracting volatility sequence of 4+ days that is broken by a step up golden volatility stick (the one after the drawn brown slanted lines),
How could this sequence be utilized for a tradeable signal?

My thinking is that a new leg is going to come start from beyond the 9-day EMA (HL2 – in red) with some displacement and then the market would engage in challenging the daily Bollinger Band. No guarantee that it would get there, but it should give it its best shot and make a lower low / higher high for sure.
  if (i>0 && ExtATRBuffer2[i]!=EMPTY_VALUE && ExtATRBuffer[i]>ExtATRBuffer[i+1] && ExtATRBuffer[i+1]<ExtATRBuffer[i+2] && ExtATRBuffer[i+2]<ExtATRBuffer[i+3] && ExtATRBuffer[i+3]<ExtATRBuffer[i+4]) {
    ObjectCreate("Leap"+i,OBJ_TEXT, indicator_window, Time[i], 138);
   if (Close[i+4]<iMA(symbol,0,9,0,MODE_EMA,PRICE_MEDIAN,i+4)) ObjectSetText("Leap"+i, "Kick Start E9+"+DoubleToStr(ExtATRBuffer[ArrayMaximum(ExtATRBuffer,4,i)]/1.9,0), 19, "Impact", clrRed);
   else ObjectSetText("Leap"+i, "Kick Start E9-"+DoubleToStr(ExtATRBuffer[ArrayMaximum(ExtATRBuffer,4,i)]/1.9,0), 19, "Impact", clrGreen);
 }
So there is a call point first that may not have been reached yet, call it target 1 and a target 2.
You know, for starters. There has been a 4+ day volatility drop.
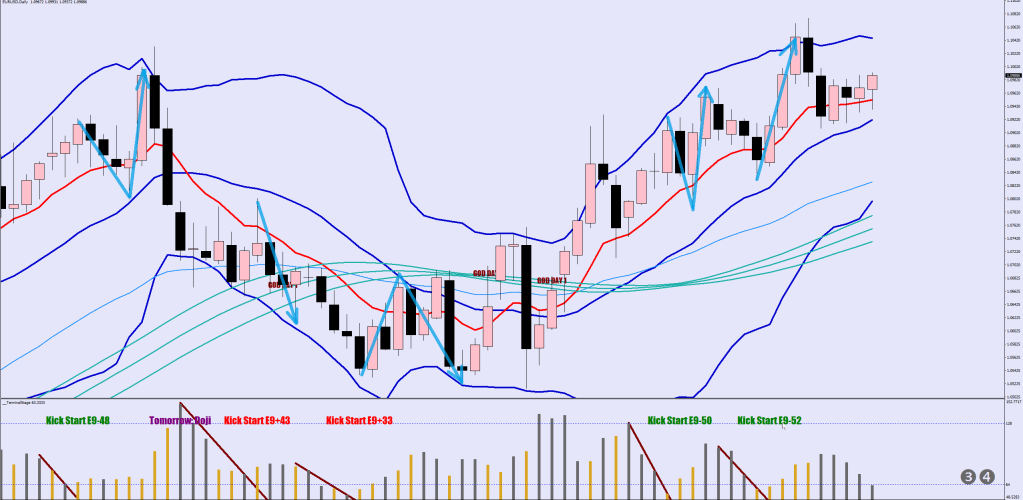
A golden prompt (if the logic still stands, since the 4th canle back was a close above the E9) would call for a buy again at a new low below 1.0910 (just below the S20) for another run for the upper Bollinger.

