
(may be useful even without links)
There is a lot to get lost in, but I would not start with candles.
I would look at videos from the Stoic Trader first and perhaps some We Trade Waves videos tho get a feel for pivots and consolidations/continuations as well as how market makers drive the price to obtain more liquidity (margin calls = money flowing to the broker either from the trader’s equity or from new deposits). You can try Fx Pip Collector, but do not get too deep into Elliott Wave.
Elliott Wave Options deals with some additional TA, I watch Ron Walker’s The ChartPatternTrader (DeMark counts & divergences) and Mike Jones trading for some additional info.
Northman Trader is best to get a grasp on volatility compressions and higher timeframes & moving averages.
As for candles, I find dojis very important for targets & fake outs and there are some candle combos that are great hints such as the 3 marching soldiers. Dojis are often sophisticated accumulations for larger volume.
Bulkowski has a web page about chart patterns and the 3 domes and the house on the peak and its brother are recurring themes.
The flat top – drop idea is from Oscar Carboni.
You already know that I am a moving averages guy, I give lots of credit to the hourly metric and I count closes / separations relative to the 8-hour EMA of opens.

The ink hasn’t dried on the echo, but for now price fell shy of the Check Point 1. The 3 numbers on the bottom rights are the “home” candidates for a market staying bullish. For a more sideways market, the lower red line comes in play.

The last sell call came with a moratorium of 30 pips. Again, just shy.
I now plot the numbers up to 8, within 8 the Gear must be decided for or something else is cooking.
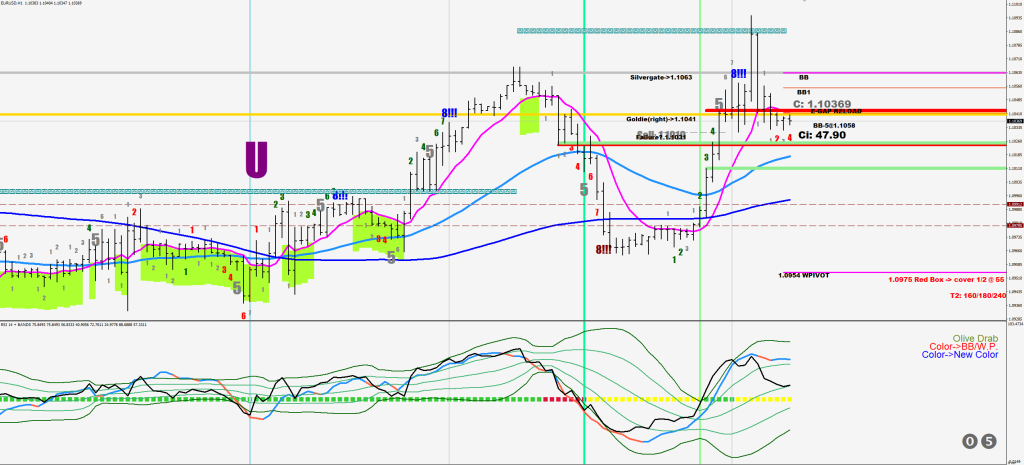
Looks like they want every bit of liquidity they can get.

A close below 1.0880 would be an indication of leaving this zone.
