A quick lesson on why quick lessons are important.
Apply the new filer changes & zoom out.
if (High[i]>iBands(symbol,0,216,1.8,0,PRICE_MEDIAN,MODE_UPPER,i) && (iBands(symbol,0,30,2,0,PRICE_MEDIAN,MODE_UPPER,i)-iBands(symbol,0,30,2,0,PRICE_MEDIAN,MODE_LOWER,i)>1100*Point || Low[i]>iBands(symbol,0,30,2,0,PRICE_MEDIAN,MODE_UPPER,i)) && ExtATRBuffer3[i]>0) ExtATRBuffer4[i]=ExtATRBuffer3[i];
 if (Low[i]<iBands(symbol,0,216,1.8,0,PRICE_MEDIAN,MODE_LOWER,i) && (iBands(symbol,0,30,2,0,PRICE_MEDIAN,MODE_UPPER,i)-iBands(symbol,0,30,2,0,PRICE_MEDIAN,MODE_LOWER,i)>1100*Point || High[i]<iBands(symbol,0,30,2,0,PRICE_MEDIAN,MODE_LOWER,i)) && ExtATRBuffer3[i]<0) ExtATRBuffer5[i]=ExtATRBuffer3[i];
}
What do you see?

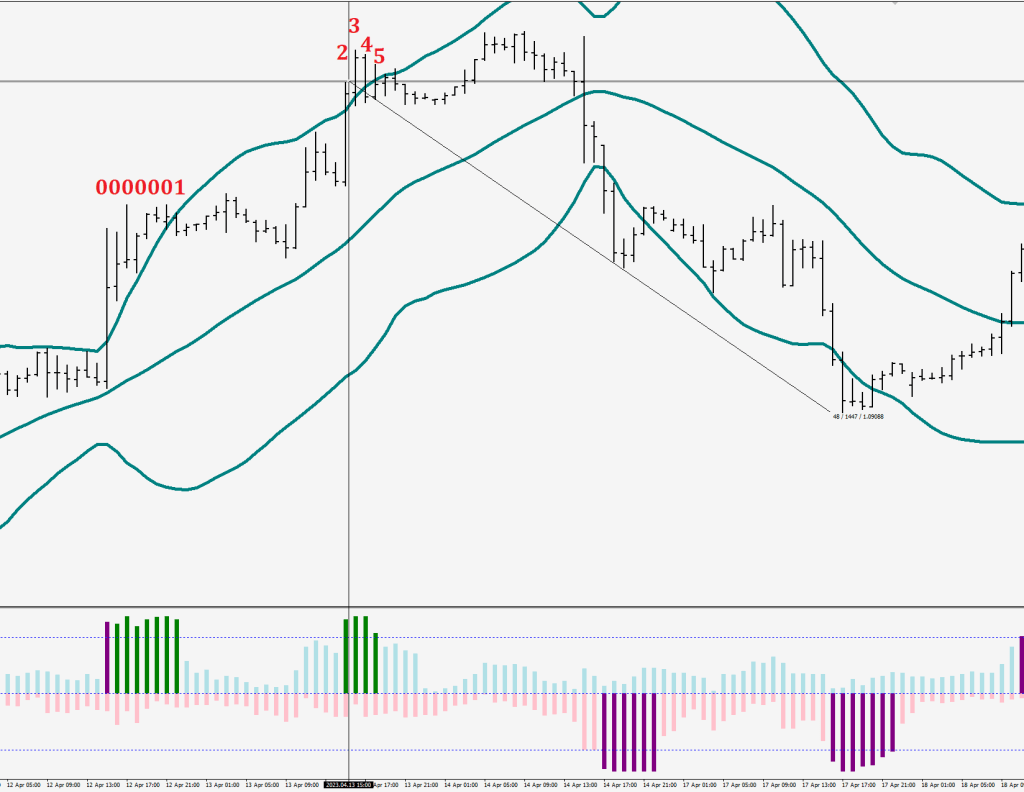
Can taking volatility measurements and applying some filters tell you the type of the market at a single glance? Look at the green and the red highlights. Which is more? Are there streaks of reds? Aren’ those 3 lows make up a line?
I’ve got the predicting power
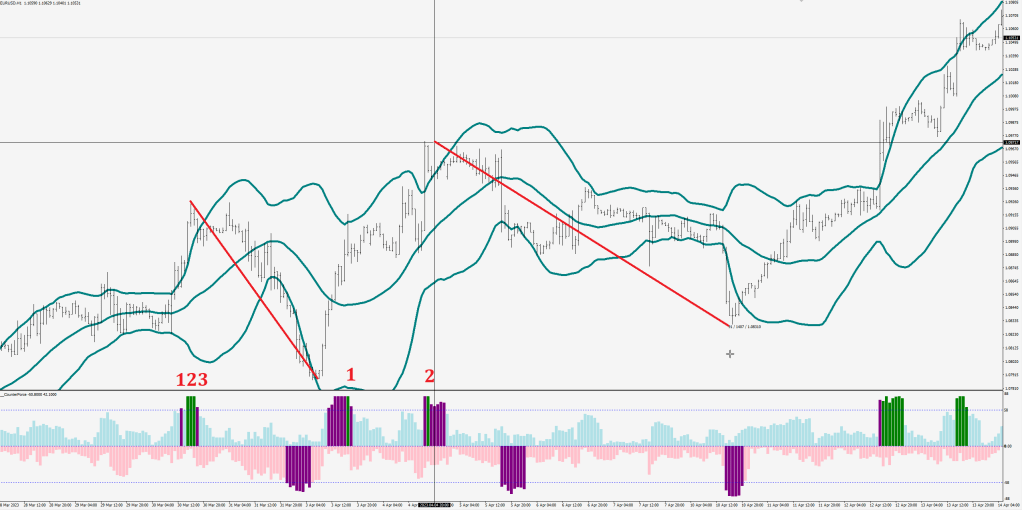
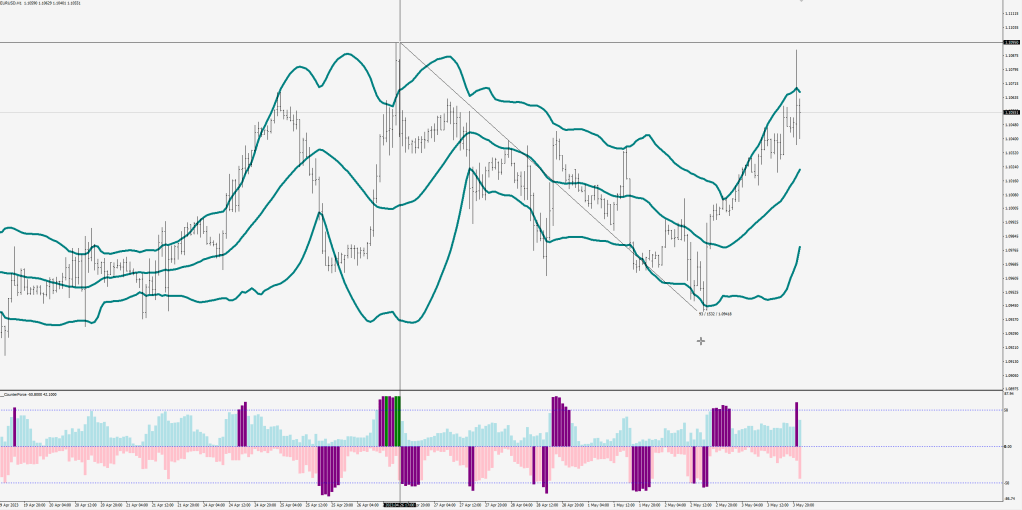
3 images to make a point about them streaks (gatherings).

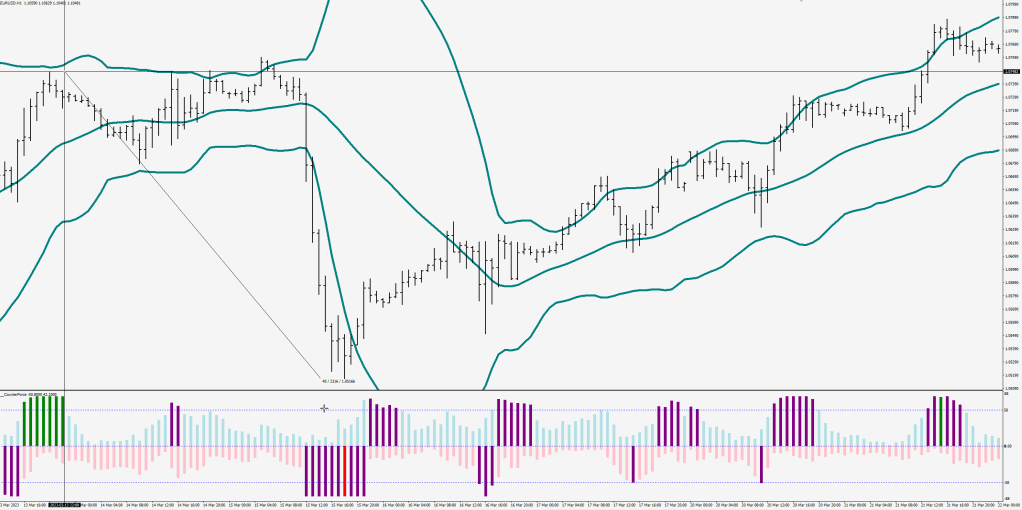

The streaks are followed by a correction that is in excess of 136 pips, and may get as deep as 220.
This sounds as some rather tradeable information.
One of the ideas I introduce at this point is the need for at least 2 green strike outs where the first one cannot have the entire body of the hourly candle outside the 30 sample hourly BB (HL2).
Only one question remains. Is it not an issue that there hasn’t been a single green stick on this current run up?
Nor a White Rabbit.