
Like a ship on the Ocean, headed out to Sea.
Going into the day, you can already know two things.
1. the configuration
2. the level to fail at
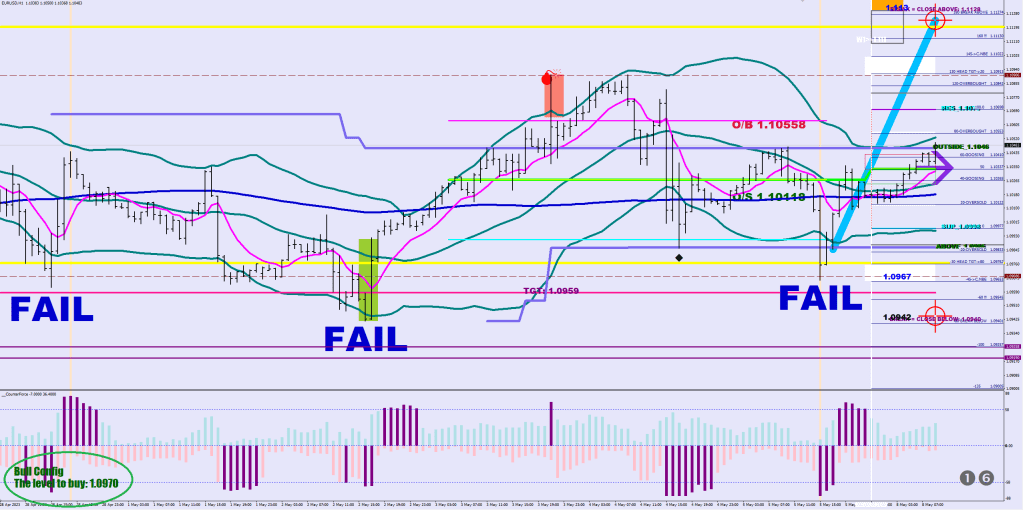
The configuration is the presence of R1 & R2 or S1 & S2 – see the CounterRejoyce routine.
The level to fail is based on the last 15-minute consolidation candle (where full charge was reached measured by the CI) and the distance is the 3-day ATR less 20 pips. There is no math to this, only stats.
Now, the scope of this article is to determine where the move away from the Fail levelel may yield another failure – in the opposite direction.
There are 2 main directional fail conditions.
One is above the highest close of the second “Green block” i.e.:

or a Volatility Breach Reversal – posted in the blog entry titled alike.
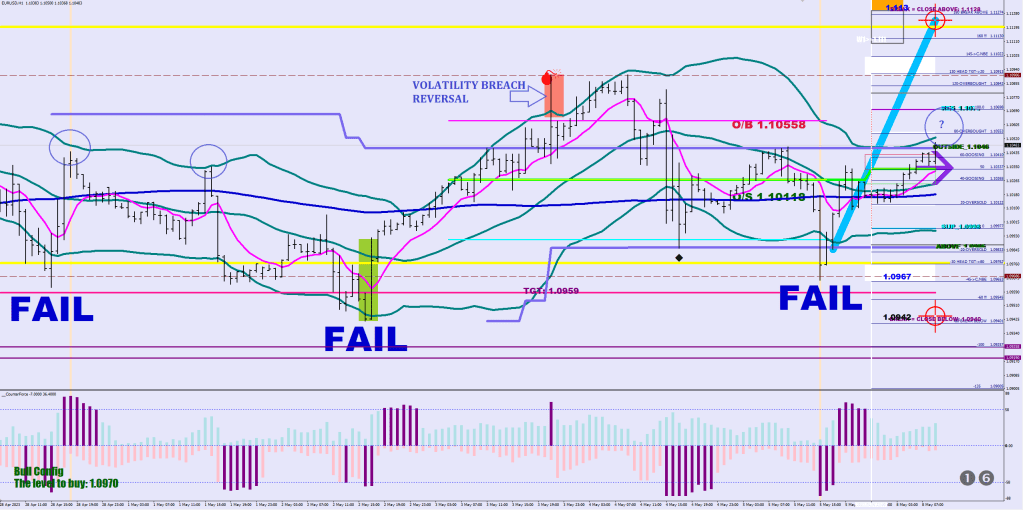
The last thing to contend with is volatility for the 3rd time. There may be a failure caused by the inability to challenge the upper 30-sample Hourly HL2 Bollinger Band, but as the previous example shows, there may be multiple attempts and I would not put my money on this event cutting the run short.
If you need to know how I can look back and find prior failures when all I plot is from the last 15-min failure, I have a continous version on the 15 min, and I can measure approximately 60 pips from the actual consolidation mean, et French.

It also seems to coincide with the white block, which is 30% outside the pendulum (in geek again).

Other than that there is nothing like the contrast of hevy metal and weightlessness.

