
We’re gonna do a song that you never heard before.
Sequential analysis
1st image: the importance of the S1 in this current uptrend.
Wave 2 and Wave 4 of A both had bounced off this very level. Even the B wave down ricosheted from it, after a re-alignment with an ABC move.

The downtrend was a lot more volatile. Seriously, the largest dip below the S1 so far was less than 4 pips!
I guess I killed the punchline. The sequential analysis can tell you with good odds if the price is in
- a Push (hand) beyond the 14-sample Window envelope (Blue)
- in an Echo (House icon) after a pullback to the purple square – or most likely time is up for this move (3 weeks beyond the push max.)
- or performing a return (back from the House icon) to one of the 3 support / resistance lines (“HOME”) (or just arrived at one)
S1 is 250 pips from the last Echo print.

I believe this may have been the Wave 2 of Wave C, and yes, we are headed back up to 1.23
Let’s Rabbit guidance
A rabbit is an energy surge measured by Choppiness.
The White arrow shows the last White Rabbit. A Rabbit is a 30-pip range, where price may turn around. When the stop is surpassed, the Rabbit is broken. Hedging is a must.
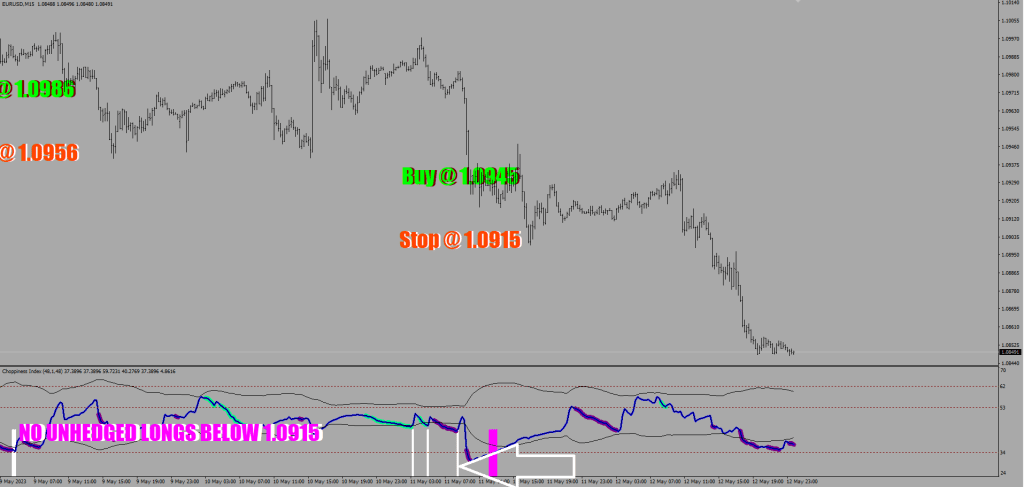
The Magenta strip is a sign of deep exhaustion, it guarantees a lower low (or higher high based on the direction).
The Rabbit that broke its neck, broke the internet.
I’m the one to be the one, but my butthole is confused.
Somebody is posting strawberry eating rabbits on Twitter.
I wish I had a Rabbit in a Hat.
