
Where are we at?
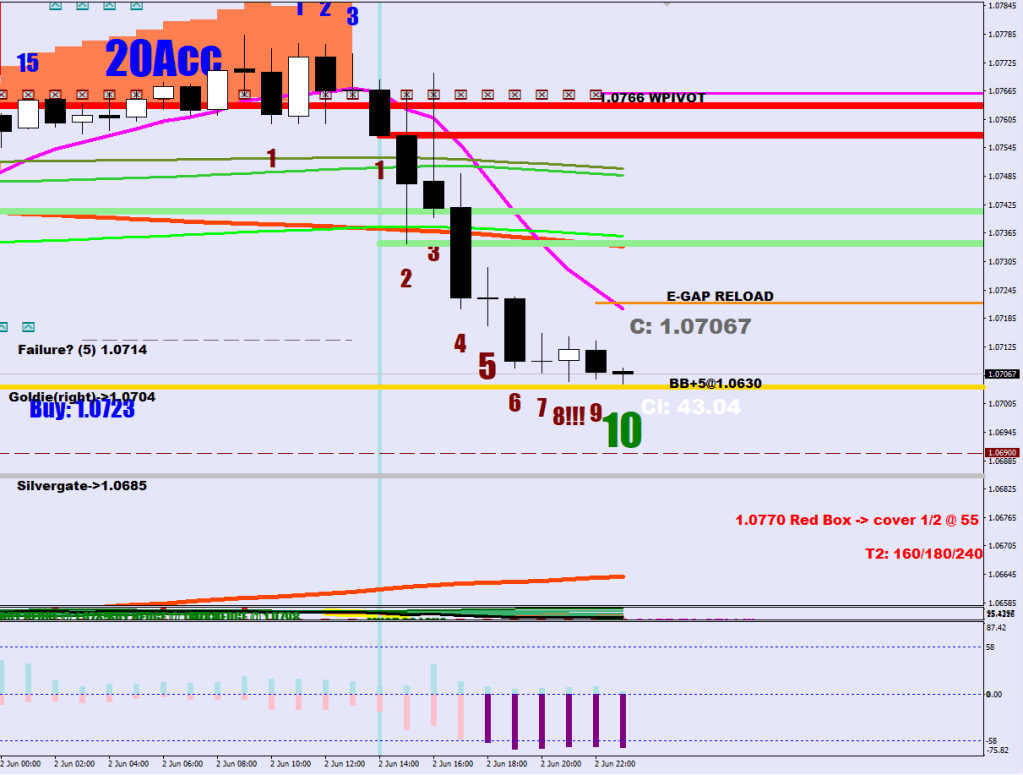
10 Hours of intensive selling (14 hours of correction) doubling down on support. Interesting that Goldie (buying the right for a no break extension) is not getting violated even with the increased spread. In an uptrend you want to buy weakness. The purple bars (2+) are a sign of weakness.

I’m thinking the ABC is over, during the news things got sped up and B printed less than 1 hour. The red beam highligts the high where the break out occured – and now being backtested.
Yea, I know that RSI2 is on the floor, but corrective waves can and will end on strength versus the 5 wave down that had to have a divergence.
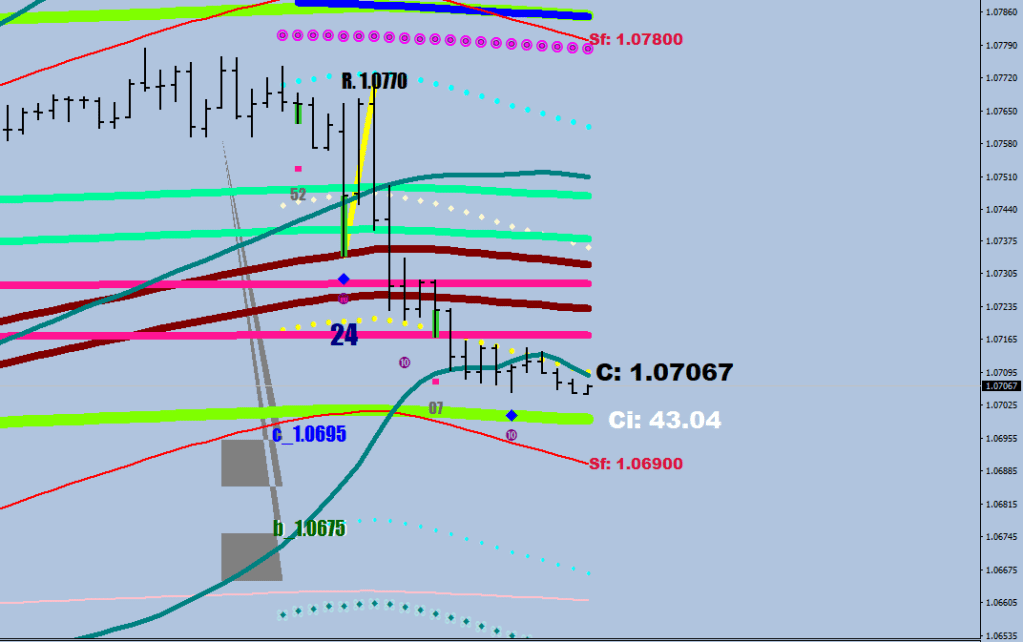
Between the two guard rails the market is completely neutral, but overall it is the bulls’ turn.
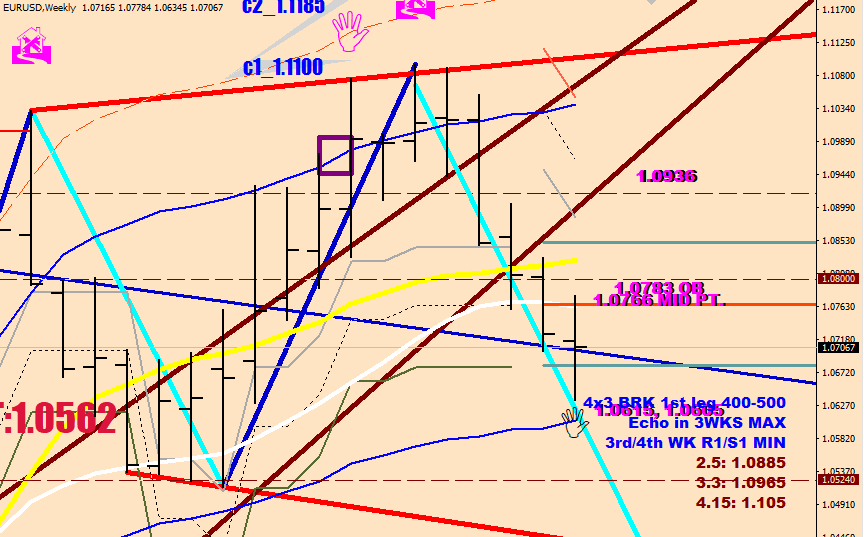
Image shows where the daily RSI2 would be safe to sell. A good 3 steps up from here.
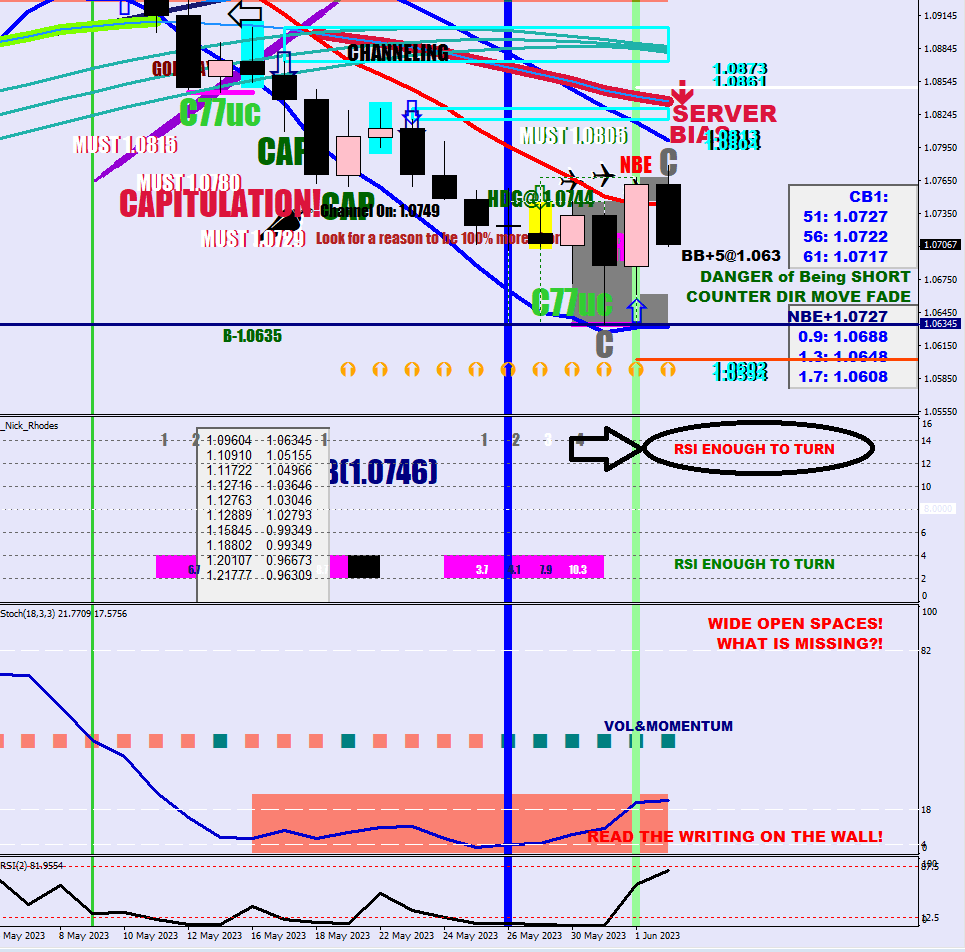
If you look at the momentum boxes, this kind of looks like an inverse head & shoulders.
It is entirely possible that a Wave 3 up would start next week.
A return to the S20 would mean 1.08 first.
The only counter evidence I have is the Rabbits that show a cap at 1.0798.
The weekly candle overall made a jab on the blue trendline (as wekk as on the S3).
karinka_timkiv
