
This is where the technical analyst caps out.
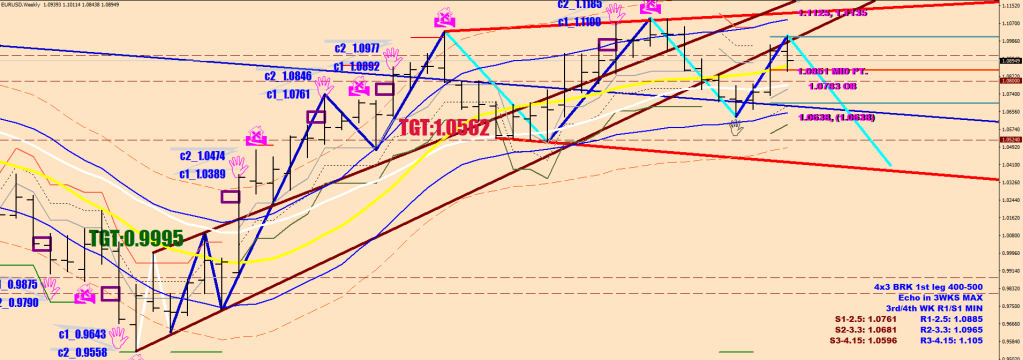
A lower high would be followed up logically by a lower low.
But what if the energy analysis says otherwise?
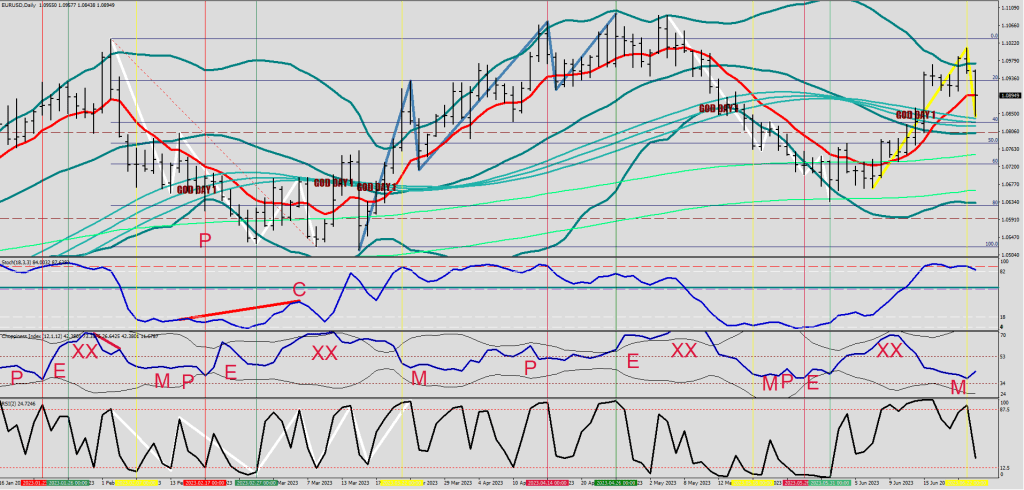
Oh great, even more lines.
Let’s talk XX. An equation of high energy reserves & stalling. After the re-adjustment of the volatility gauge with a volatility whip, you get an impulse structure.
5 waves. An M, a P and an E.
The argument here is that the P and the E are missing. 2-4 more swhing highs. If you look at the 207 river below, the market is making higher highs and higher lows starting from it.
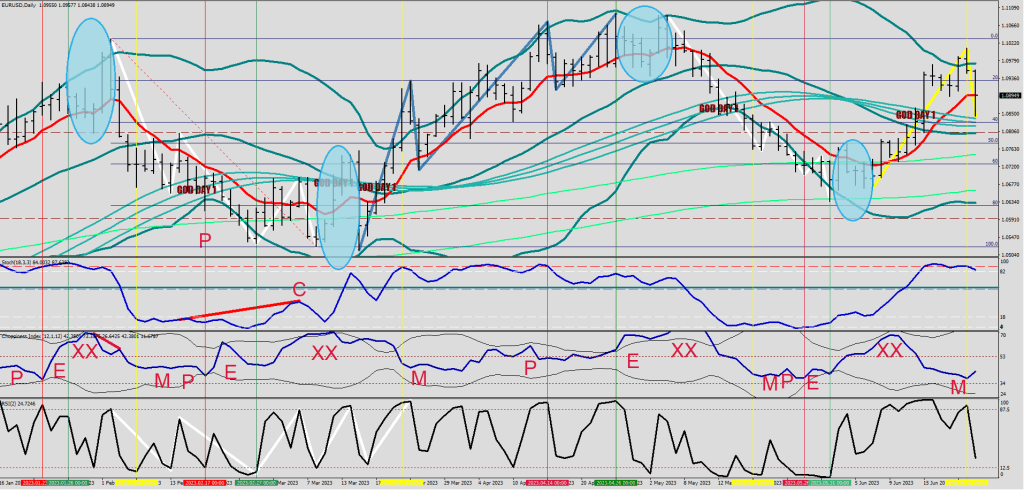
The last leg up had a Wave 2 pullback that was 2 days long and lasted 225 pips.
This move down was a mere 170 and found support at the lower guard rail. The point being that going extra bearish above the 50 EMA ribbon with a bullish config may not be the wisest thing ever.
I think there should be a 5th leg down, but hedge / close all shorts below the current swing low, in particular when the hourly RSI2 HL2 walks into the sub 3 area.
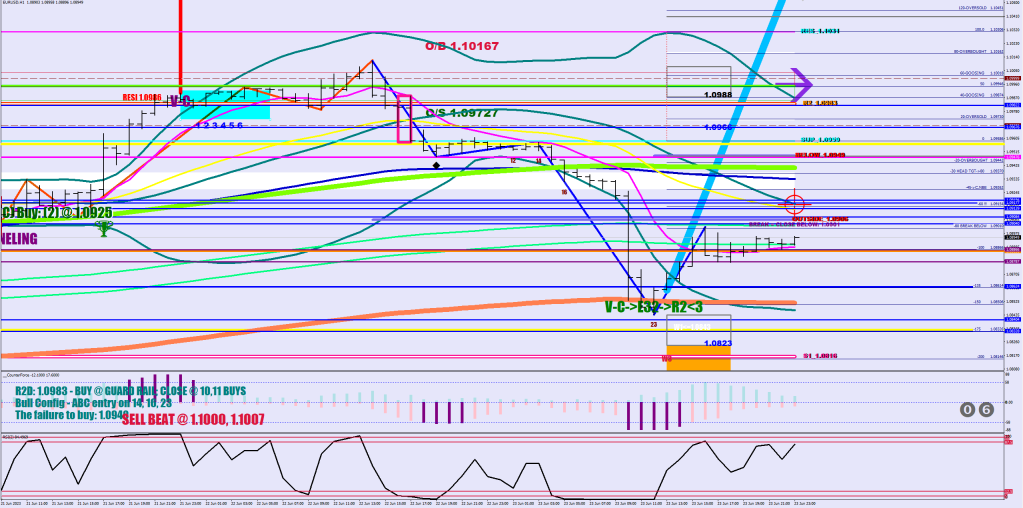
S1 is at 1.0816, S2 @ 1.0760
weekly S1: 1.0761
