

They arrived from the West, from the Ocean. Had to be Bullsharks to be able to swim in the fresh water. There were at least 30 of them.
They ate up my blog ruthlessly, almost like a cult.
Nobody talked to me. Every miracle only lasts 3 days. So did this terror attack. This was my 288 x 15 minutes of fame.


My Chemical Valentine, we are gathered here to talk about hollow things.
First, Happy Hollow Green.
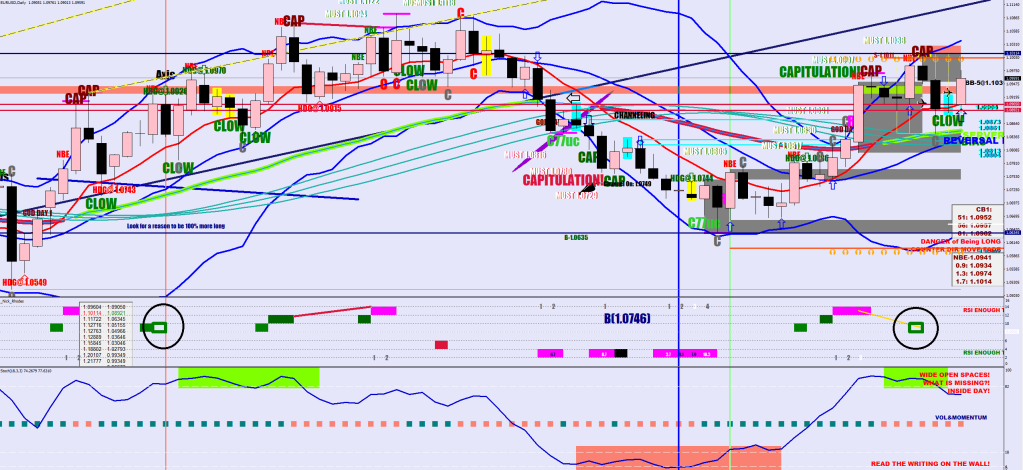
No relevance, just to start developing your hole-sight. The embedding green / coral canclels out the opposing momentum temporarily. Pro volume sent the price higher yesterday.
if (RSI2[i]>88.4){
         score[i]=1;
         ObjectCreate("Nick"+DoubleToStr(i), OBJ_RECTANGLE, indicator_window, Time[i], 10, Time[i+1], 8);
        ObjectSetInteger(0,"Nick"+DoubleToStr(i),OBJPROP_COLOR,clrGreen);
        ObjectSet("Nick"+DoubleToStr(i),OBJPROP_WIDTH,8);
        if (crossedaline(i,tccounter) &&  Close[i]<=Open[i]) ObjectSet("Nick"+DoubleToStr(i),OBJPROP_BACK,0);
   }


bool crossedaline(int i, int to)
{
int l;
bool isit = false;
for (l=0; l<to; l++)
   if (High[i]>levels[l] && Low[i]<levels[l]) isit = true;

return (isit);
}
You can no longer say that I never use fuctions. The levels array is the values displayed in the white box. Being hollow is going through one of those levels.
…
Them counter-volatility per hour DeepPink boxes. They call them ineffciencies. The expectation is that they would be re-visited at their core. This one was, for sure.
Hard to read, but the lyrics for the single purple stick says: End Of Direction (0-18 pips slip) -> New Wave Structure.
Here we need to talk about overbought / oversold difference and displacements.

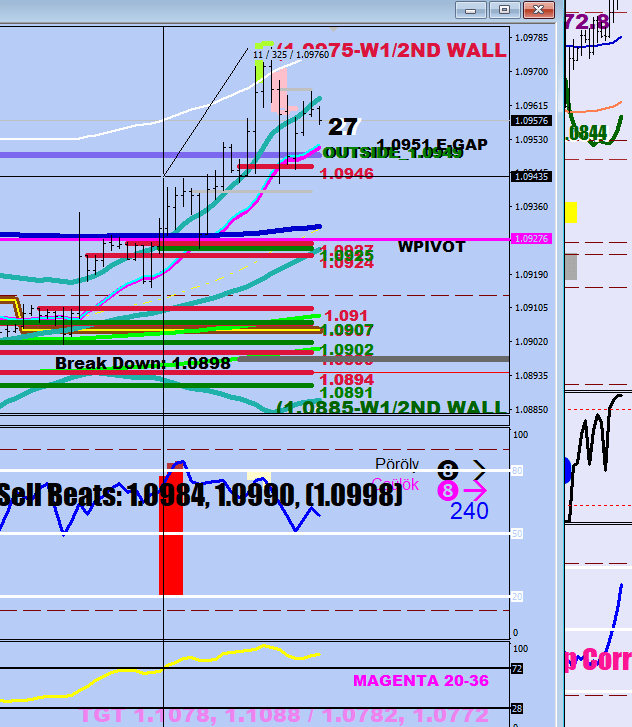
120 sample stochastic on the 30 min. The underbought MFI peak prompt is plotted in gray.
The idea of looking back on the MFI peak from 6 hours later to figure the 3 displacements (8, 14 and 28 pips) is not bad. There was a squeeze break to the upside, and the steepness currently isn’t in line with the norm. Yet, if you put the pointer above the Stoch overbought MFI peak and measure 28 pips from there, you get 1.0971, which was within 5 pips of the actual peak.
The stratosphere cropper (47 pips away from the E-16 hourly):
///// Crop 0.47 long (E16+47Pips)

    if( OrderType()==OP_BUY && (OrderStopLoss()==0.47  || OrderTakeProfit()==4.7) && OrderMagicNumber()!=50 && OrderMagicNumber()!=51 && OrderMagicNumber()!=52 && OrderMagicNumber()!=53 && OrderMagicNumber()!=54 && OrderProfit()>0 &&
   Close[0]>iMA(NULL,60,16,0,MODE_EMA, PRICE_MEDIAN,0)+470*Point && Bid>OrderOpenPrice()+.50*Point && OrderProfit()+OrderSwap()+OrderCommission()>0)
        {OrderClose( OrderTicket(), OrderLots(), MarketInfo(OrderSymbol(), MODE_BID), 5, Red );
            Print("Cropper Closed LONG @ "+MarketInfo(OrderSymbol(), MODE_BID)+" for ", OrderProfit());}

///// Crop 4.7 short (E16-47Pips)

    if( OrderType()==OP_SELL && (OrderStopLoss()==4.7  || OrderTakeProfit()==0.47) && OrderMagicNumber()!=50 && OrderMagicNumber()!=51 && OrderMagicNumber()!=52 && OrderMagicNumber()!=53 && OrderMagicNumber()!=54 && OrderProfit()>0 &&
   Close[0]<iMA(NULL,60,16,0,MODE_EMA, PRICE_MEDIAN,0)-470*Point && Ask<OrderOpenPrice()-.50*Point && OrderProfit()+OrderSwap()+OrderCommission()>0)
        {OrderClose( OrderTicket(), OrderLots(), MarketInfo(OrderSymbol(), MODE_ASK), 5, Red );
            Print("Goldilocks Cropper Closed SHORT @ "+MarketInfo(OrderSymbol(), MODE_ASK)+" for ", OrderProfit());}
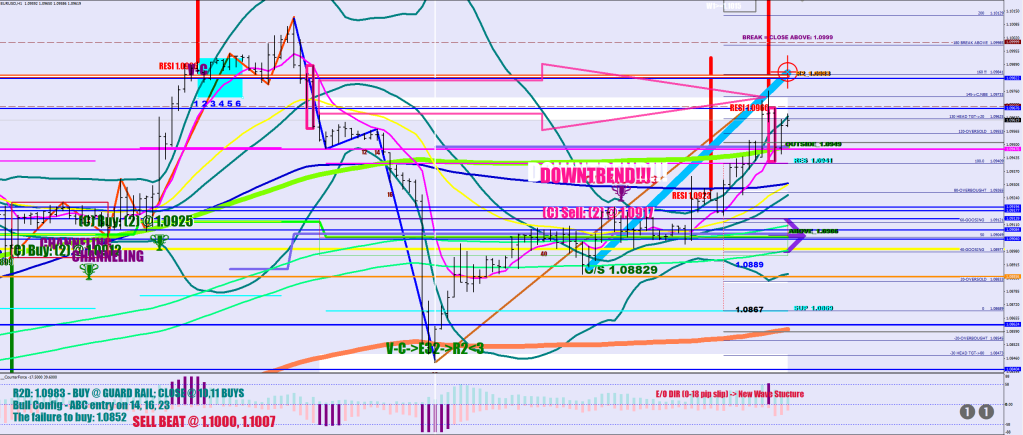
Also, the lower high / second triangle had to be made to establish the trend. The question was how much beyond the Upper Guard rail would it print.

I expect a channeling move down to start soon.
For breakfast I only ate the hole of the cheese.
Curly Fries, from the ocean.
Let’s excercise your mental brain: what does the greatest liquidity drop mean for the Euro?

