

You are looking at a SAAB black panel. An aviation heritage, displaying only important information, leaving all else black.
People can’t stand my charts, because they are so busy. I just added this T3 line in Gainsboro.
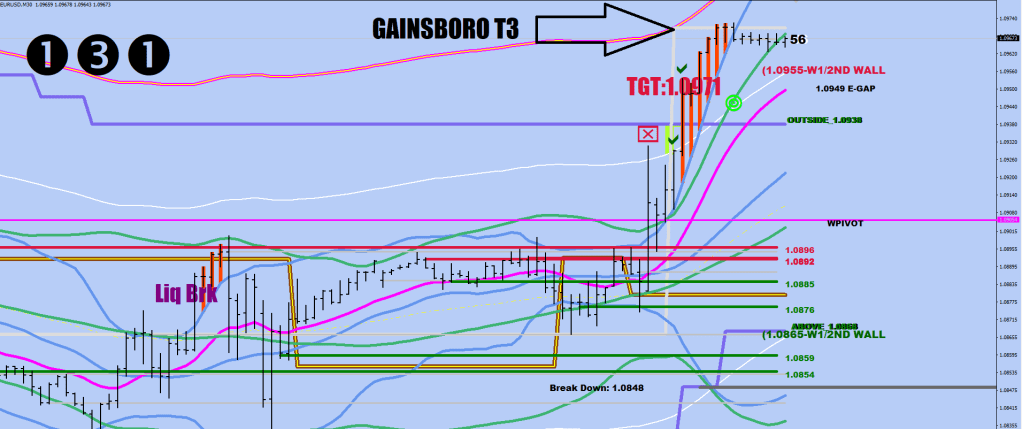
The black numbers are the width of the 30-sample hourly BB.
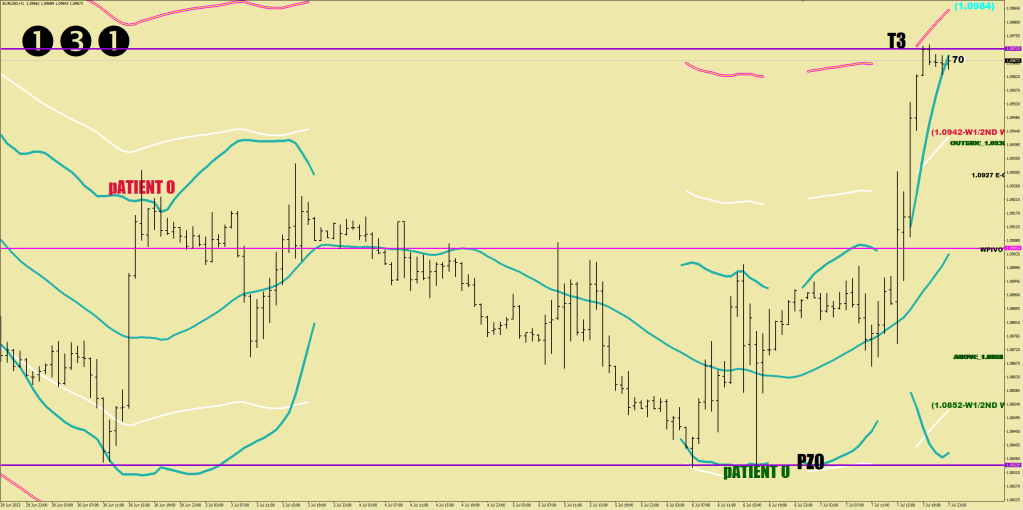
And now, I would be pedaling against my own trend with my PaleGoldenrod (another MT4 color) panel.
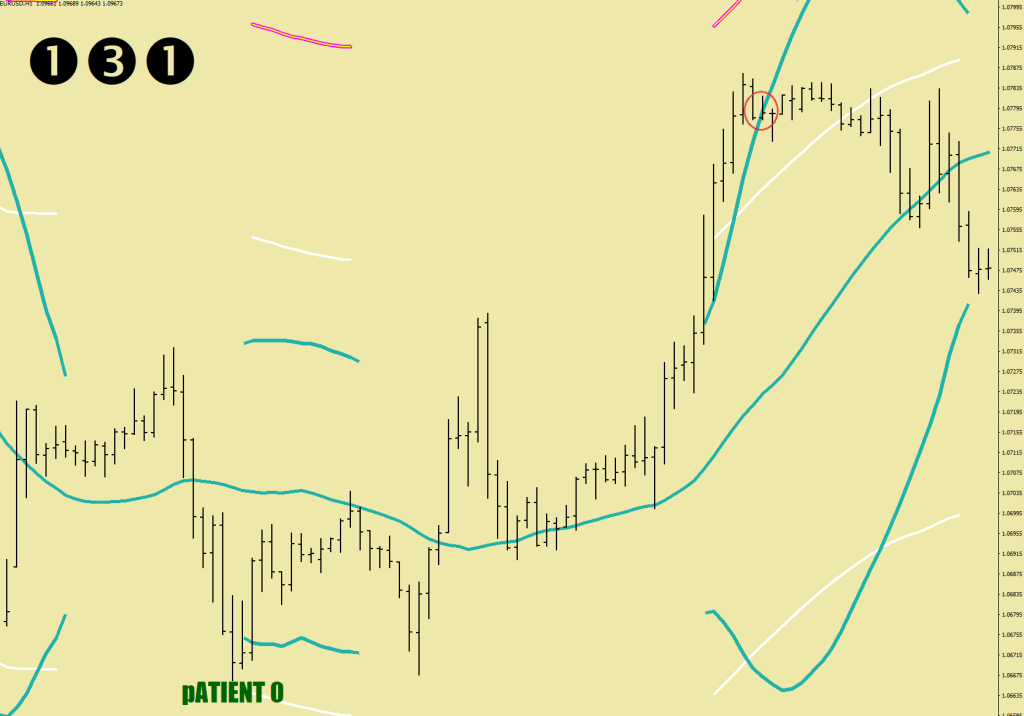
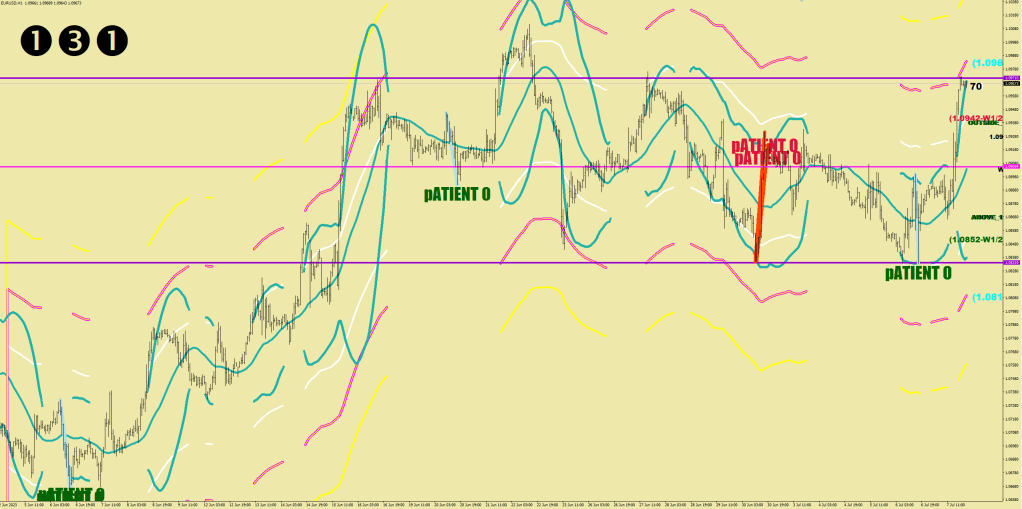
Patient 0 is the starting point of a zero risk entry. Zero risk means a possible moratorium of a fluctuation size (32 pips). Patient zero needs a BB 58 pips or wider (zo do all the targets) and a move from one BB to the other within 7 hours.

The line encounters are the terminals.
The Pirelli Zero horizontal plot could be automatized, but I have to put the T3 on manually as it reqires a 30-minute chart with a nil-checkmark sequence for a valid projection – see the first image.
    if ((iBands(symbol,0,30,2,0,PRICE_MEDIAN,MODE_UPPER,i)-iBands(symbol,0,30,2,0,PRICE_MEDIAN,MODE_LOWER,i))*10000>58
    &&  Low[i]<iBands(symbol,60,30,2,0,PRICE_MEDIAN,MODE_LOWER,i)
    &&
    (High[i+2]>iBands(symbol,60,30,2,0,PRICE_MEDIAN,MODE_UPPER,i+2) || High[i+3]>iBands(symbol,60,30,2,0,PRICE_MEDIAN,MODE_UPPER,i+3)
    || High[i+4]>iBands(symbol,60,30,2,0,PRICE_MEDIAN,MODE_UPPER,i+4) || High[i+5]>iBands(symbol,60,30,2,0,PRICE_MEDIAN,MODE_UPPER,i+5)
    || High[i+6]>iBands(symbol,60,30,2,0,PRICE_MEDIAN,MODE_UPPER,i+6))
    ){
          ObjectCreate("Talmat"+DoubleToStr(i), OBJ_TEXT, 0, Time[i], Low[i]+20*Point);
          ObjectSetText("Talmat"+DoubleToStr(i), "pATIENT 0", 32, "Impact", DarkGreen);
    }


      if ((iBands(symbol,0,30,2,0,PRICE_MEDIAN,MODE_UPPER,i)-iBands(symbol,0,30,2,0,PRICE_MEDIAN,MODE_LOWER,i))*10000>58
    &&  High[i]>iBands(symbol,60,30,2,0,PRICE_MEDIAN,MODE_UPPER,i)
    &&
    (Low[i+2]<iBands(symbol,60,30,2,0,PRICE_MEDIAN,MODE_LOWER,i+2) || Low[i+3]<iBands(symbol,60,30,2,0,PRICE_MEDIAN,MODE_LOWER,i+3)
    || Low[i+4]<iBands(symbol,60,30,2,0,PRICE_MEDIAN,MODE_LOWER,i+4) || Low[i+5]<iBands(symbol,60,30,2,0,PRICE_MEDIAN,MODE_LOWER,i+5)
    || Low[i+6]<iBands(symbol,60,30,2,0,PRICE_MEDIAN,MODE_LOWER,i+6))
    ){
          ObjectCreate("Talmat"+DoubleToStr(i), OBJ_TEXT, 0, Time[i], High[i]-20*Point);
          ObjectSetText("Talmat"+DoubleToStr(i), "pATIENT 0", 32, "Impact", Crimson);
    }
A lot of unnecessary overthinking can be spared this way.

…

iHigh(symbol,0,iHighest(symbol,0,MODE_HIGH,7,i))-Low[i]> 520*Point && Low[i]<iBands(symbol,0,30,2,0,PRICE_MEDIAN,MODE_LOWER,i) && High[i+7]>iBands(symbol,0,30,2,0,PRICE_MEDIAN,MODE_UPPER,i+7)
The direction is over with a patient 0 / liquidity break.
The direction is over with a T3 projection fill.
The direction may be over with a T2 + momentary volatility increase.

