
Gaps in knowledge, faulty thinking.
We all get biassed by others, so we must come up with something more reliable, something close to black and white.
So what tools am I proposing for this reason?
RSI2 HL2 hourly to start the counter.

Second thing is clear definitions in your head. A pullback that has low volatility and never makes it beyond the hourly 30 SMA is a pullback, evren if it looks like an ABC structure.

A correction thus would get to the other side of the nentioned barrier, providing us with the first check point.

Not a correction.
A move to the other side of the S30 in 7 hours is a break out preparation (Score), with a count down for a follow through by the 11th hour.
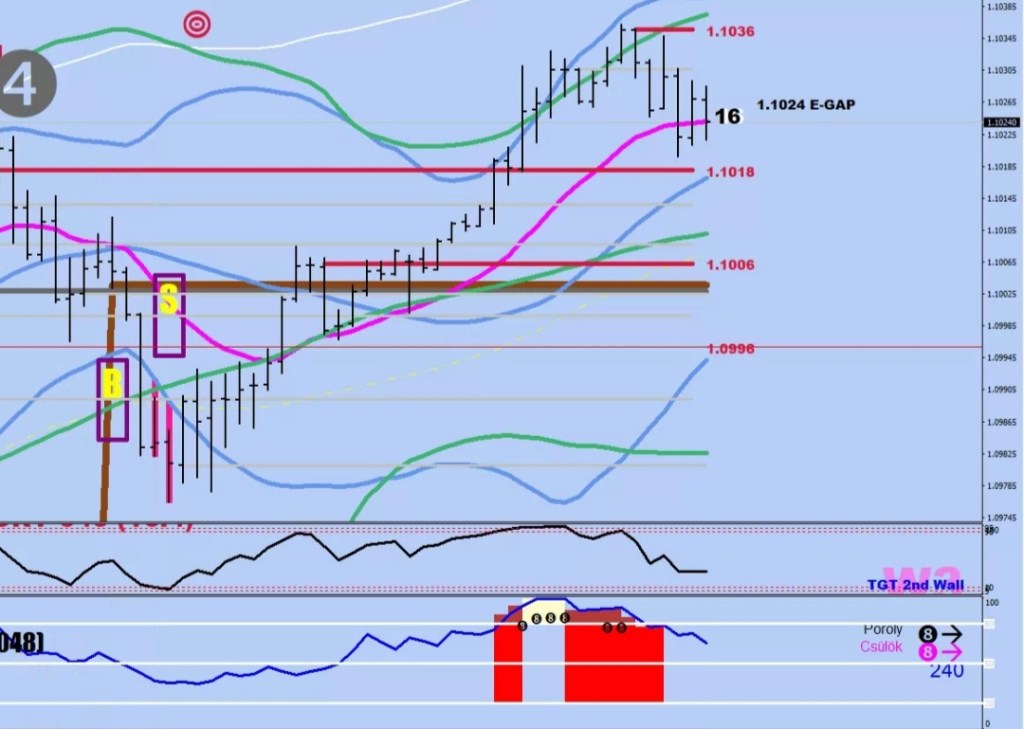
This ABC correction was a loneliness kind though only lasted 8/10 hours (see first image) versus the common 14-16 hours long one.
Here’s Pippoletto elegantly and smoothly identifying the entire ABC correction as an A leg down. I’m sure, Mr. Fifonacci was there to back him up on this.
Looks on one time frame may not be enough. All the Elliott zombies of the world may not be enough.
My mind was elsewhere, I was trying to find a liquidity break instead of evaluating the correction properly.
The 2x 30 min disconnection was lot followed by an RSI4<10 and an RSI4>10 for a liquidity break call.
No liq. Brk, but MFI went off the charts.
The point is, you do need the right indicators, the ability to count and the knowledge of what is what and when.
…all you needed to know was 1.11
