
The pitch.
It’s a bat. It’s a bet.
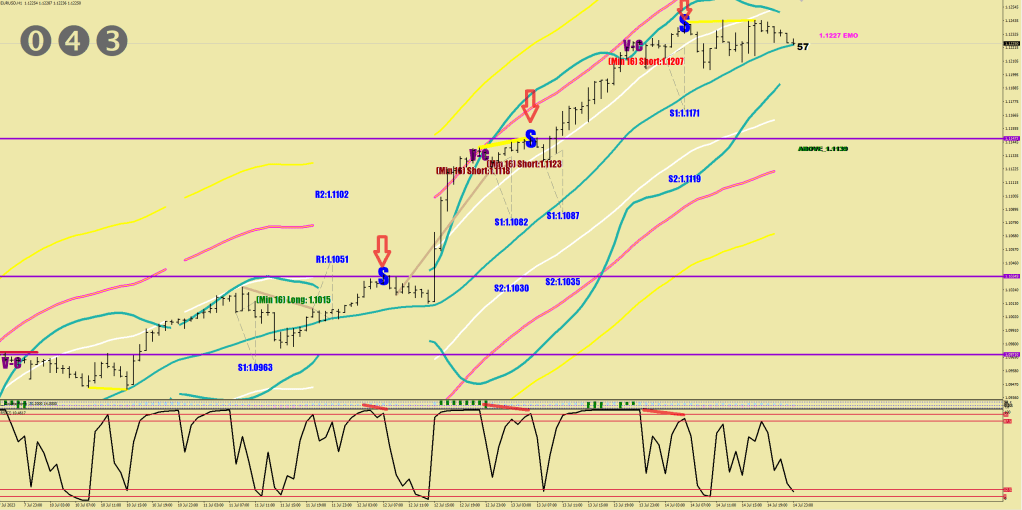
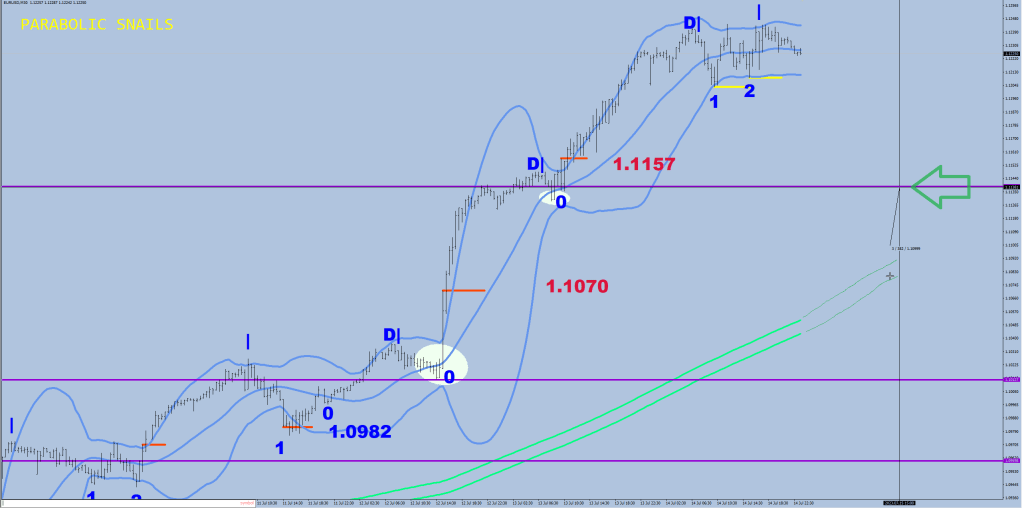
The divergent pitch. First, on the hourly. RSI2 divergences marked with red (S, arrow). Prompting some sort of corrective movement.
On the 30m, you are looking at the same 3 pitches. See that these pitches fall short of the 30-sample BB top.
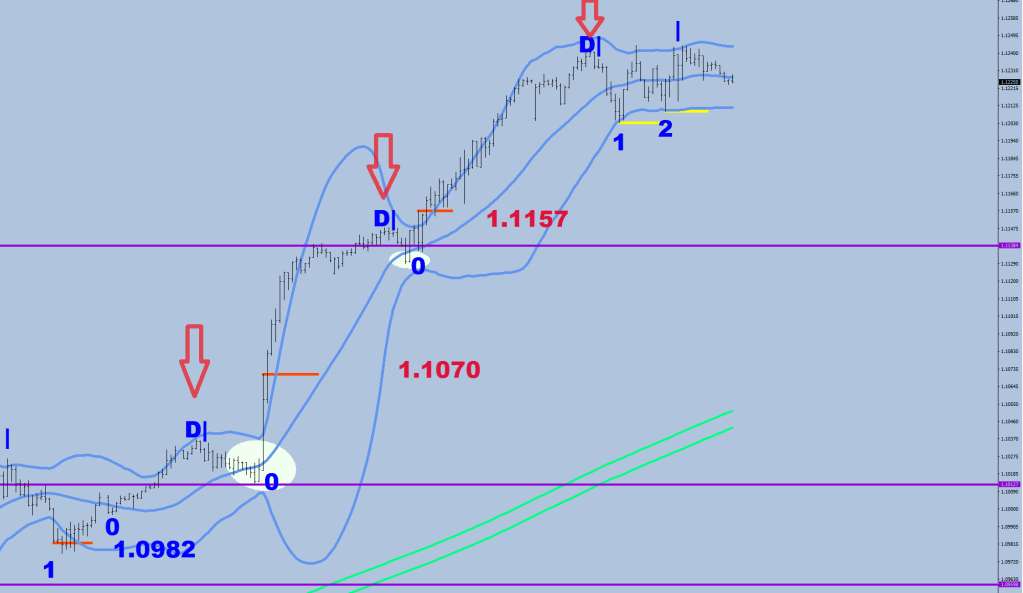
See how the response for the first two was getting in just below the 30 sample SMA, before the lower BB (white oval+zero).
The last time was different.
We got a Blush Response called Capillary (1) and Dialect (2).
Short histoty.
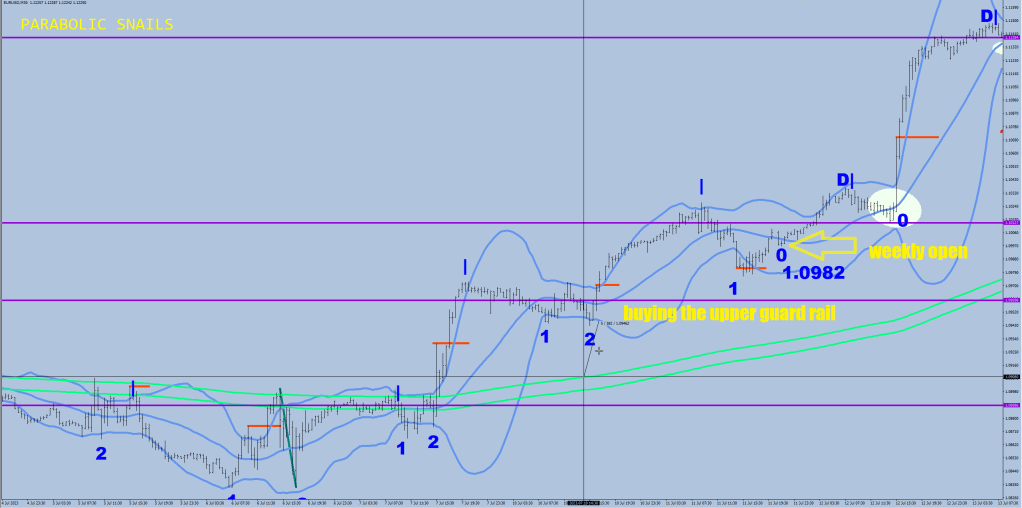
Before last week they overwhelmed the Dialect Response at the open with an aggressive buy, the market was already being kept out of the E9 Valley which is the 414 EMA band on the 30-minute. The valley’s limits are 1 fluctuation maximum away from the EMA band, which is 38.4 pips. That’s the measurement plotted between the Response and the Green River.
extern double FSize=32;
double FMax = FSize*6/5;
The future.
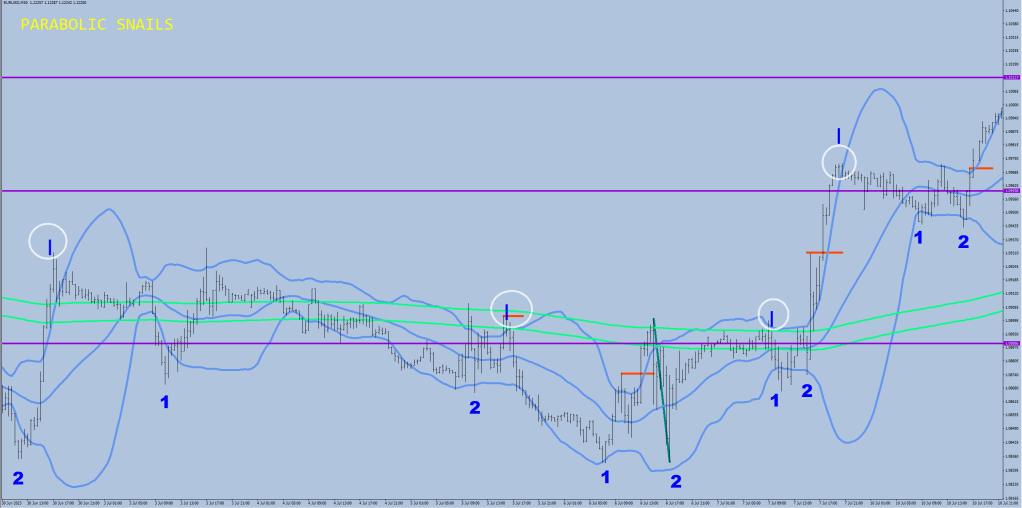
The most likely areas to be revisited on a “Mean Reversal”, are the Upper Guard rail, the Green River itself and the area below the Green River to the Lower Guard rail. These numbers would change dynamically, but I did plot where I think the rubber would meet the contact lense. That arrow is where the Upper Guard rail may arrive on Monday / Tuesday.
This guy is very good. If only he took a couple of lessons from me, he could be perfect.
