Push (hand) and echo (house) stats. (Upside for now)

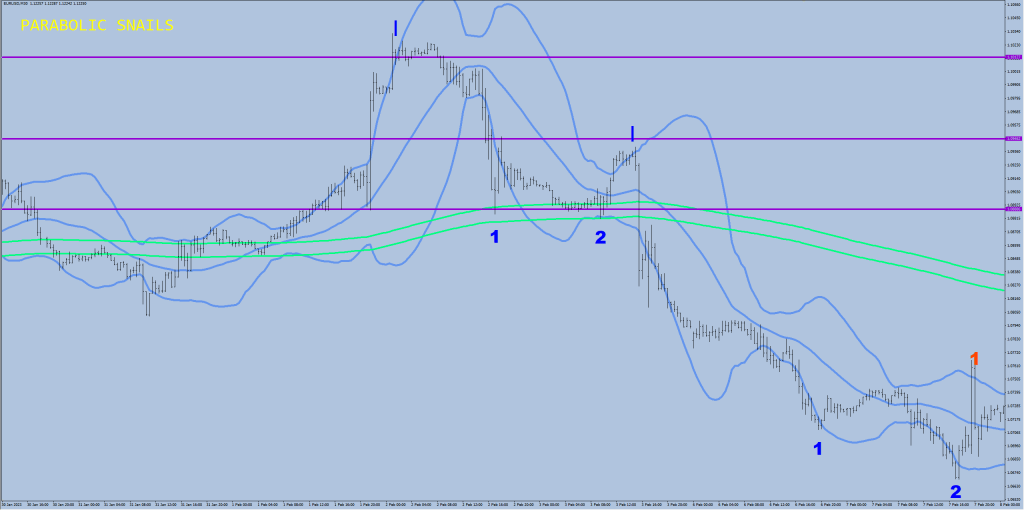
The purple boxes are there to help to give two likely levels to get in on.
With the current high not changing, it is 1.1163 & 1.1112.
There is a 3rd line that comes from the measurement maximums is 166 pips lower (cca 1.1078)
The shallowest push pullback are at about 90 pips.
Looking back all the mean reversions, the likelyhood is great that the entire move would not end before getting below the Green River (E9D) by up to 46 pips.
Total pullback legths were 90, 168, 97, 167 pips.
The echo peaking may be occurring the following week, most likely two weeks out, but there has been an example of a third week, and also worth noting that there was an echo that received a “time out” because of falling short after 2 weeks and price was headed lower to close the wave structure with toucing down on the S1 which is 250 pips lower from the push value.
No point talking about the c1 and c2 values and the target line just yet.
Hey now,
We want to know how this correction would go first.
Snapshots of 3 examples.

The likeliest route is the next one. A quick ABC with opressed volatility peaks (D-bats) and a terminal 46 pips below the Green Flow.