
The key to aggression is counter directional volatility.
The key to target projection is counter directional volatility.
While the market does not display the ability to move agaist the trend, it remains in a permanent limbo.
I thought the criteria for an Aggressive entry was settling back to the 30-min S30 first, and although the A would end up printing on the other side of this MA, the actual show card is 30+ pips of move first in the wannabe aggression.
Similarly, MFI beat projections are requiring a conter move in excess of 58 pips to be taken seriously.
So the first fight to engage in is for claiming enough volatility.
I do not know if I have picked the right metric, but I like the 4-hour sample 30 minute chart combo.
This is what I’ve been trying to tell you all my life: news does not change positioning.
COT data is delayed by a week and nobody knows how to read it. Funds cannot just dump what they have into decreased liquidity.
Also drawing “sell side liquidity” and “buy side liquidity” would not get you any closer to understanding the next move’s sustainability.
The market speaks to you via making directional volatility plots.
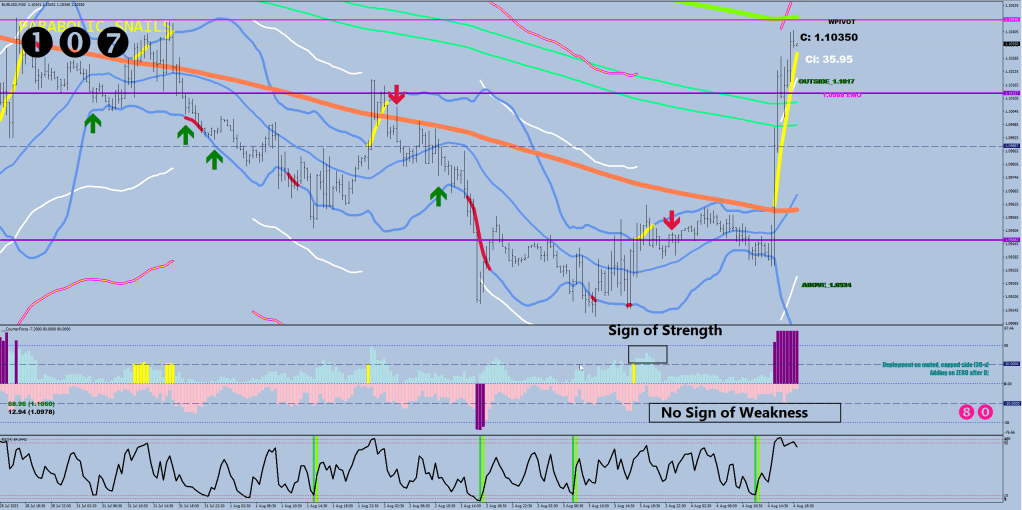
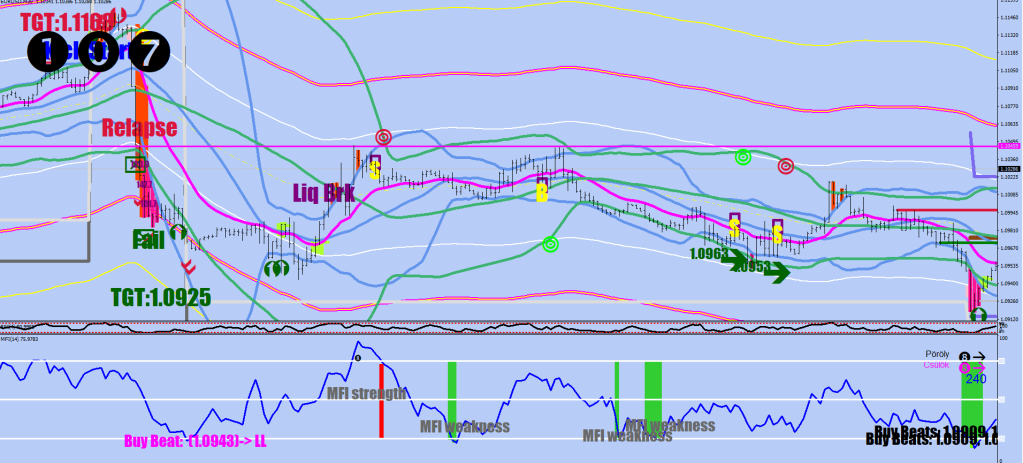
There was a fake out of the Weekly S2 (1.0945) and the daily S2 (1.0939).


Other: the Money Flow beat got an extra filter, the ionosphere. A low / high outside means that a lower low / higher high is yet to come.
 if (mfi[i+12]<mfi[i+13] && mfi[i+12]<mfi[i+11] && mfi[ArrayMinimum(mfi,3,i+11)]<mfi[ArrayMinimum(mfi,23,i+15)] && mfi[i+12]<21 && iStochastic(symbol,0,120,3,3,MODE_SMA,PRICE_MEDIAN,MODE_MAIN,i)<72){
            ObjectCreate("Sals"+DoubleToStr(i), OBJ_TEXT, indicator_window+1, Time[i+10], mfi[i]-mfi[i]*.2);
        ObjectSetText("Sals"+DoubleToStr(i), "Buy Beats: "+DoubleToString(NormalizeDouble(iLow(symbol,0,iLowest(symbol,0,MODE_LOW,16,i+1))-80*Point,4),4)+", "+DoubleToString(NormalizeDouble(iLow(symbol,0,iLowest(symbol,0,MODE_LOW,16,i+1))-140*Point,4),4)+", ("+DoubleToString(NormalizeDouble(iLow(symbol,0,iLowest(symbol,0,MODE_LOW,16,i+1))-220*Point,4),4)+")", 22, "Impact", Black);
         if (Low[i+12]<(stratod[i+12]-400*Point)) ObjectSetText("Sals"+DoubleToStr(i), "Buy Beat: "+" ("+DoubleToString(NormalizeDouble(iLow(symbol,0,iLowest(symbol,0,MODE_LOW,16,i+1))-220*Point,4),4)+")-> LL", 22, "Impact", Magenta);
         if (iStochastic(symbol,0,120,3,3,MODE_SMA,PRICE_MEDIAN,MODE_MAIN,i+12)>10) ObjectSetText("Sals"+DoubleToStr(i), "MFI weakness", 22, "Impact", DimGray);

      }
Also the golden stripes now have a look right +1 sample comparison
  if (i>0 && RSI2[i-1]>RSI2[i] && Low[i+1]<guardraild[i+1] && RSI2[i]>2 &&
   ((RSI2[i]<RSI2[i+1] && RSI2[i+1]>.5 && RSI2[i+1]<3.5 && RSI2[i+2]<4.5)
   || (RSI2[i]>RSI2[i+1] && RSI2[i+1]>.5 && RSI2[i+1]<3.5 && RSI2[i+2]>3.5  && RSI2[i+2]<7
   && iMFI(symbol,0,14,i+1)<45
   && iMFI(symbol,0,14,i+1)>25  ))
   && iLow(symbol,0,iLowest(symbol,0,MODE_LOW,6,i))< iLow(symbol,0,iLowest(symbol,0,MODE_LOW,10,i+7))
   )
Still a virgin afer all these years

