
The call to make here, is about as difficult as it gets.
The orange line is the 50% mark of 1100 days’ worth of data.
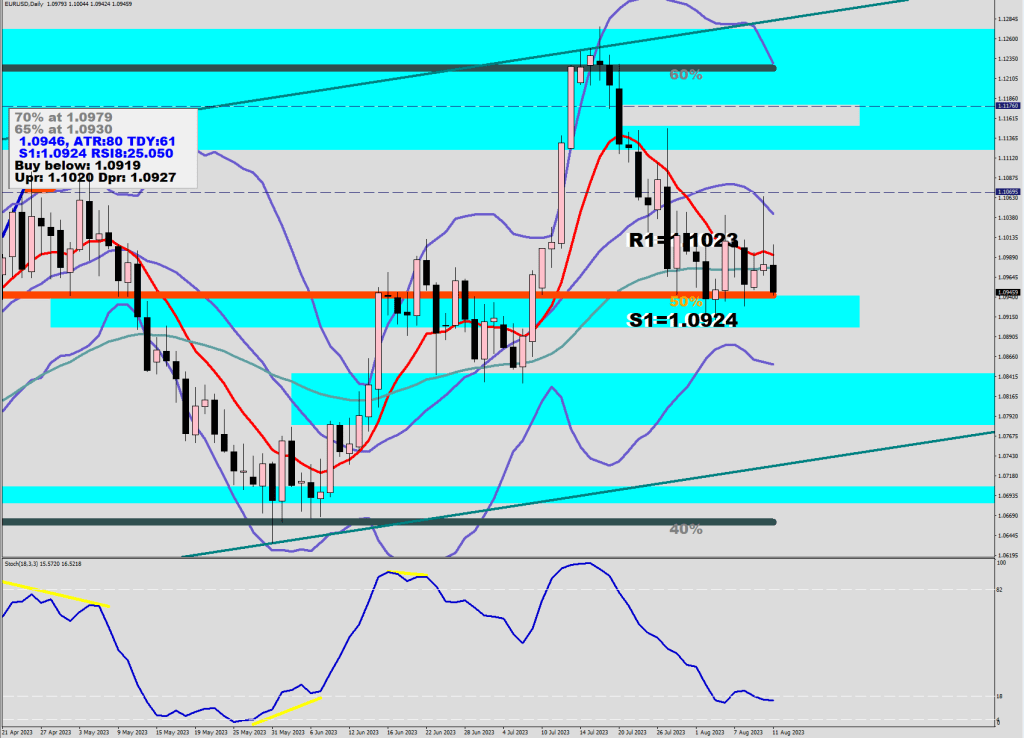
You are approaching it from above, it should be support. The same time you are testing it for the 3rd time.
This sell off from the Upper Guard Rail to the Lower. No momentum behind it.

It took 2 days to get up, and 2 days to get back down. Not very convincing.
We are going for the yellow virgin level below (perhaps for both), but what if we made it there, what would be the incentive to keep on going?

Once price gets back beyond the 8EMO (magenta) the 2nd cancellation will have been made.
19 days of selling = ridiculously oversold. What would some actual buying do to this picture.

Look at the 5 waves down on the left in white. Was about 20 days. We could be printing a C leg and it would not have to make a lower low either.
Imagine running the stops above the latter Cover High. What would stop price, where would be a collective effort concentrated to kill the rally?

All the moving averages converge here, but going back above 1.1030 would put price back above the 20, the 50, the 9. A lot of bang for a little buck.

Another ABC up?
