
This would be about the behaviour of the Zero.
The Zero in essence is a significant Lower High / Higher Low print.
Price can just accelerate from that point on, but at some point there would be a back test, and a reaction is likely there.
Here’s a sample: after a little incubation, a move away, the use of the spring board an off we go:
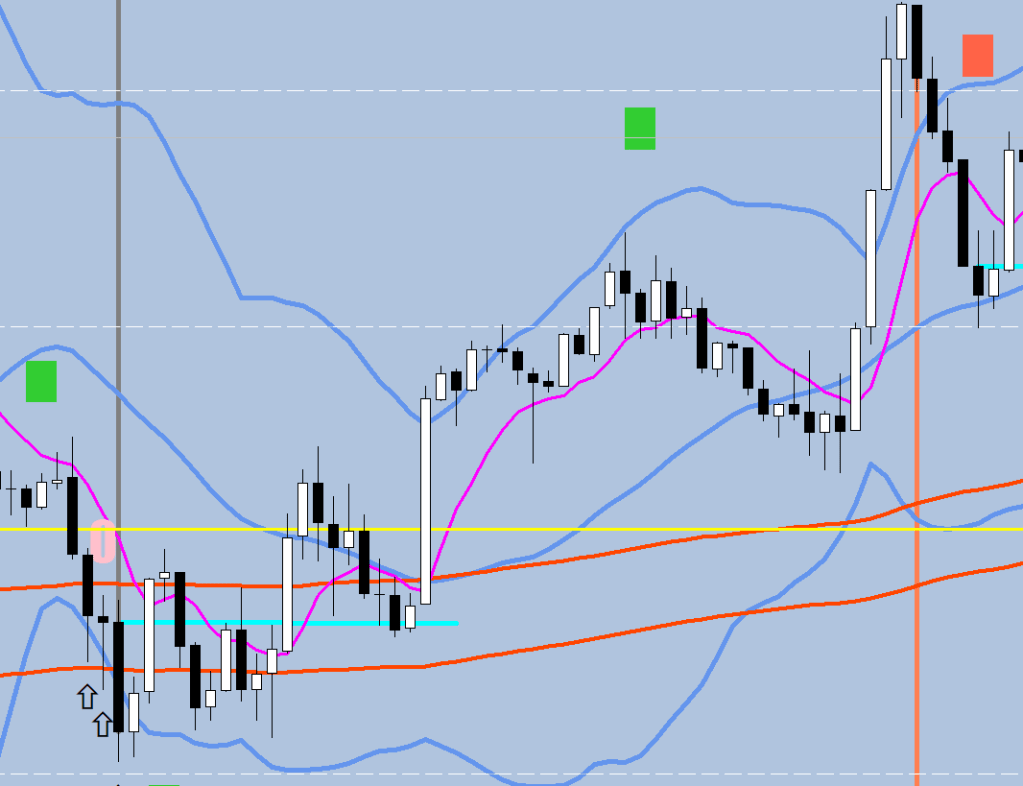
I use the inner body end of the candle for a support line.

When there is no immediate / subsequent back test, that may be a sign of the servo being in place. See, algorithms can be gamma positive or negative – by choice. They can fade or aid a move.

The big arrow zero – wasn’t really a lower high on a closing basis. The gamma (expansion) positive behavior and the opening gap combination was a simple continuation line drawn in Gold.
Friday’s opex pinning came with a Gamma negative behavior. They kept driving price back to the zero support line.

I would not read much into that “1” print, since the bands narrowed back in too much. Yes, it flipped the promoted side and now the liquidity break line is down there by the last major swing low.
The 1.0469 level remains untested still. If we get a zero at the other end, that may chnage things around. Otherwise I would think a Green #1 down, a break, and a #2 print, which brings me to the last piece of info I have. It only affects the down side.
After the #2 count 27 candles out. The support level is the lowest recent 30-minute close – and you have a play of 4-10 pips beyond that, this “Cover Level” is to be taken seriously.

The sample size isn’t large, but this is a feature I’ve pick up on.

