
Repeat after me, what are we doing here at the Parabolic Snails?
Figuring Out Funny and Puching Faces! Oi-oi!
After 2 progression lows, what am I looking for?
I am looking for either a Support Level to print or a Final Divergence.

The Support Level would mean the lowest close in the next 27 candles minus 4 pips.
The Final Divergence would be a fractal that sets up an RSI2 divergence – see code.
/// final divergence on the downside

 if (iFractals(symbol,0,MODE_LOWER,i) && greencount[i]>=2 && Low[i]<iBands(symbol,30,30,2,0,PRICE_MEDIAN,MODE_LOWER,i)+10*Point
 && RSI2[i]>3
  ){
   j=i+1;
   while (j<=i+7){
      if (RSI2[j]<RSI2[j+1]
      && RSI2[j]<RSI2[j-1]
      && RSI2[j]<8.3
      && RSI2[j]<RSI2[i]
       && Low[j]>Low[i]-20*Point
      ) break;
    j++;
   }
  if (RSI2[j]<RSI2[j+1]
  && RSI2[j]<RSI2[j-1]
  && RSI2[j]<8.3
   && RSI2[j]<RSI2[i]
  && Low[j]>Low[i]-20*Point
 // && Low[j]<iBands(symbol,30,30,2,0,PRICE_MEDIAN,MODE_LOWER,j)
  && High[j]>iBands(symbol,30,30,2,0,PRICE_MEDIAN,MODE_LOWER,j)-10*Point
   ){
         ObjectCreate("120BPMMM"+IntegerToString(i),OBJ_TREND,0, Time[i], Low[i], Time[j], Low[j]);
      ObjectSet("120BPMMM"+IntegerToString(i),OBJPROP_COLOR,clrBlue);
      if (RSI2[j]<0.5) ObjectSet("120BPMMM"+IntegerToString(i),OBJPROP_COLOR,clrSteelBlue);
      if ((greencount[i]==3 || greencount[i]==5) && Low[i]==iLow(symbol,0,iLowest(symbol,0,MODE_LOW,70,i))) ObjectSet("120BPMMM"+IntegerToString(i),OBJPROP_COLOR,clrDarkGray);
      ObjectSet("120BPMMM"+IntegerToString(i),OBJPROP_WIDTH,12);
      if (Low[i+7]<iBands(symbol,30,30,2,0,PRICE_MEDIAN,MODE_LOWER,i+7)-120*Point || Low[i+6]<iBands(symbol,30,30,2,0,PRICE_MEDIAN,MODE_LOWER,i+6)-120*Point || Low[i+5]<iBands(symbol,30,30,2,0,PRICE_MEDIAN,MODE_LOWER,i+5)-120*Point || Low[i+4]<iBands(symbol,30,30,2,0,PRICE_MEDIAN,MODE_LOWER,i+4)-120*Point || Low[i+3]<iBands(symbol,30,30,2,0,PRICE_MEDIAN,MODE_LOWER,i+3)-120*Point || Low[i+2]<iBands(symbol,30,30,2,0,PRICE_MEDIAN,MODE_LOWER,i+2)-120*Point || Low[i+1]<iBands(symbol,30,30,2,0,PRICE_MEDIAN,MODE_LOWER,i+1)-120*Point ||
      Low[i]<iBands(symbol,30,30,2,0,PRICE_MEDIAN,MODE_LOWER,i)-120*Point || Low[j]<iBands(symbol,30,30,2,0,PRICE_MEDIAN,MODE_LOWER,j)-120*Point) ObjectSet("120BPMMM"+IntegerToString(i),OBJPROP_WIDTH,44);
      ObjectSet("120BPMMM"+IntegerToString(i),OBJPROP_RAY_RIGHT,false);
   }
 }
Both of the above mentioned outcomes are contingent of price not touching the upper Bollinger (30 sample). If it does, the correction is no longer considered a clean run, but a mixed sell off and the progression low count would go up to 4, 5 or 6.
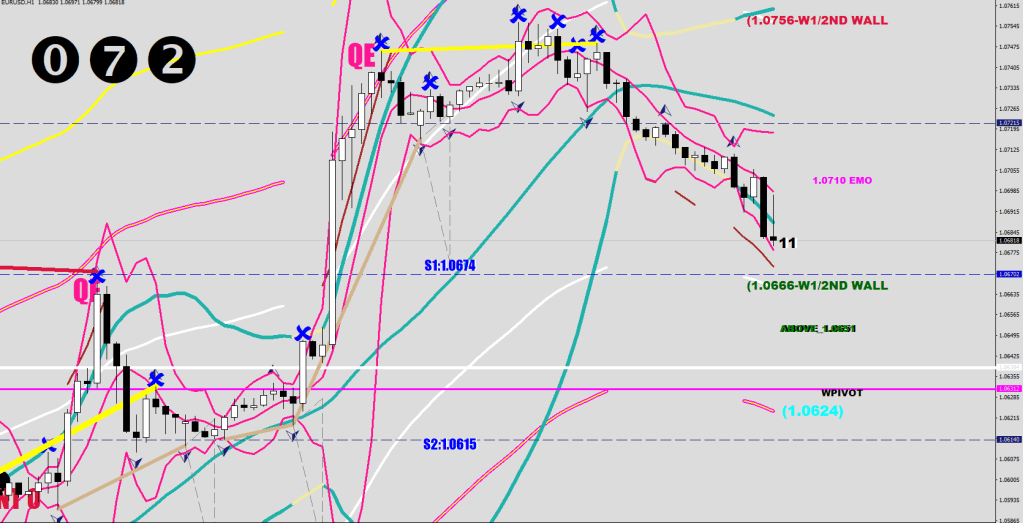
Weekly pivot at 1.0631
So what is the difference between support and support, if I already know S1 and S2 ahead of the time? They are statistical high probabilities. The actual support level printed by the market would likely fall close to these.
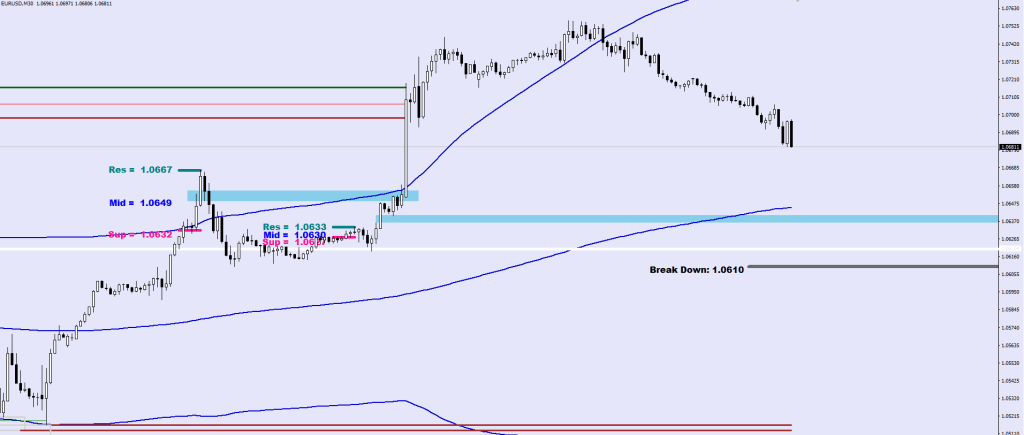
Uneven delivery highlights the 1.0635 and 1.0658 levels.
The two spin out zones have their supports almost in line, and if you imagine a line that would come to 1.0622-1.0618.
All you need to know now is wait for the plot or count 27 candles and put out a pending buy or sell the upper BB and above if that one comes accross first.
