If I had to sum up in two words the market maker’s objective, it would be trappig people.
Garden variety
There are different methods available, i.e.: Algos can fade break outs.
CTAs can provide leverage with a prolonged directional move, especially after lightening their holdings. They definitely play a role in the high volume churns.
The turnips
The question about a weekly volume churn in one direction is if it is going to get reversed the next week, making for a U-turn.
The following image shows one example for both outcones:

There is a beat the following week, that’s normal.
Notice that the red & the green walks hand in hand more often than not.

Multiple cover highs / cover lows may be the symptom of CTAs withdrawing. The following 2 images are showing the CTA cover zones.
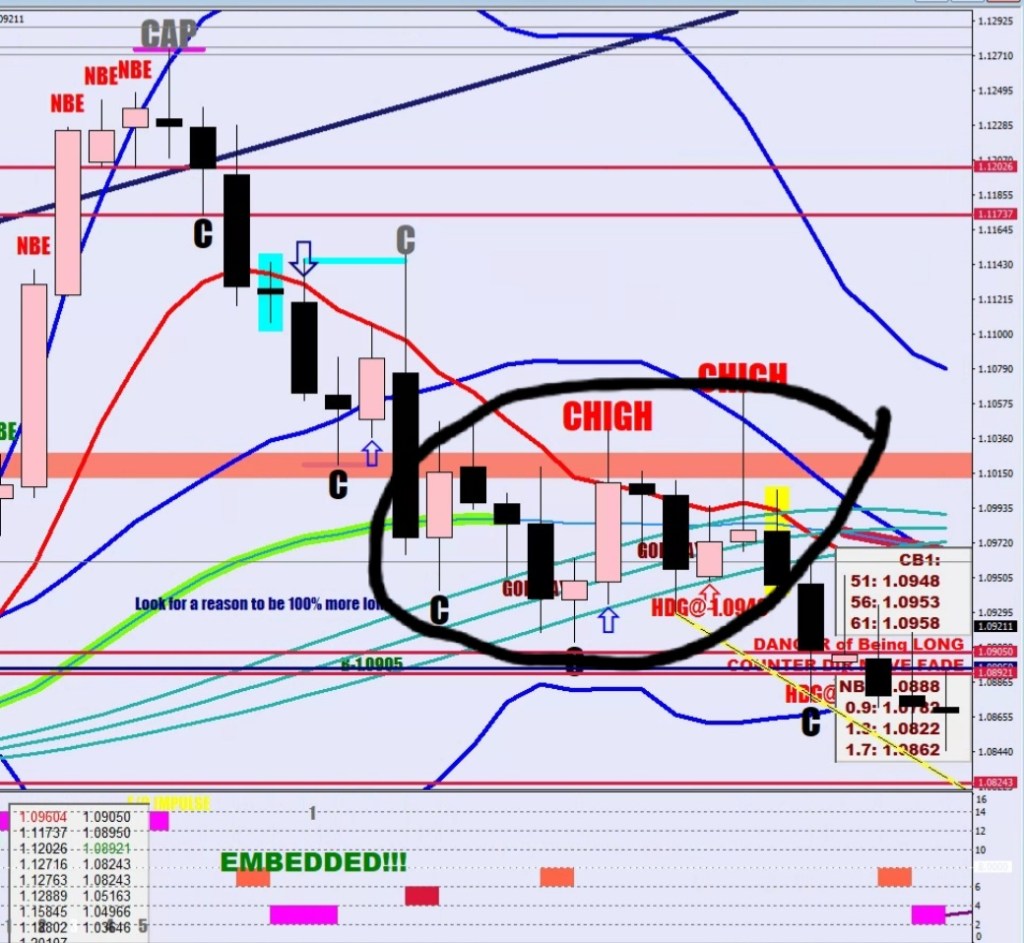
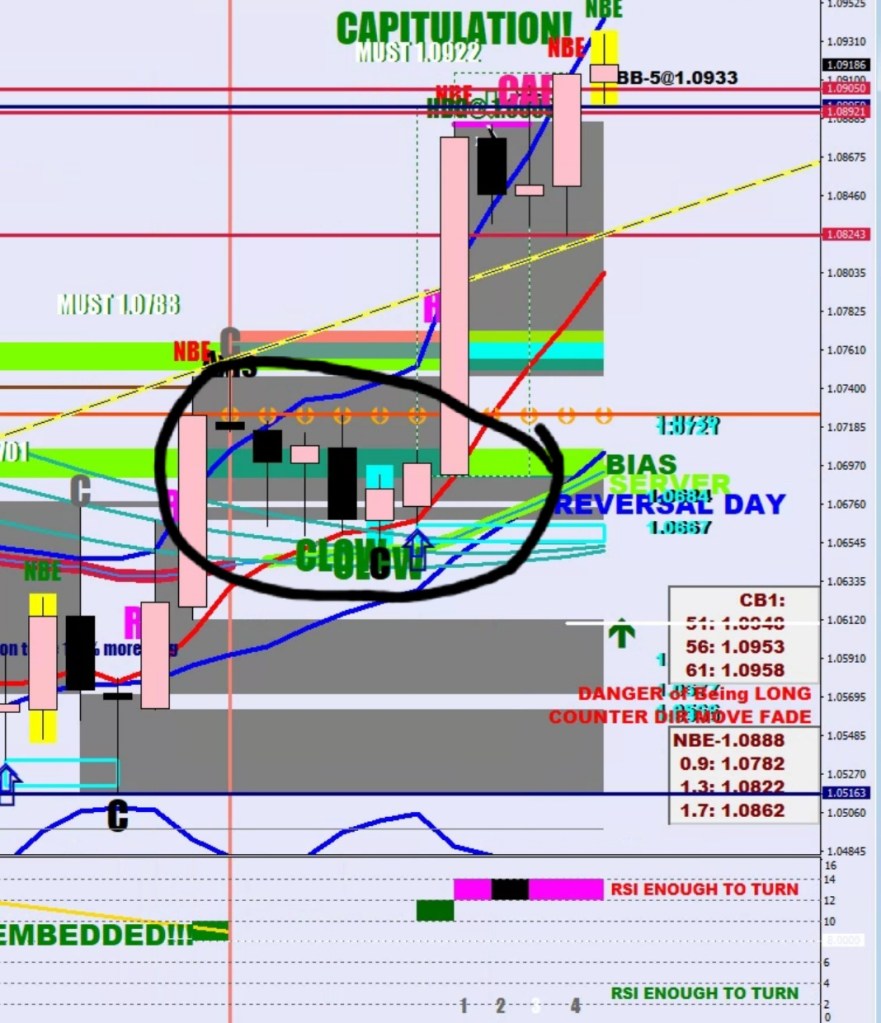
In different environments different things can be useful for projecting a high / low in advance.
The Zoo
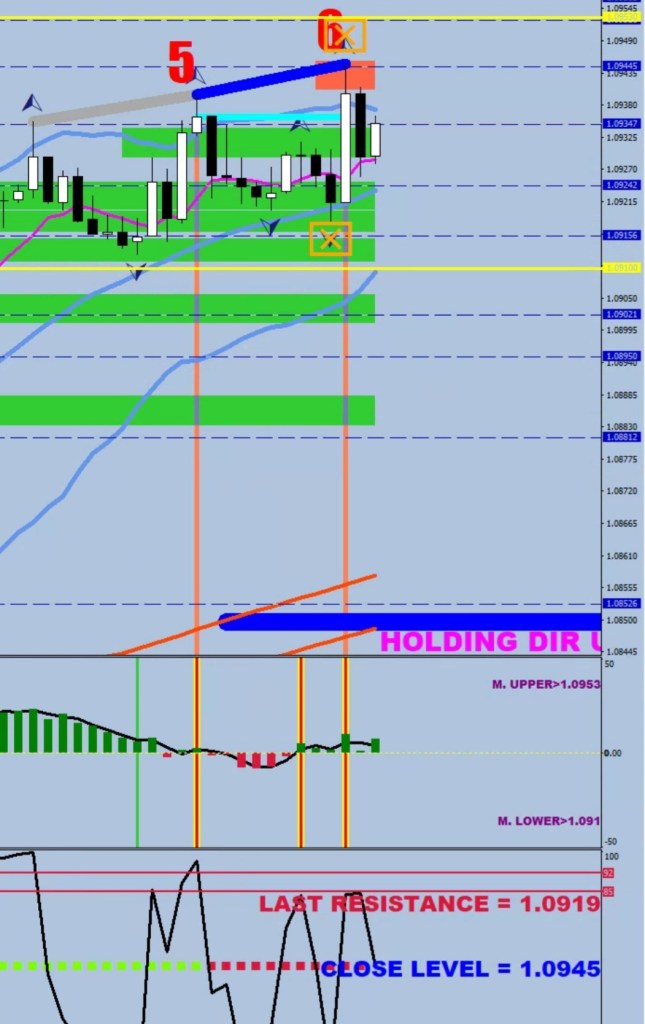
The Rabbits pointed at 1.0922-1.0952 the last time they popped up.
The Vwap oscillator (4H) is currently expressing serious doubts about the sustainability of this move.
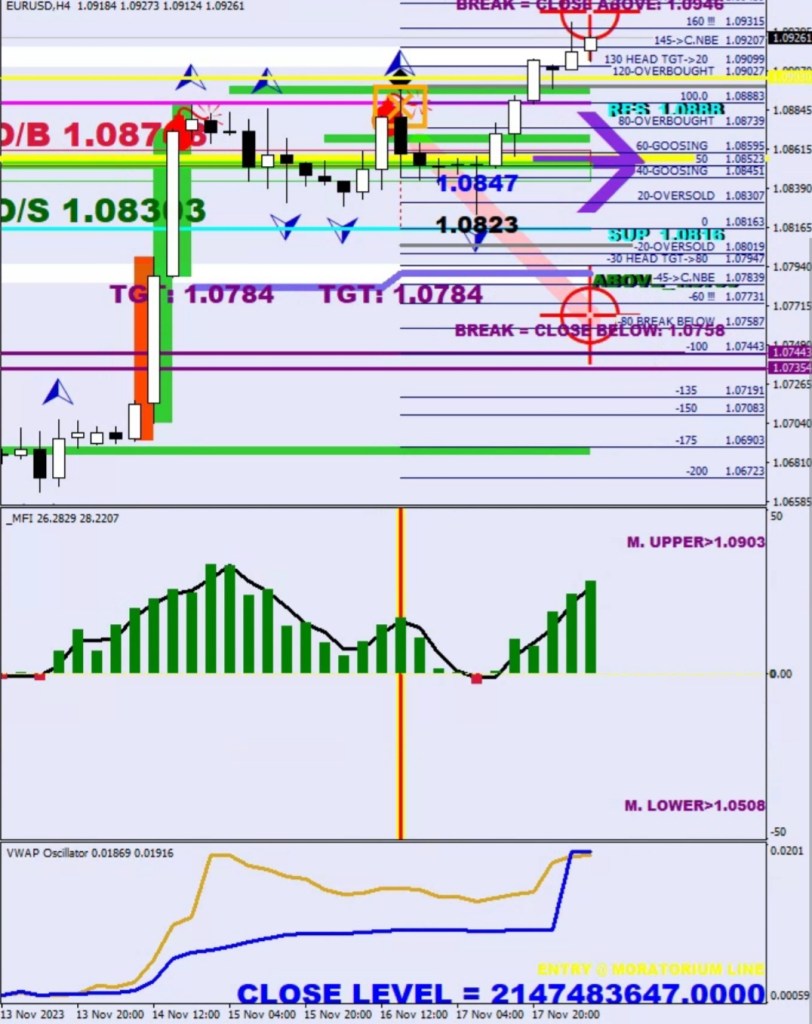
The power box is shaded and has called the extent of this move some 28x4H earlier. The green on top is the icing.

As for the “is the high in” I had invented fuzzy math.

20% (QE) + 20% (QE) + 25% (Green Ball) + 55% (Black Ball) = 110%.
At the moment the white interrupted line on the downside got violated and on the upside price fell short.

These lines were made by the 3 candles kicking in the Bull & the new Bear Market. The downtrend is about to be re-established.
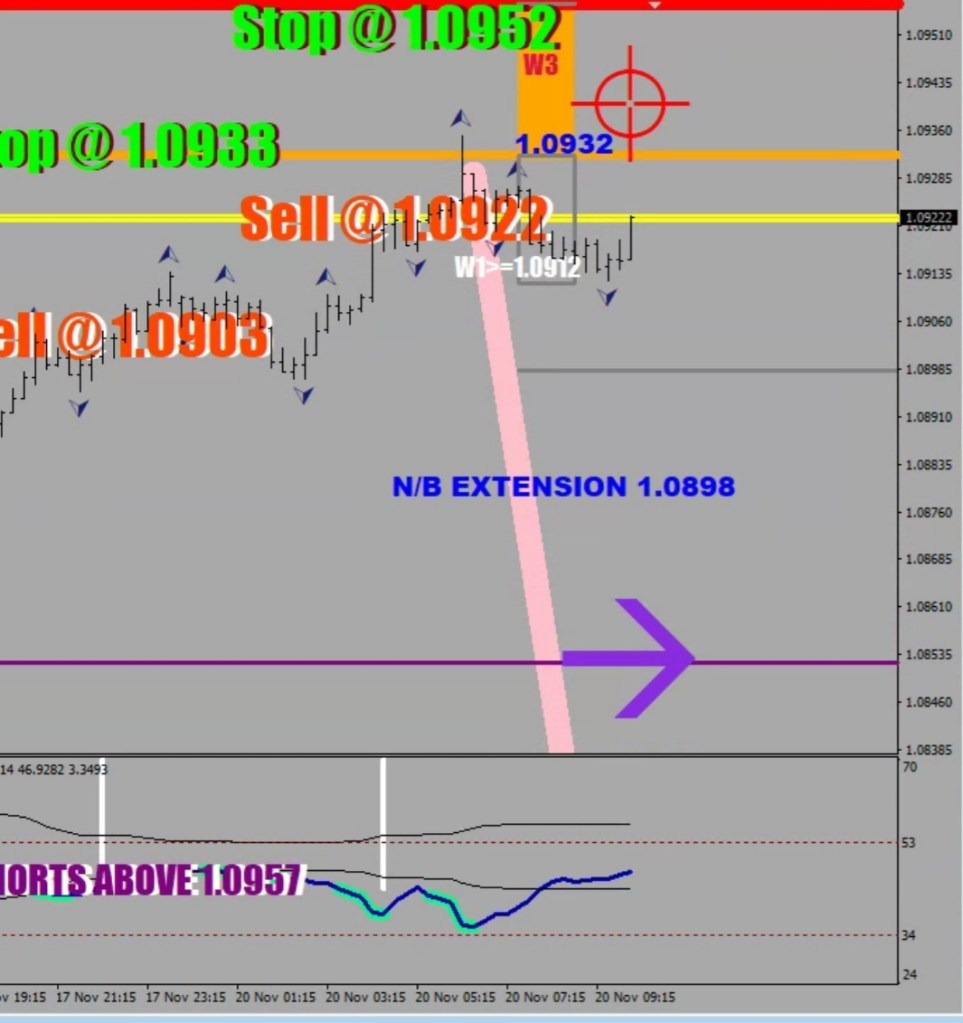
Finally, the Money Flow Beat Reversal Liqudity levels are plotted…

The gray box got already tapped into.
I had to get real about this experiment to conclude that the short term MFI extreme / beat has more relevance than the long term MFI continuation divergence.
The final divergence is finally made.