
aka the Pain Train
Now, let’s talk the second premise after the coma.

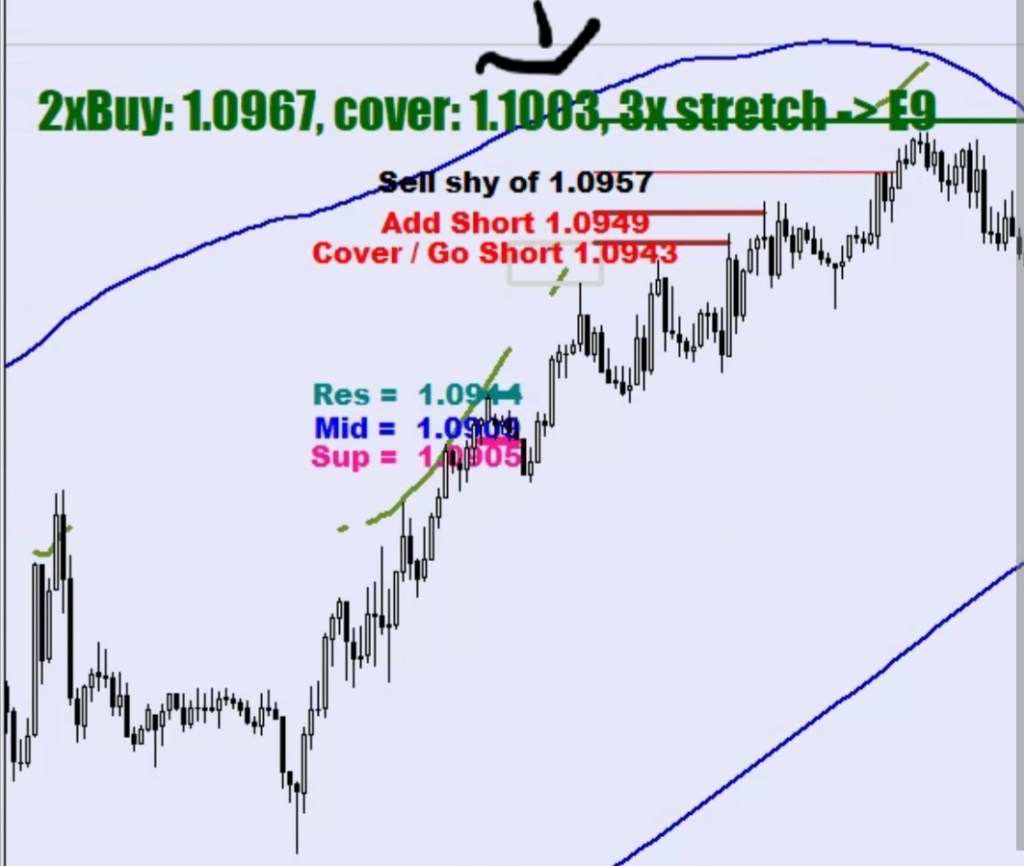
Of course, I am still measuring from the E-414 band. 3x stretch = 3x fluctuation maxiumum = 3 x 38.4 pips
The reason for wanting to see a stretch beyond 3x is that statisically that is the field from where a mean reversion is expected.
Now, the daily stochastic is reaching such an overbought level that there would have to be a higher high further down the road, a wave structure cannot end like this.
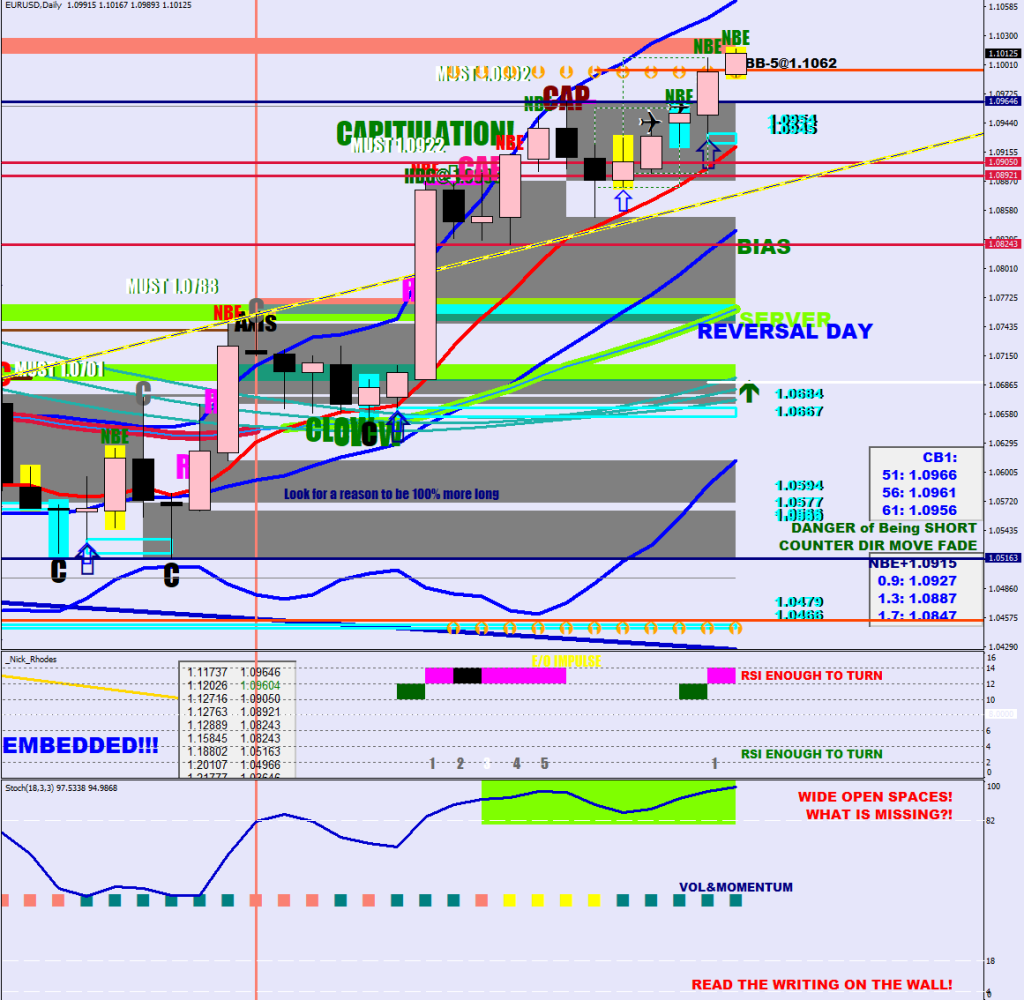
The 18-sample stoch is at 97.56%, a leg could end here, but a diverging higher high would be necessary with a reading below 95.6%.
I haven’t fixed the upside yet, but here’s an example of tracking the optimal turning depth, the numbers plotted on the magenta bricks – the blue prints are plausible, the white ones are too low or already on the way up.

Meaning, the current print would be a white number unless the day finishes much lower with a blue stochastic or would need another higher high on the following day.
There is a cyan (pro volume candle) that should react upon price pushing more into its tail.
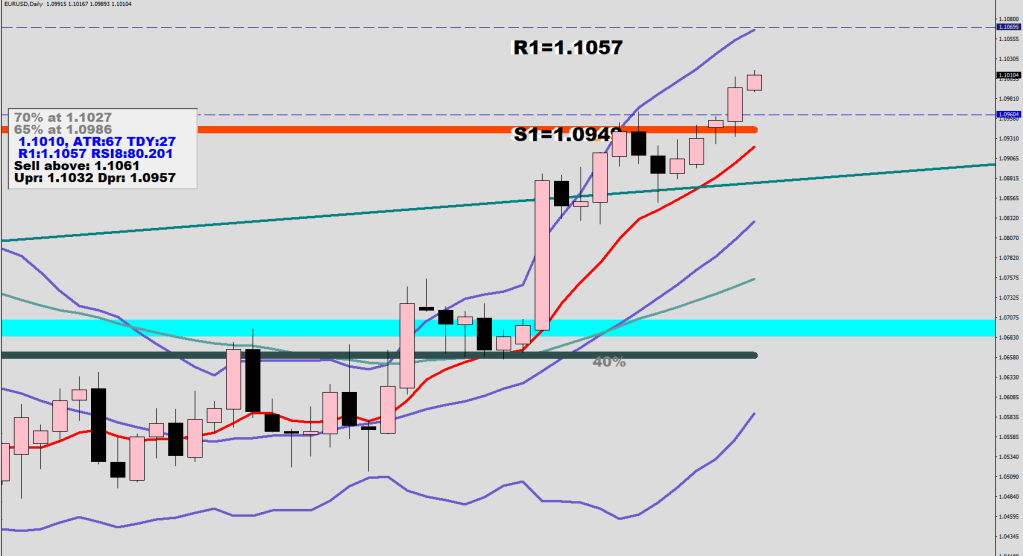
I would expect the next push up to fall shy of the daily BB.
Are we going for the Orange block?

The mean reversion is way overdue. If the CTAs have left something in the tank, refer to the daily Cyan candle (1.0933-1.0905 would be the zone to defend.)
We have started to eat away into the last money flow injection’s reversal zone, barring new money coming in again price could reverse at any moment. I could see another reach into the 1.102x, but not beyond 1.103x. If the CTAs reached max long and price stops moving higher, who are they going to be able to sell to?

I refrained so far from calling the touches on the Olive lines as First Blood, Second Blood. You know, too many movie and game references could get confusing.
