A new plot that lifts my _MFI indicator into the $99 payment clouds.
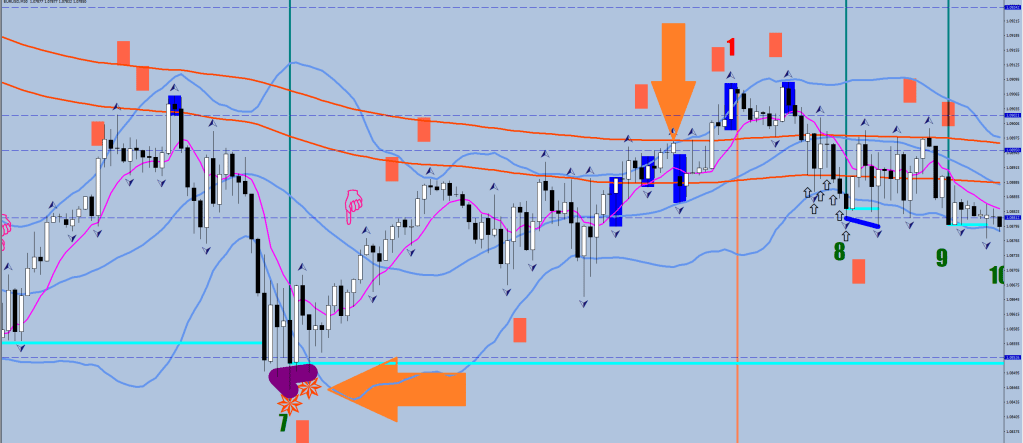
Final Divergences and Crown Royales were its domains, and now there is a Municipal Royale print that is a reminder for the next counter move would make it beyond the Municipal Trench. A guaranteed long / short that is worth its price in OrangeRed. It also adjusts the final divergence line’s color to Purple to point out the purple block below, on the CounterForce62.
if ((High[i]-iLow(symbol,0,iLowest(symbol,0,MODE_LOW,199,i+1))*10000)>95){
            ObjectSet("120BPMMM"+IntegerToString(i),OBJPROP_COLOR,clrPurple);
            ObjectCreate("120BMPXX"+IntegerToString(i), OBJ_TEXT, 0, Time[i], High[i]+10*Point);
            ObjectSetText("120BMPXX"+IntegerToString(i), CharToStr(175), 68, "Wingdings", clrOrangeRed);
      }
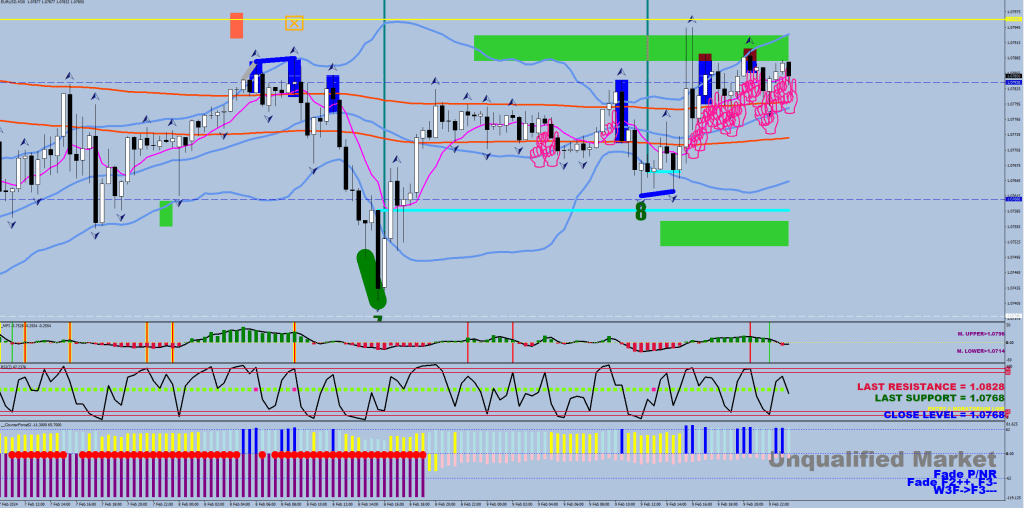
Other than the divergences, the following snapshot shows most of the _MFI’s plots.
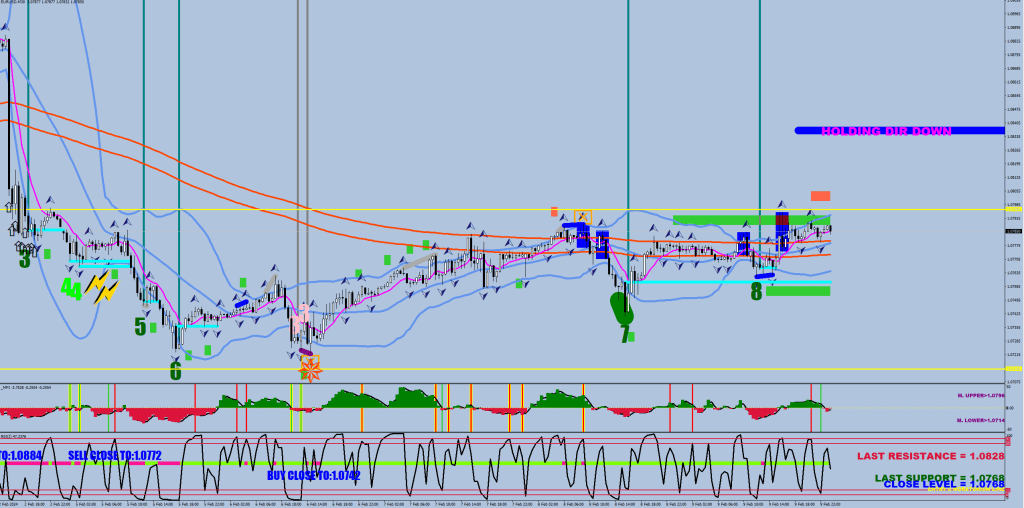
It keeps tracks of regression and progression highs & lows and numbers them figuring resistance and support levels on the way (spells out the last ones in the indicator window #2). In the same indicator window there’s a directional logic print and some action clues, i.e.: Sell Close To 1.0772, Buy Close to 1.0742.
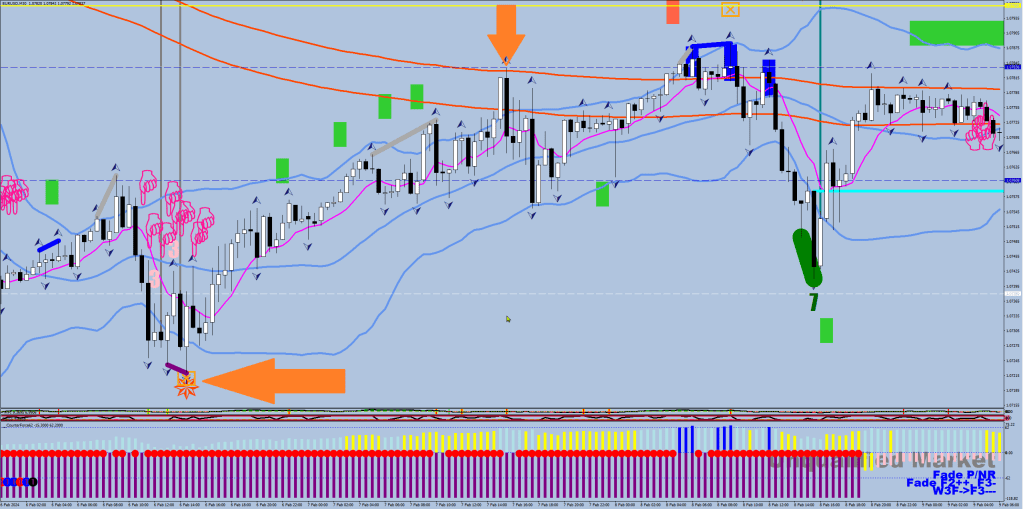
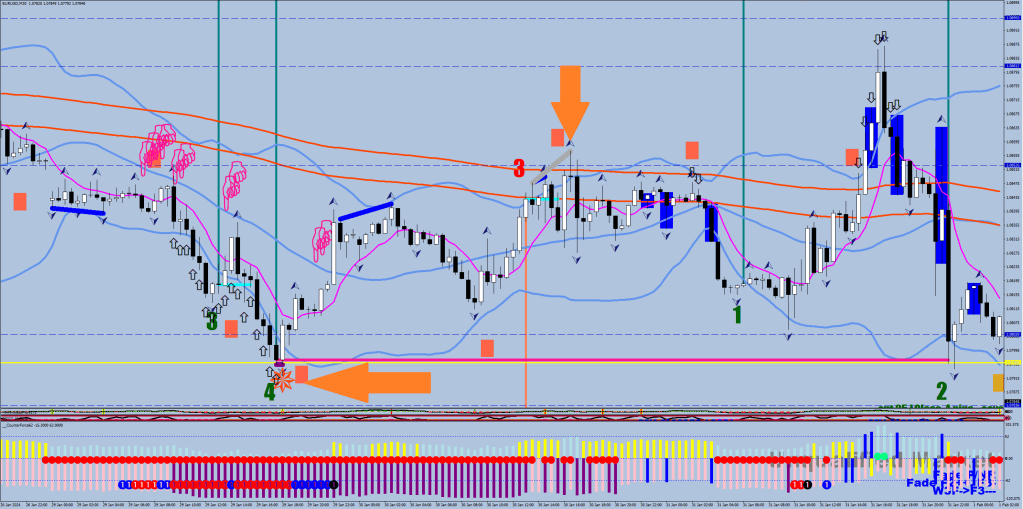
Being an MFI, the shaded humps are a 14-sample Money Flow. On the main window there are shaded Money Flow interaction boxes plotted. The yellow lines are the current range with a bit allowance. The small black arrows are calling attention to a move that is going against the grain.
Besides the final divergences that are color coded keeping the number of the progession count, it also plots Flash Gordon (momentum) divergences, which are missing the volatility que.
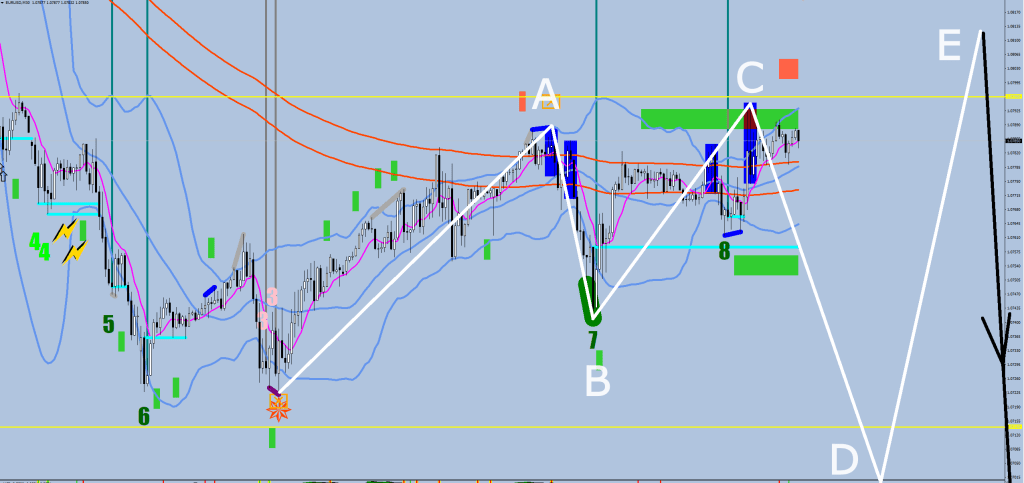
It takes understanding the current market based on the degree of counter direction volatility choke to figure out the weight of what a certain type of divergence can do, so a use of CounterForce62 along is highly recommended. The blue shaded boxes are moves into the F2 territory (200 sample). I got tired of everything being called R and S, and adopted Formula One classes instead.
The Holding Direction plot is sort of limit for a liqudity break having to hold to stay in shape.
The main purpose of course is getting helps with gauging what is happening currently with some very real prompts for an action to be taken (i.e. hedge / cut) thanks to the divergence plots, The F2 boxes (which are the last crack to keep the market in check)
The True Money Flow reversal reversal precision plots belong to Tie Machine on a less cluttered chart (by my vocabulary).

_MFI is one of my 3 indicators currently carrying a price tag of $99.

If history is any guide…

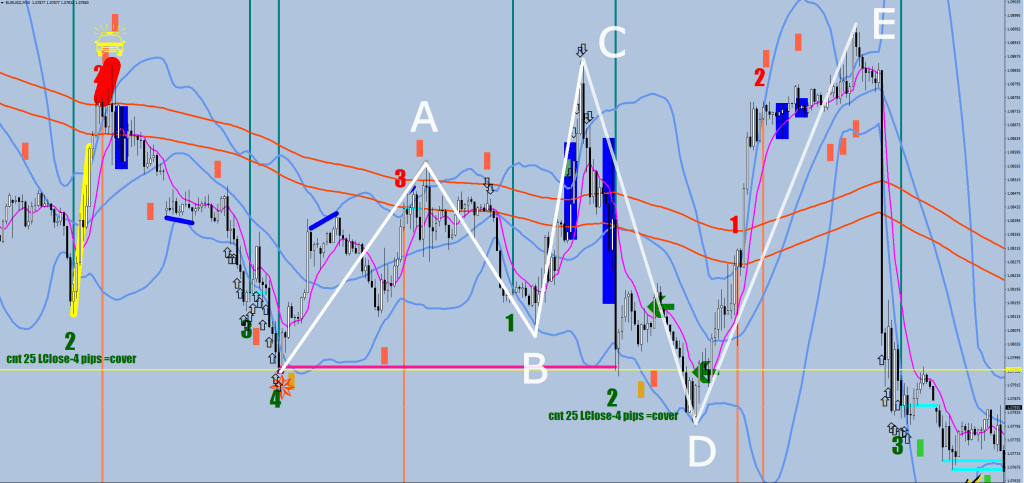
D was below the starting point by 12-25 pips.