
Read if you are into context, candles and oscillators.
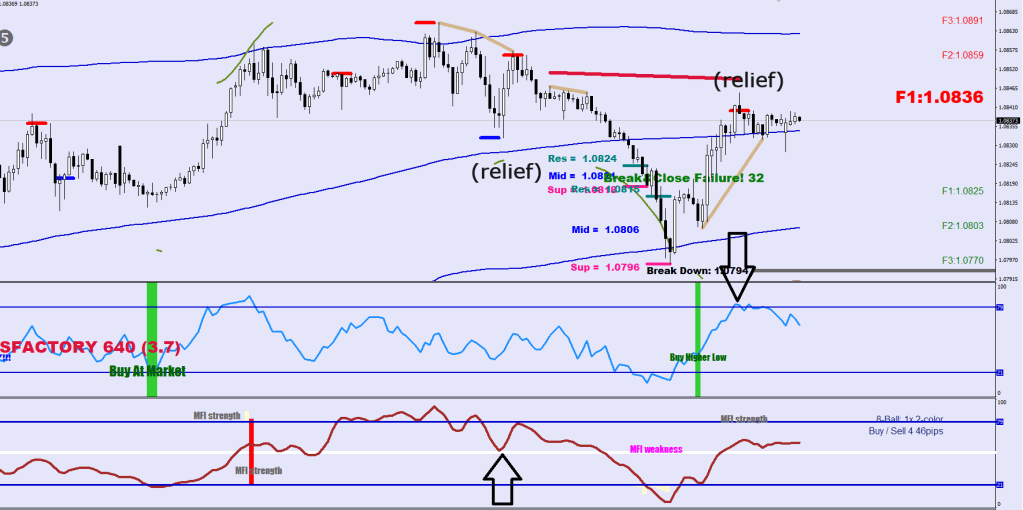
Let’s train your eyes to spot reliefs (re-calibrations).
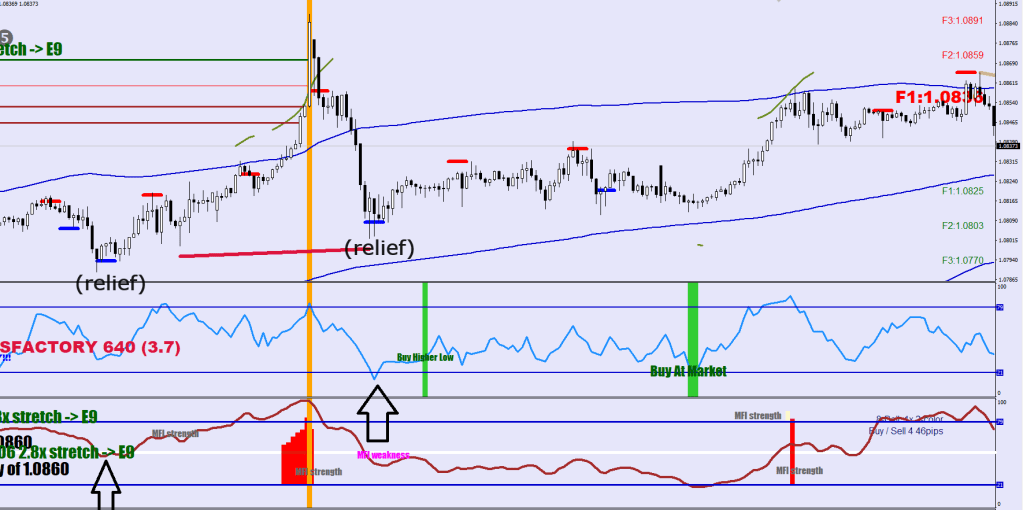
A relief is your 120-sample stochastic returning to the 50 level or your 14-sample MFI hitting an extreme opposite of the trading direction.
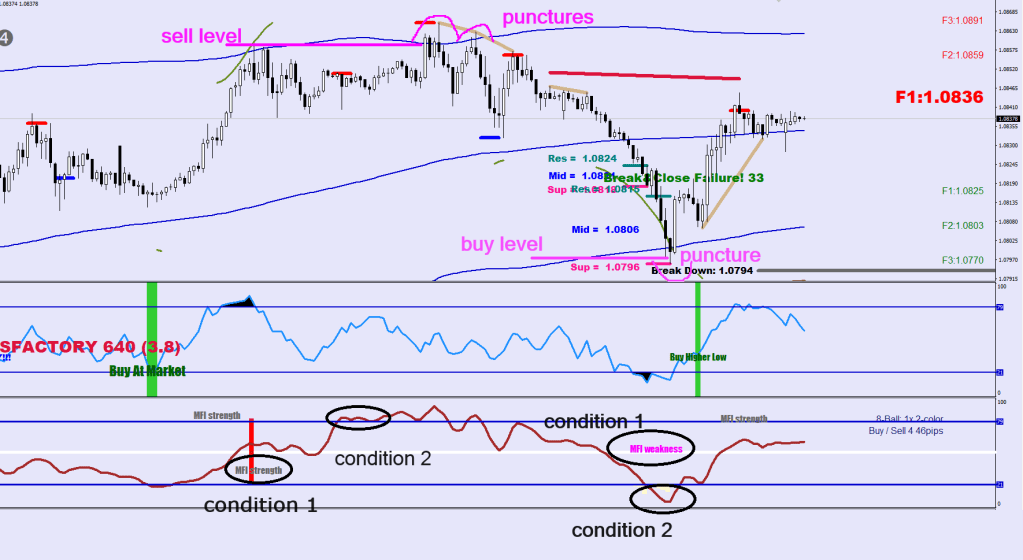
The combination of an MFI strength (/weakness) and a Stochastic strength (/weakness) provides with a level.
The puncture of this level is the action.
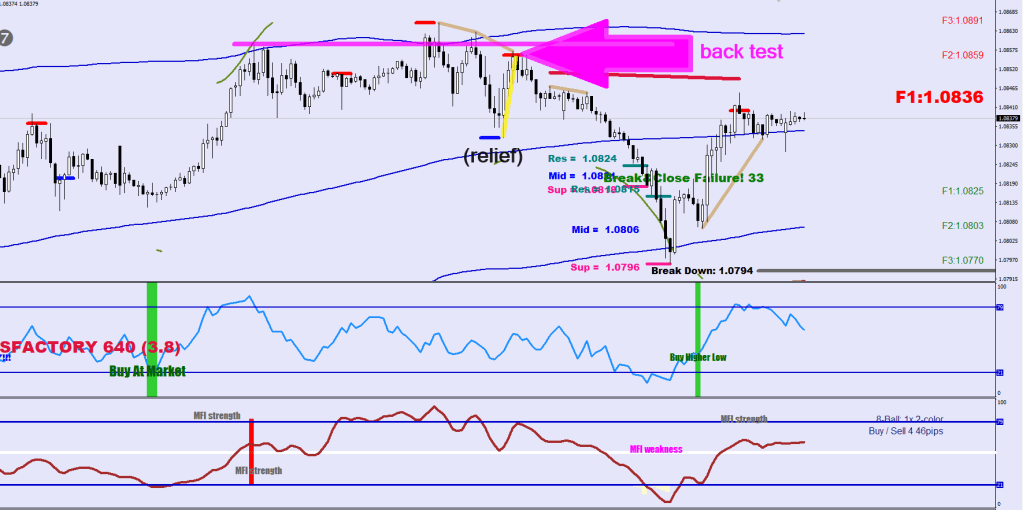
The most important thing on this chart is the yellow diagonal: after the relief the move back up was sold at will resulting in a lower high and a change of direction.
From here on the levels are provided by the conditon combos + punctures and the reliefs would occur on the upside until an MFI reversal zone would be printed and tested.
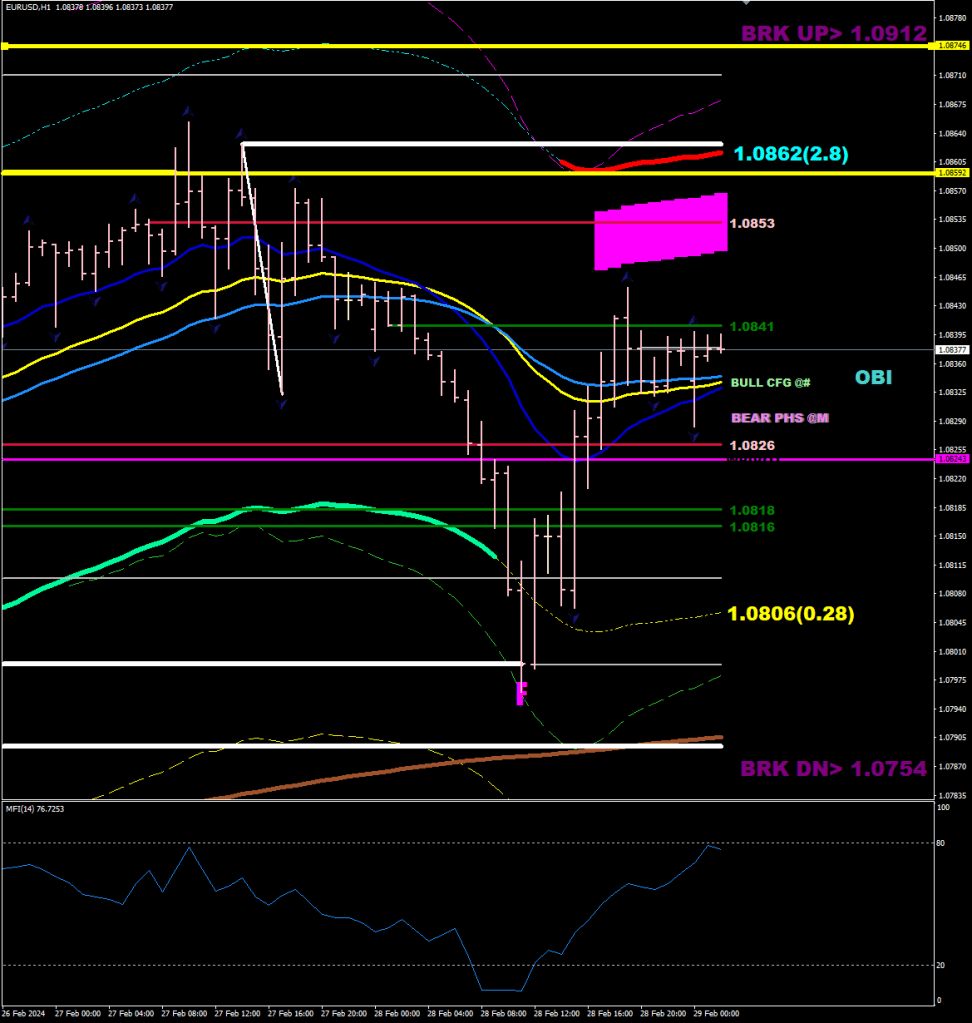
The interrupted green line is the E-16 displaced by 35 pips. The volatility expansion was too sudden, and this relief move back up is the punishment for it.
