
I’m in volatility advisor mode now.
I have added two limiter lines to the Bands routine, 2.8x fluctuation maximum away from the mean.
 int FSize=32;
 double FMax = FSize*6/5;

  E9P[i]=iMA(symbol,0,9,0,MODE_EMA, PRICE_MEDIAN,i)+FMax*2.8*10*Point;
  E9M[i]=iMA(symbol,0,9,0,MODE_EMA, PRICE_MEDIAN,i)-FMax*2.8*10*Point;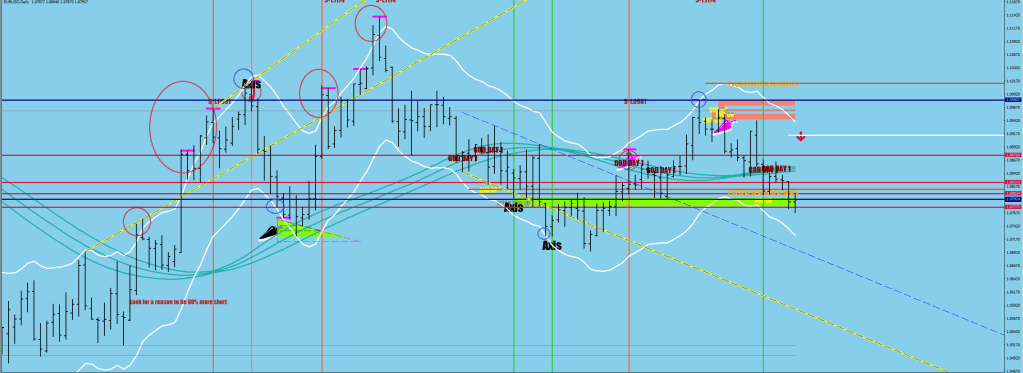
The blue circles are grazes, the red ovals are going outside for more than once intraday / barely getting outside. The red ones are in “normal” volatility times, the blue ones are the symptom of “bare minimum” volatility.
The following things are observations.
Of course, the red-blue on the first run up talks of vaning volatility, hence you see the correction next.
If the first print is a blue one, than the following day can give a signal regarding continuation by taking out the high or low. The two examples on the downside got ultimately exceeded by 55 and 27 pips before the divergent turns materialized.
Obviously, the minimum expectation now is that the volatility would have to get high enough to catch up to the bands to even start the divergent turn (if the following day of the graze would be a lower low first).
When the volatility was still normal, you could go by the Nick Rhodes vertical lines to spot the Measuring leg and then play the textbook daily higher high lower low trend thing after a one day break to arrive at the Divergent leg (outside the white lines again) to find an optimal exit.

The reason why Cem Karsan is looking for a blow off top on the S&P is that when volatility starts increasing, the market would start accelerating in the direction that it’s been going first before setting up the reversal divergence (push & echo).
Who knew that you don’t even need Bollinger Bands let alone Vix to measure volatility, simple EMA dispacements can do?!
(the reference)
