
Two things.
One is the coda at the end of a complex wave.
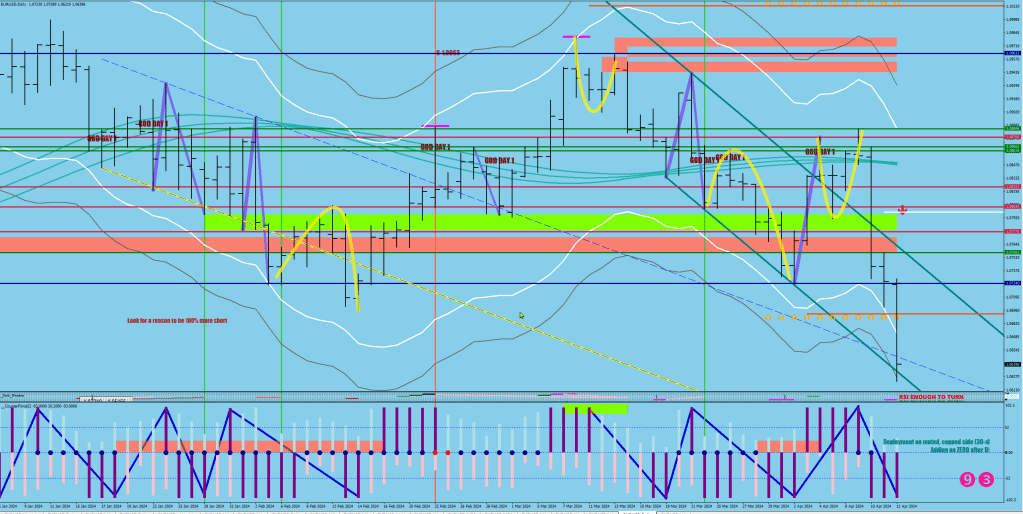
The yellow bows, that usually result in a higher high / lower low after a bow with F2 to F3– counter directional volatility at the peak of the arch are to toll on the ringer.
The second thing is the divergence I talked about is relative to the consolidation mean (as opposed to the E-9) to spot a reversal. This is difficult to measure for a number of reasons: due to the change in the 3-day ATR which is one factor, and also the multi timeframe nature of looking for the consolidation mean on a 15 min metric and charting on the 1 hour.
I went with red ovals (14 pips VS 11 pips) and as a bonus added a diamond substitute for the consolidation tying them together.

An F2 bow back could bend price to 1.0682+ before making the lower low around 1.06.

