
Let’s talk about the importance of measuring from the 200 sample 30-min lows and highs to have a read on the balance of power.
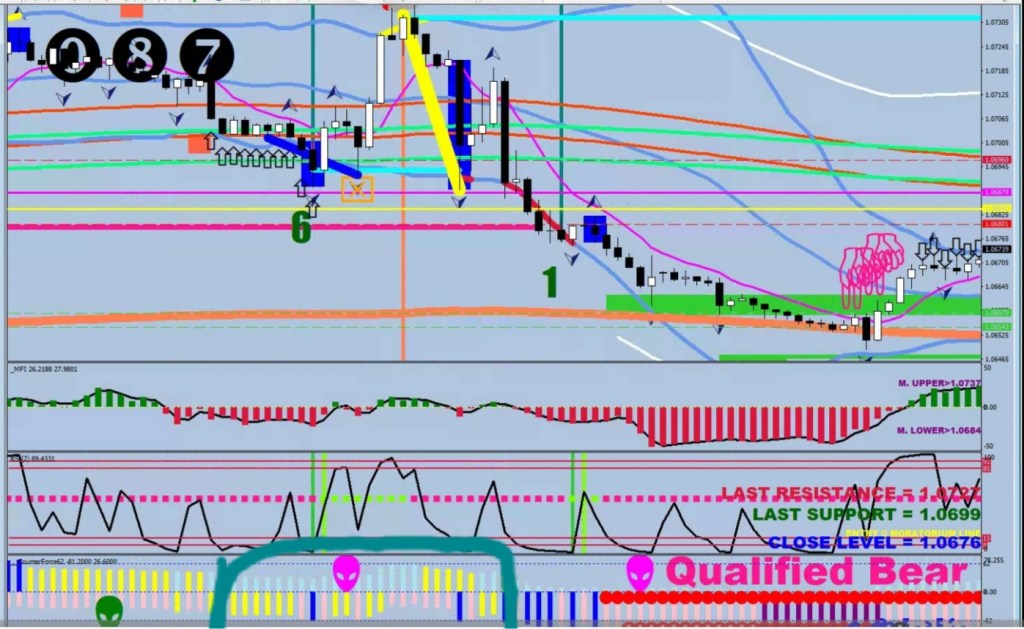
Who was winning during the green box rally? Bulls managed F1 moves (yellow on the upside) whilst Bears tagged F2 (blue.)
The yellow diagonal highlights a devisive move, the subsequent bounce is a scale in sell.
The recurring money flow adage is that money has to preceed the stochadtic, otherwise that’s a failure upon the print of the divergence. Now, let’s throw some resistance and support in the mix.

The last P/NR had no hopes to be broken, as the money flow breeze did not privide sufficient lift. The most the market managed was a scare on the shield of the 2.8 Safety Line (magenta highlight). The statistical minimum trip was 1.0648. It got within 1 pip of that.

In the opposing corner the failed move got price close enough that dome more money could take care of the break. Remember that I drew that white line for the support?
What’s the damage? Keeping track of the zigzag on the daily it was clear that purple bars were needed next which meant a minimum move to 1.0753-93 pips = 1.0660.
You cannot see that the RSI2 got sufficiently oversold at the low, but that was the case a few pips lower, it was magenta temporarily as it was at the swing high for some of the day.
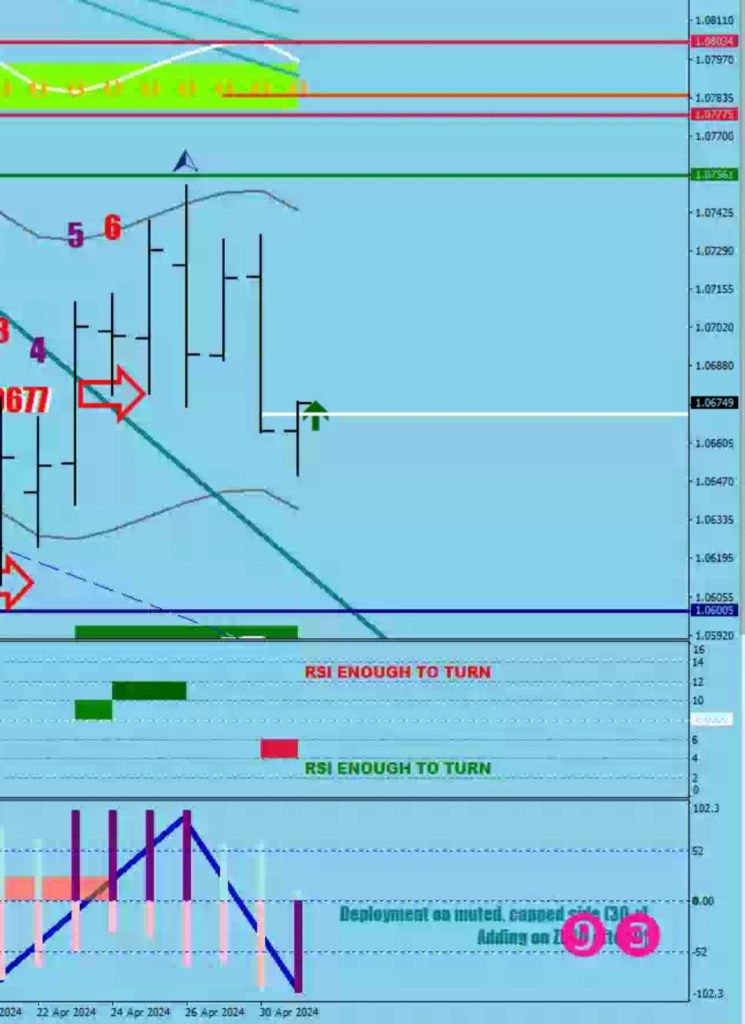
I think you should be preparing for a rally, maybe a Wave C with that house on.the hill.
A lower low first to utilize the money flow reversal zone? For sure a possibility for more liquidity, but not a must as the gray box was already touched.
…

