
The first thing to say is that this is a converging, sideways market.
The largest dilation between the 21 EMA and the 59 EMA was 60 pips in the last 40 weeks, so the swing highs and lows made within the year are likely safe.
The second thing to notice is the U-turn with a gap down and a gap up around the slanted line.

Classic trap, like an abandoned baby is. The space between the interrupted brown lines is the mean zone.
The third thing is that a good swing high has 90+pips to the first weekly black close from the high.

Well, the market just violated the last one which may mean a change of direction.
Now, the volume part.
Look at what happens when the weekly volume shows professional activity.
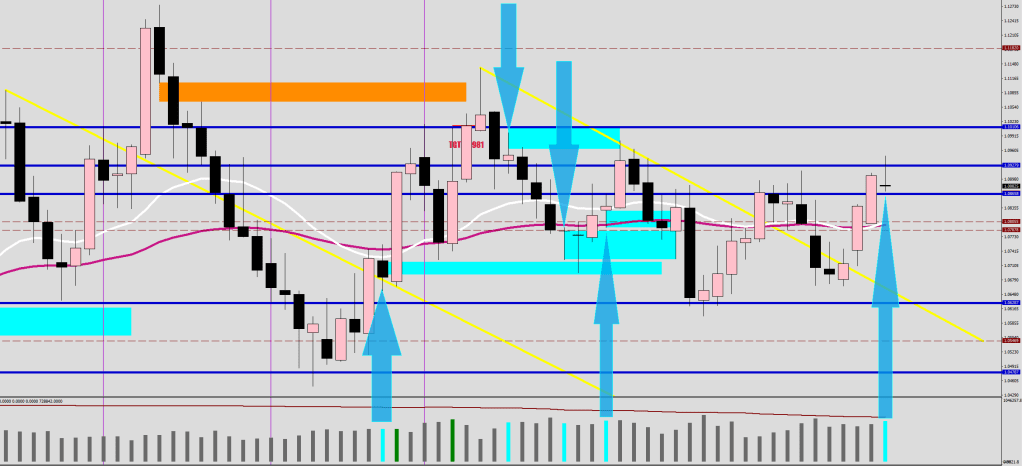
Yes, you get a doji-looking thing as all the available volume gets absorbed/hijacked.
The color of the candle does not matter. What does matter is the previous body. You are going to see a continuation in its direction the next week. Out of the previous 4 arrows, these were either setting a trap (50%) or reinvigorated the trending move (50%). Since we are not coming off of a major swing low, my money would be on the trap. The arrow pointing down managed 28 pips, the one pointing up added another 120 pips.
I’m thinking of seeing 90-110 pips at the peak next week from 1.0949. That’s 1.1039-1.1059.
This, what you just went through was a technical analysis.
I’m saying this because this guy does something else.
“But if I draw the trendline like this” – nobody gives a hoot about how you are drawing lines.
“90% off lifetime membership” – to what exactly?
“If you want my help…” – you cannot help yourself, and export your ill bias to everyone else.
“I was wrong…” – no shit. Please avoid this kind of “streetsmart” crap.
