
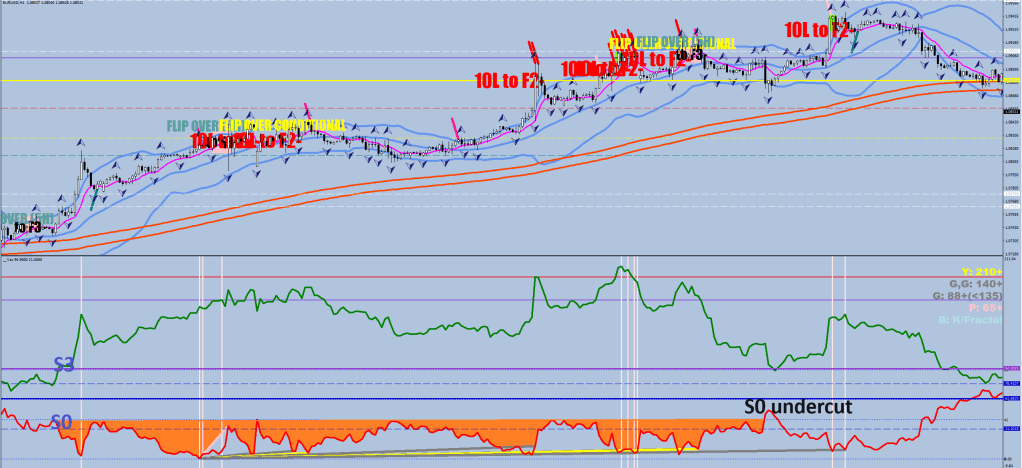
S0 inferno is the market going parabolic, and the counter-directional volatility not going beyond 41 pips (200 hours sample). Orange shading.
 ObjectCreate("DEVELOPE"+0,OBJ_TEXT,indicator_window, Time[0],41);
  ObjectSetText("DEVELOPE"+0,"                            S0: "+DoubleToStr(NormalizeDouble(iHigh(symbol,0,iHighest(symbol,0,MODE_HIGH,200,i))-400*Point,4),4),19,"Impact",clrGray);

  ObjectCreate("DEVELOPE"+1,OBJ_TEXT,indicator_window, Time[0],63);
  ObjectSetText("DEVELOPE"+1,"                            S1: "+DoubleToStr(NormalizeDouble(iHigh(symbol,0,iHighest(symbol,0,MODE_HIGH,200,i))-600*Point,4),4),19,"Impact",clrBlue);

  ObjectCreate("DEVELOPE"+2,OBJ_TEXT,indicator_window, Time[0],79);
  ObjectSetText("DEVELOPE"+2,"                            S2: "+DoubleToStr(NormalizeDouble(iHigh(symbol,0,iHighest(symbol,0,MODE_HIGH,200,i))-760*Point,4),4),19,"Impact",clrBlue);

  ObjectCreate("DEVELOPE"+3,OBJ_TEXT,indicator_window, Time[0],95);
  ObjectSetText("DEVELOPE"+3,"                            S3: "+DoubleToStr(NormalizeDouble(iHigh(symbol,0,iHighest(symbol,0,MODE_HIGH,200,i))-940*Point,4),4),19,"Impact",clrPurple);
The trade-off is that when the market flips, the brakes won’t work either.
The flip? If you use my MFI plot that has red shading below the original 50 reading, you would see that the top fractal had a negative (upside down print).
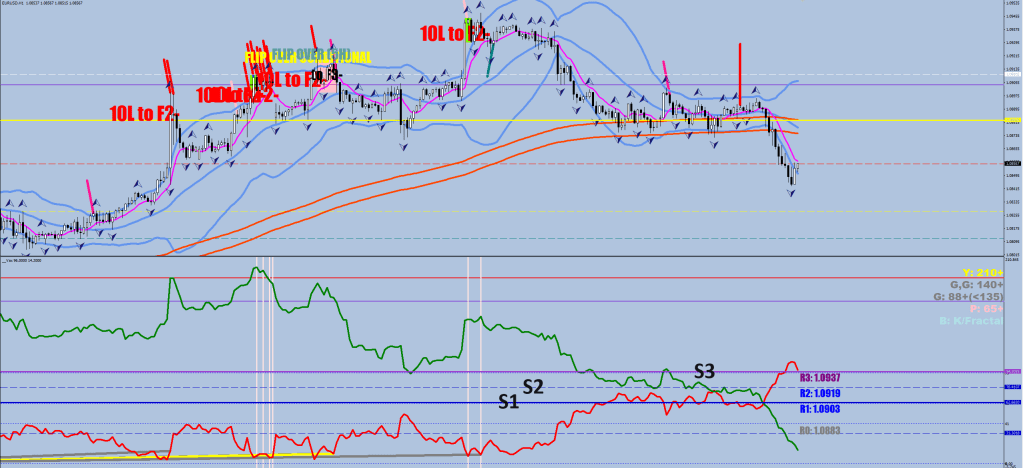
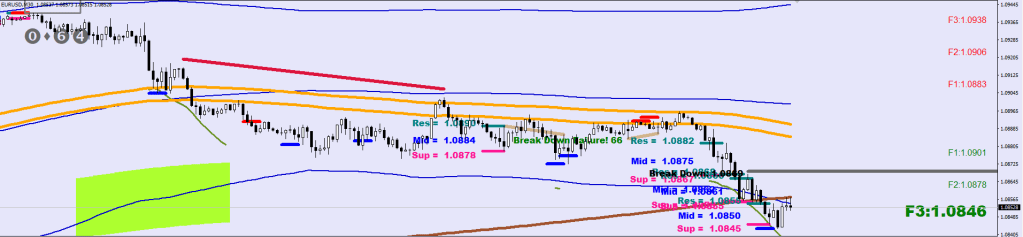
The brakes, S1 and S2 did not hold, S3 was just undercut.
This is the first Full Discharge, and the guidance is a bounce back to the hourly E-44 first.
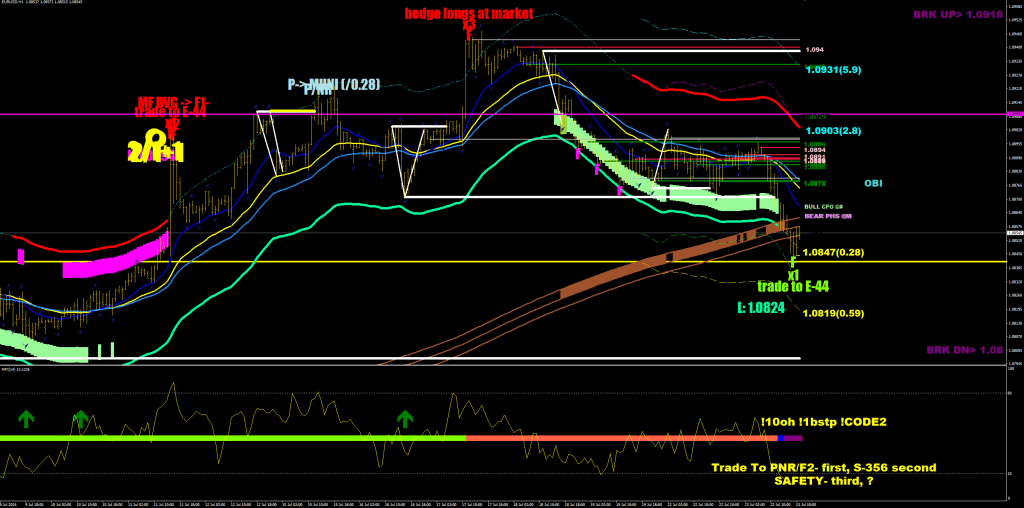
Since the S-356 band is ascending, this should be a fake-out.
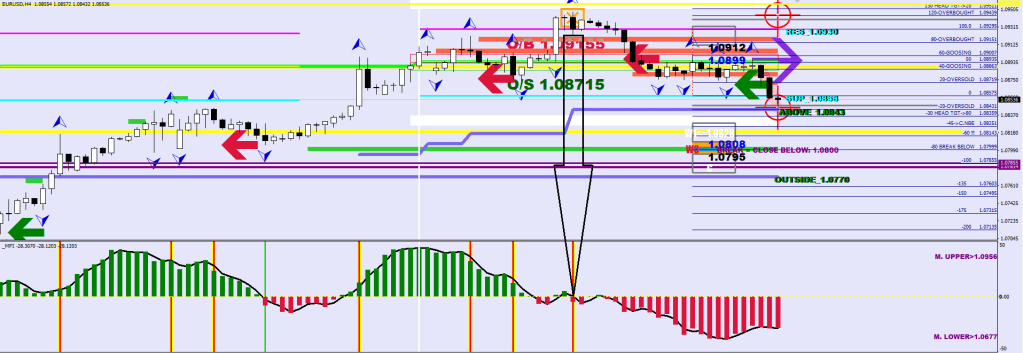
The P/NR print is at 1.0921. F2 minus is 1.0901. There is a possibility of a serial unraveling thanks to the column of Spinners left on the way down.
My Dreamscapes album (#17).
