The first deeper correction was brought on by a gray volatility divergence / last effort print.
For the gray divergence in general you are looking for an hourly fractal candle (200 sample new high) that closes back down by 1/3. It is important that it would take 2 more candles to close below the 8 EMO.

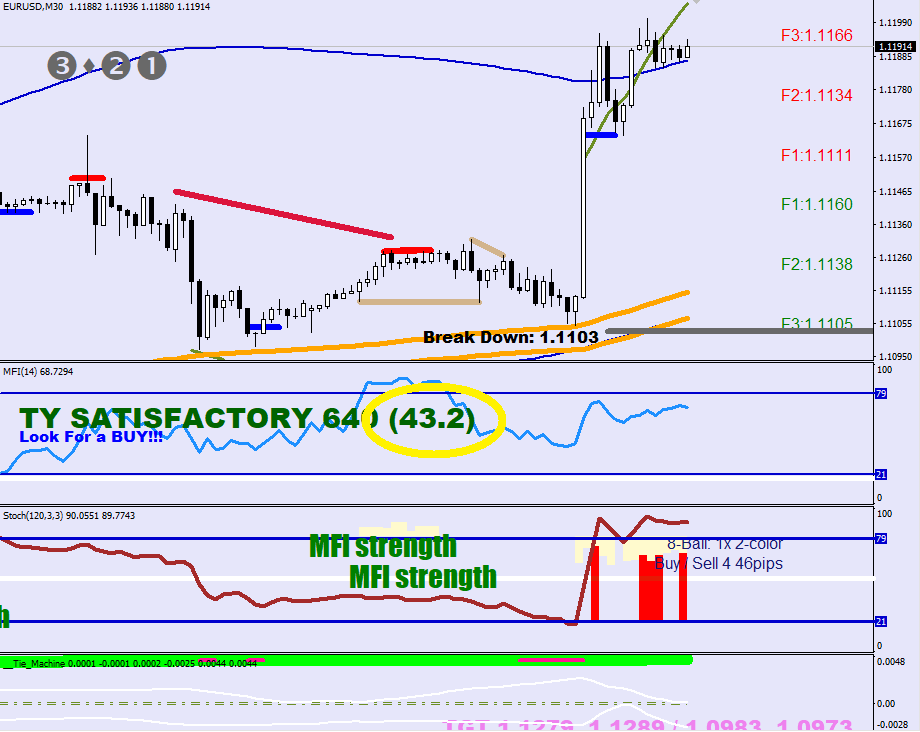
The last effort decline is a charge on the 30-sample BB that gets almost missed and the next candle makes a low below the 8EMO (red) or the following does (yellow).

The correction itself got down to S3. This ABC move had an 8&8 red dot symmetry.
The yellow volatility compression divergences have been useless. The reason is that the price can get back below the 8EMO within 2 hours. This is not enough separation.
This correction had a 5&5 red dot symmetry.
In both cases, the correction low and the end of wave red counts were in different locations.
With this rally, there has been one gray divergence. The first peak did not become a divergence, as it was not a fractal print.
What was the same in both highs is the re-connect with the 8 EMO before the last push 20, 40 pips higher. What’s missing first then?
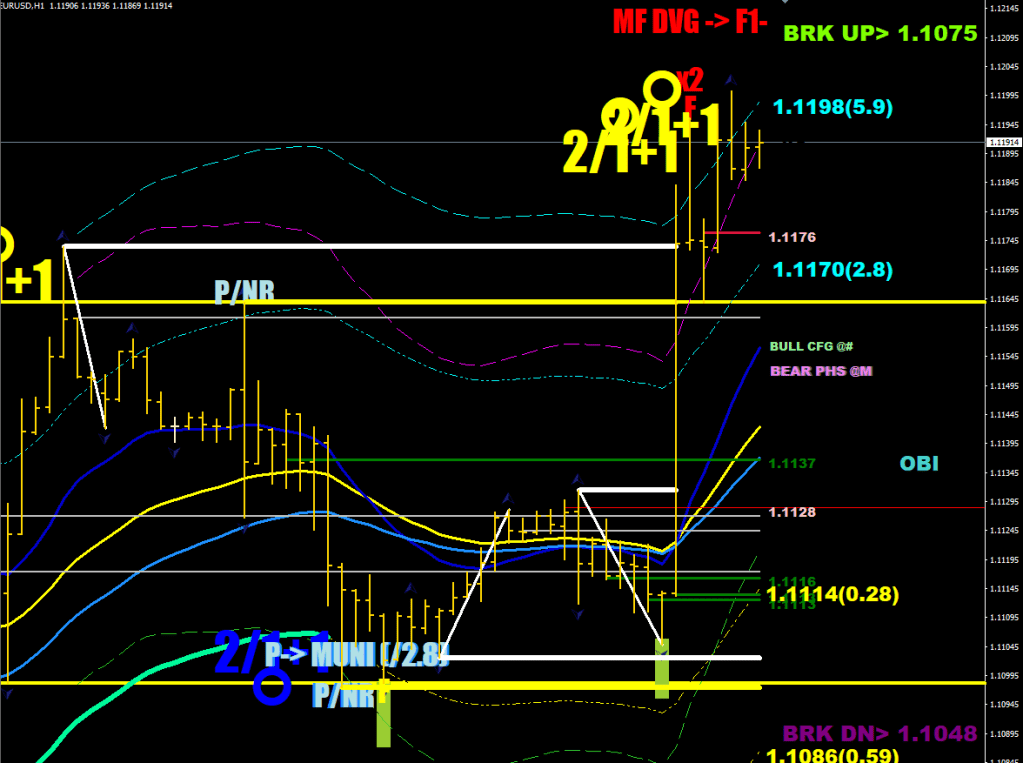
The good news is that the first gray divergence should prompt the reunion with the magenta, where you could overhedge for a new high 8-26 pips beyond 1.12
Could see a quick drop / a prolonged sideways move or a combination.
1.1175 – three times out.
They purchased the first E-level dip.
There should be a higher high printing next week and for a Swing High print, the close would have to be 91 pips below the most recent peak.
What should follow after that is a Swing Low that would have to be at least 266 pips below.
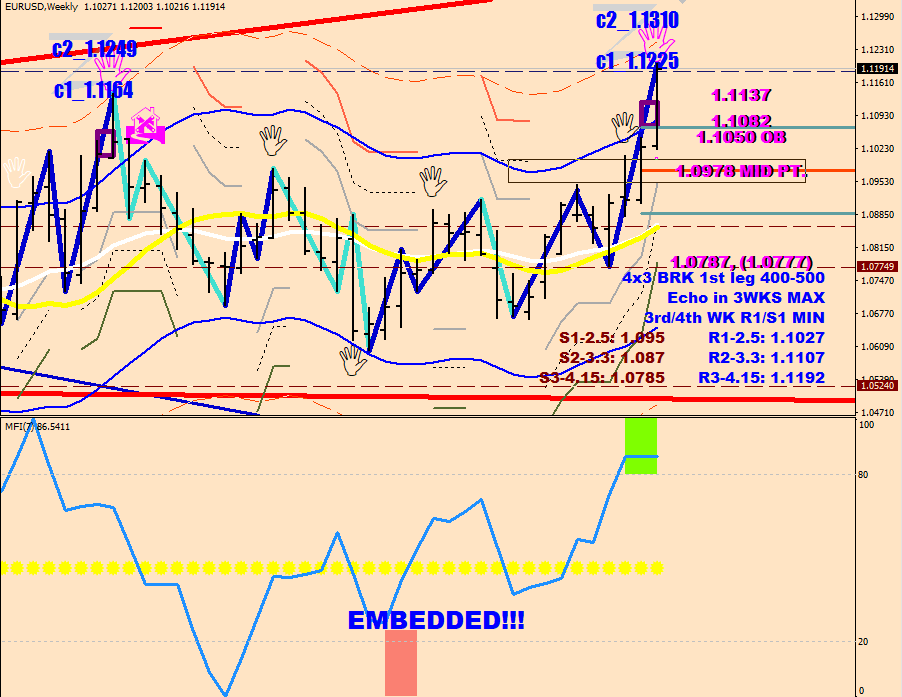
This is why the 1.10 support calls are off. A wave 4 down could stop at the S3 cca 1.11 and that’s about where the volatility lines should converge.
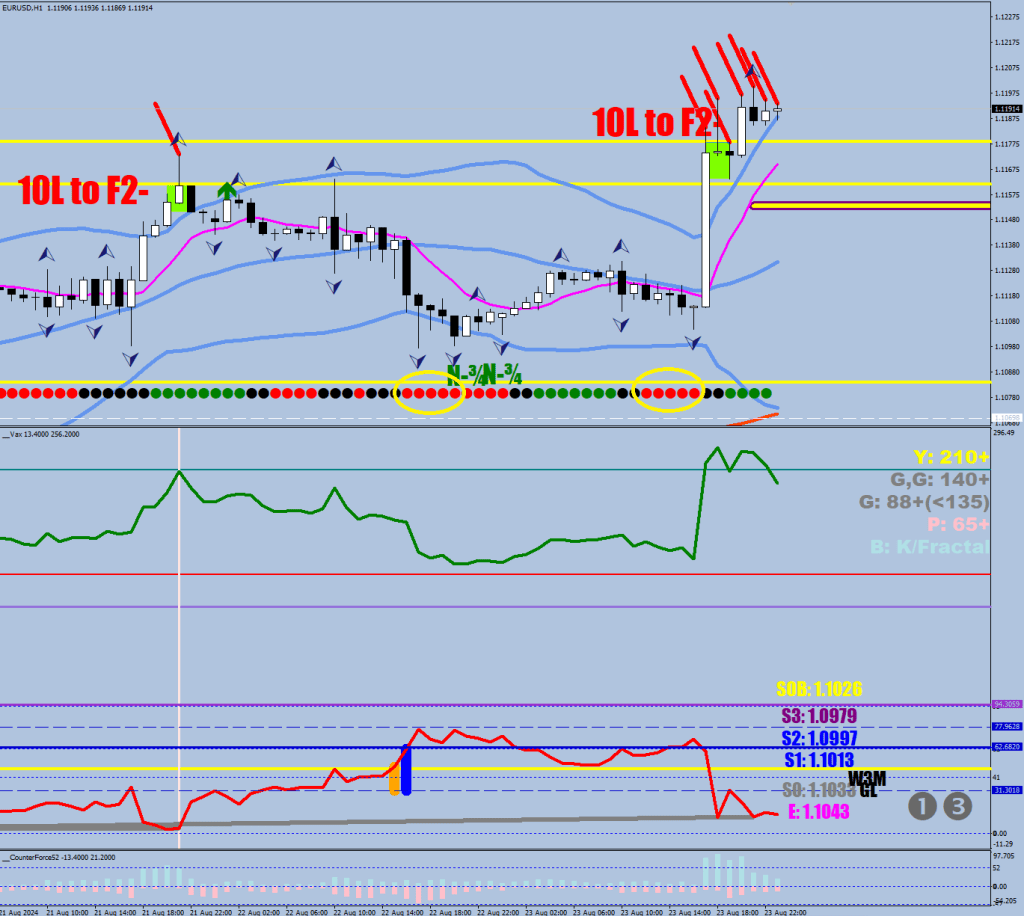
The E-9 is coasting above 1.1080 right now, and the dilated 30-min E-414 Band to E-712 (43 pips wide) is going to have to prove impossible to cross if the swing high isn’t for real.
So, 1.1090-1.1060 for a Wave 4 low or below 1.0940 for a new swing low.
Interestingly the weekly Push plots at 1.1225, echo at 1.1310
The purple square is the expectation of the pullback between the push and the echo.