
Come, learn some trading.
There are measurements that are relevant. You should remember them.
For instance, it is possible to anticipate ahead of time the location of the first HH or LL after a section of acceleration. Fade heavily 10-13 pips out. If you want to make sure to get some fills, put out something at 4, 8 pips.

Similarly, with the knowledge that a thrust is bound to follow the HH/LL print you can be in the move by at least taking on a full hedge (if you have holdings in the other direction) 25 pips out and keep on adding (overhedge) all the way to 49 pips.
LL 21min. calls for a minimum of 21 pips retracement.
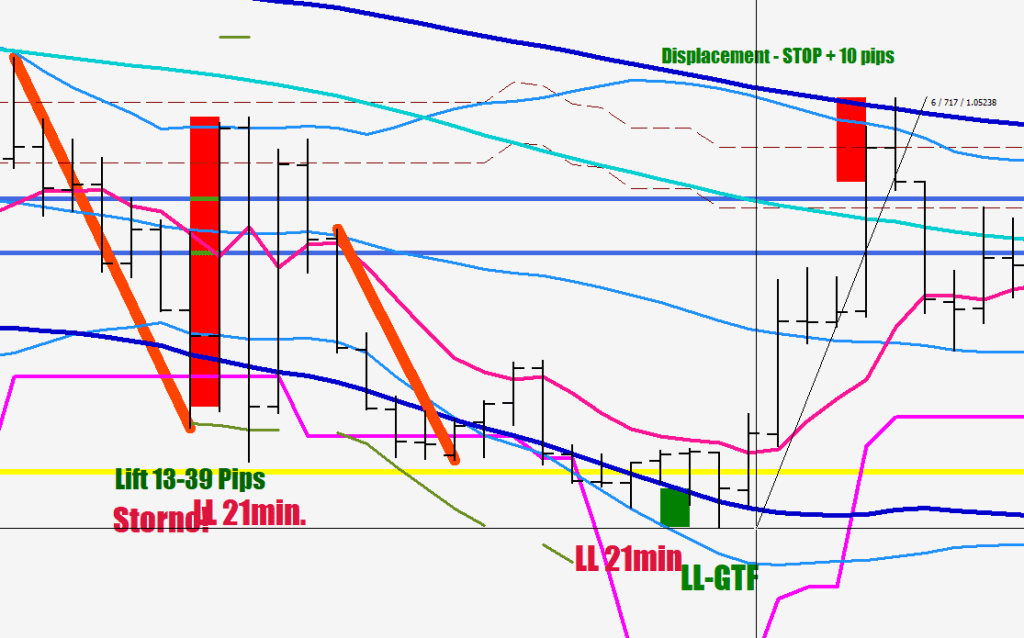
An LL GTF is good for 50-80 pips.
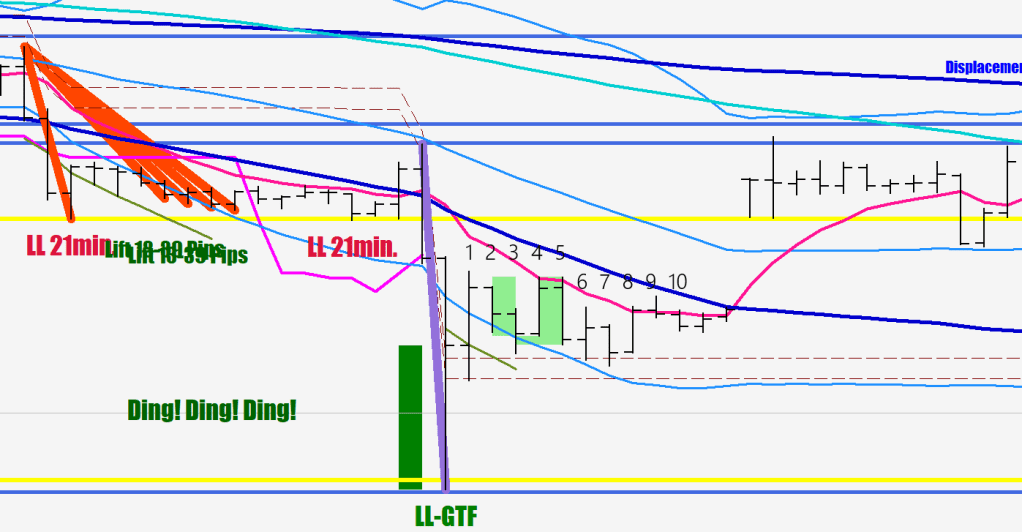
What is the practical use of an expression like “nothing goes up in a straight line”?
Once there was a downside Thrust (pruple), the first le up sould be at least 50pips, most likely would fall short of the 80-pip line, and in an absolute extreme there should be a 45-pip pullback after a 100-pip leg up – meaning that you would at a mimnimum get back the money for anything that was opened 65 pips off the bottom, and the trade is not likely going to go against you more than 15 pips.
See, this is an environment that you can plan in ahead by having some statistical understanding.
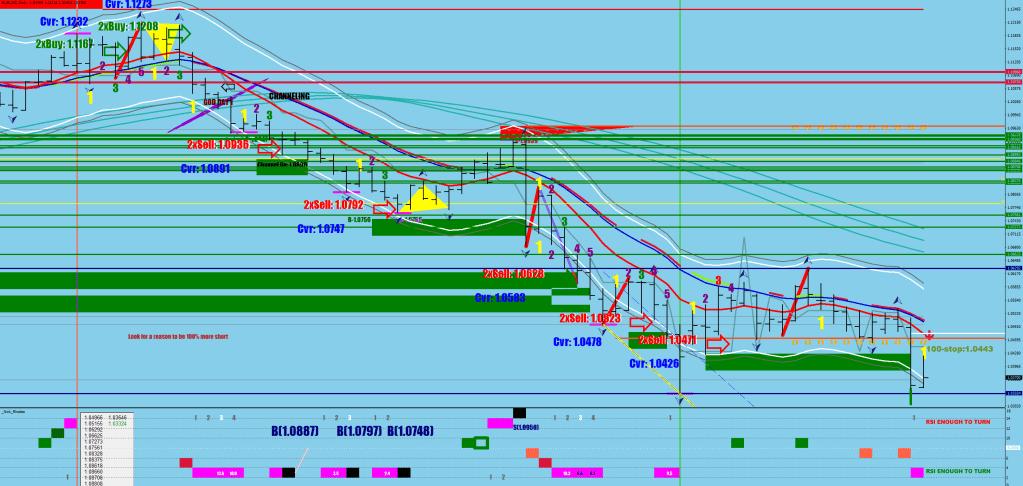
Once the price has diverted from the 8 EMO a great deal, after crossing it, you start to count the following hours. By the 10th hour you should have the lowest low that the first deeper correction will make. One shallow correction would be followed by one deep. Actually, the example I brought has the lower BB for a substitute of the 8 EMO, because of the peak volatility at the end of the last leg down.

The stretch multipliers are in fluctuation maximum from the E-9 band. A 4.5x stretch used to be normal volatility years ago. Now these are rare reading.
See, even time can be useful for knowing when to cut holdings. Particularly right before a 60-pip gap up.
I’d say, scaling out of shorts during the 10th hour is a sesible move.
They tried some pilot buy at the Goosing level, but ultimately price has made it to the support level relative to the consolidation mean.

This does not look bearish. An uncomfortably deep bow back.
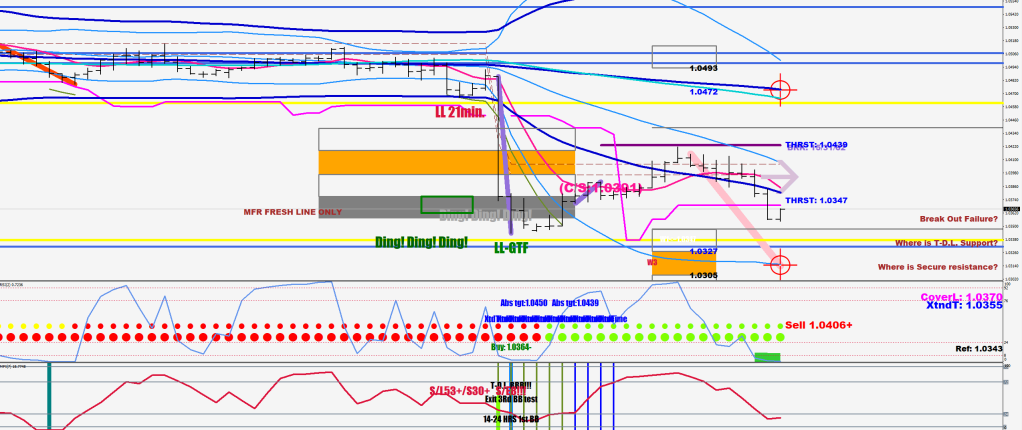
It won’t be bearish until a new acceleration gets printed. And for that the MFI would have to go below 14. Sure, it could coast lower in the next hour. When that happens, you can always hedge yourself back at the 8 EMO.
//////////drive down
      if ((Low[i]<L80[i] || Low[i+1]<L80[i+1] || Low[i+2]<L80[i+2] )
      && iHigh(symbol,0,iHighest(symbol,0,MODE_HIGH,10,i))-iLow(symbol,0,iLowest(symbol,0,MODE_LOW,4,i))>460*Point
      && (Low[i]<cover[i]+100*Point || Low[i+1]<cover[i+1]+100*Point || Low[i+2]<cover[i+2]+100*Point)
       && (MFI[i]<14 || MFI[i+1]<14 || MFI[i+2]<14)
17 was the low reading. Funnily, the money flow did not get oversold enough to qualify.
There could be a bow back bending the price back from the daily E-9 or a bit beyond (red line), these triangles (yellow) take 3 or 4 days to print, meaning a higher low near here on Tuesday, but a visit of 1.0460+ is very likely first.
…cry wolf, time to worry…

After the post there was a 14 print, and now the acceleration has been confirmed. It is most likely a trap, because the entire push is happening outside the 240BB.
