
As it turns out I had the wrong flowchart.
Here’s a complete re-haul.
The steepest trap is a capitulation thrust, as people’s short term memory/fears will be keep on fading the return trapping themselves more and more.
If the pendulum swings outside the playfield a calibration~mean reversion gets kicked off.
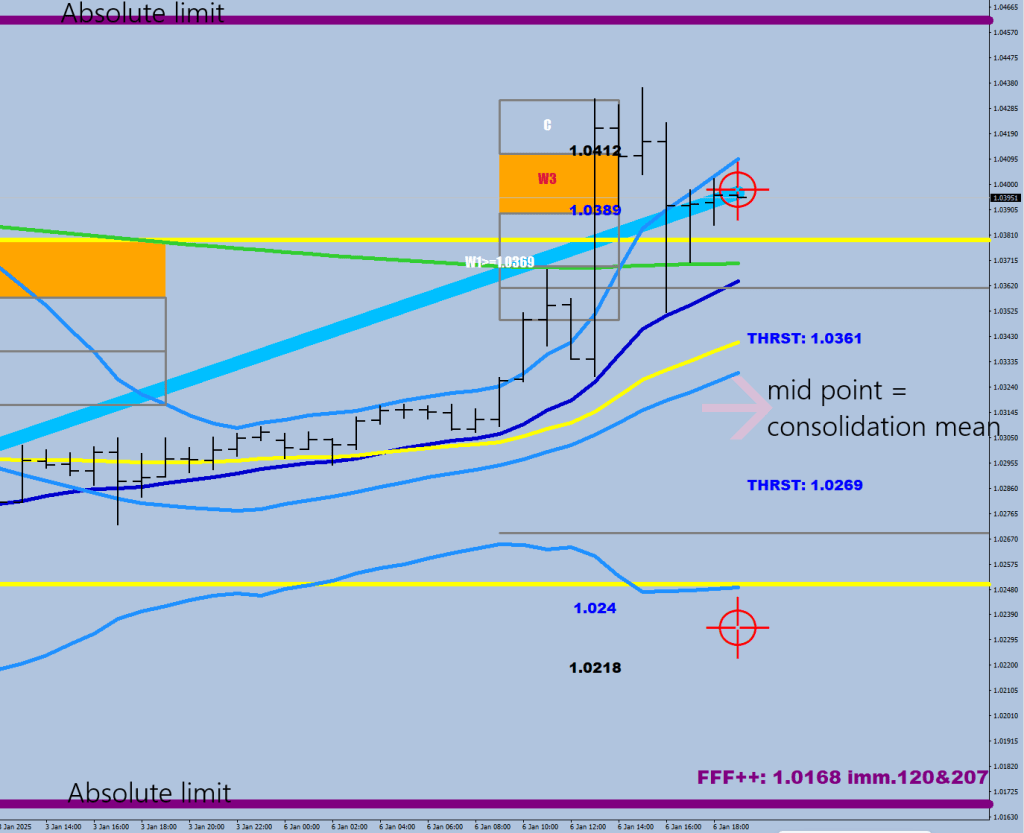
The pendulum swings between the absolute limits.
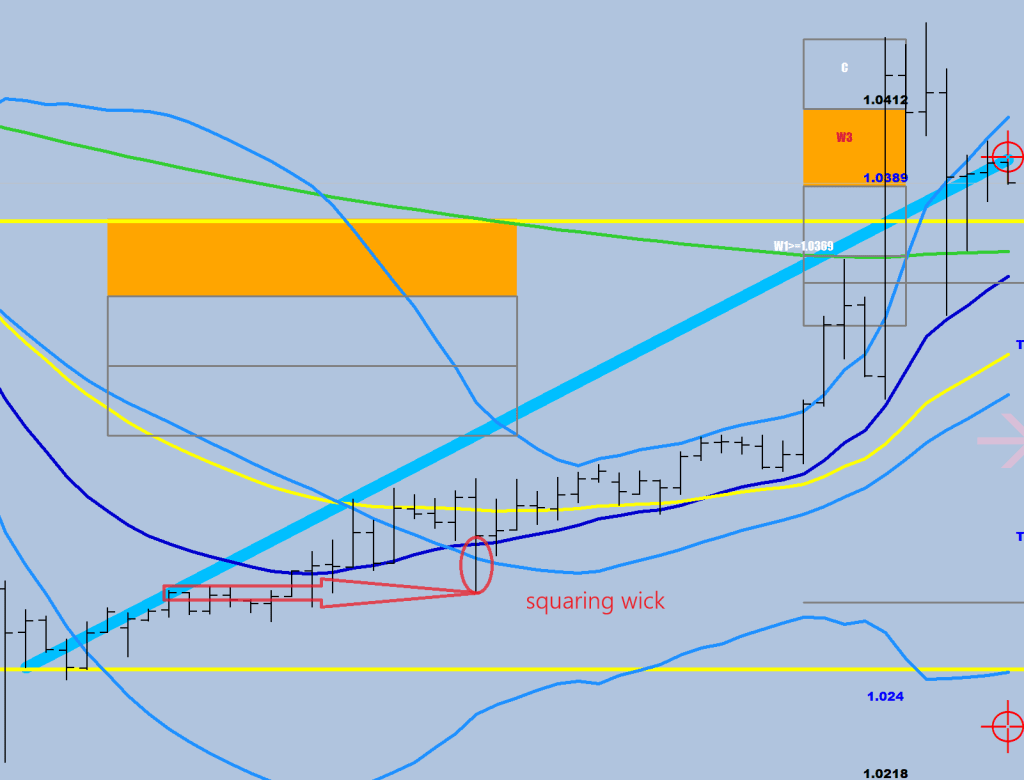
Any wick that is 16 pips or longer towards the extreme print is a clue of squaring (i.e. the market maker dumping out excess load in line with the unfolding mean reversion).
Fading efforts of the return move to the 120SMA and the 207EMA would get run over. If these two levels get taken without a correction in between below the S30, the market may be in a parabolic mode, receiving constant charge at the upper BB, it can get as far as the FF level.

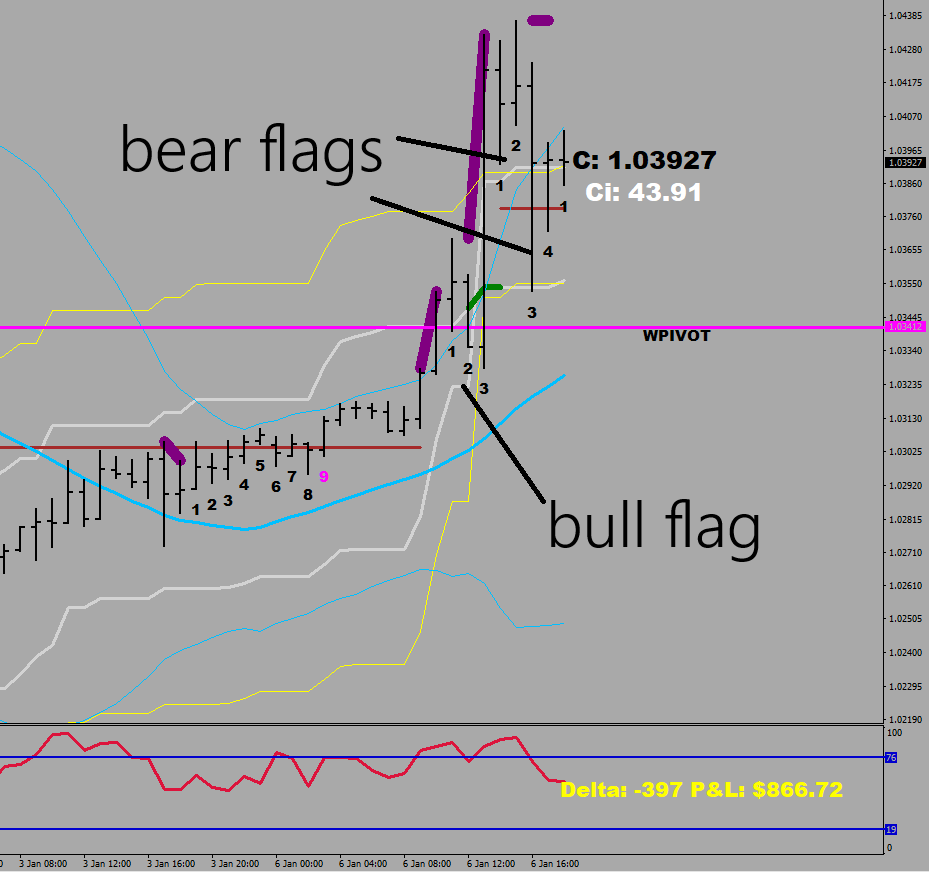
Next? The short squeeze provided some bull advantage, there is a chance to consolidate above the 80 line. If that happens, the likelihood that we saw the low for the year on the first trading day goes from very high to certain.
Since numerous hourly candles were completely outside the 30-sample BB, if a new leg were to start (drive), I would expect the price to come back to the 30 SMA at a minimum or optionally to the lower 30-sample BB, which is currently in the 1.025x range thanks to the volatility increasing push.
