
Spike that is. From the green box, into the trendline… likely back into the green to rotate to the low.

Trendline resistance + E-98 8H resistance.

R1 was at 1.0378, high was at 1.0381.
I am 5 lots short. I have a sell stop at 1.0269 for a quick trade to 1.0249.

The minimum downside target matches the low at 1.0171.
Could this wick printing here be a runway for later? Certainly could, the question was the next move down.
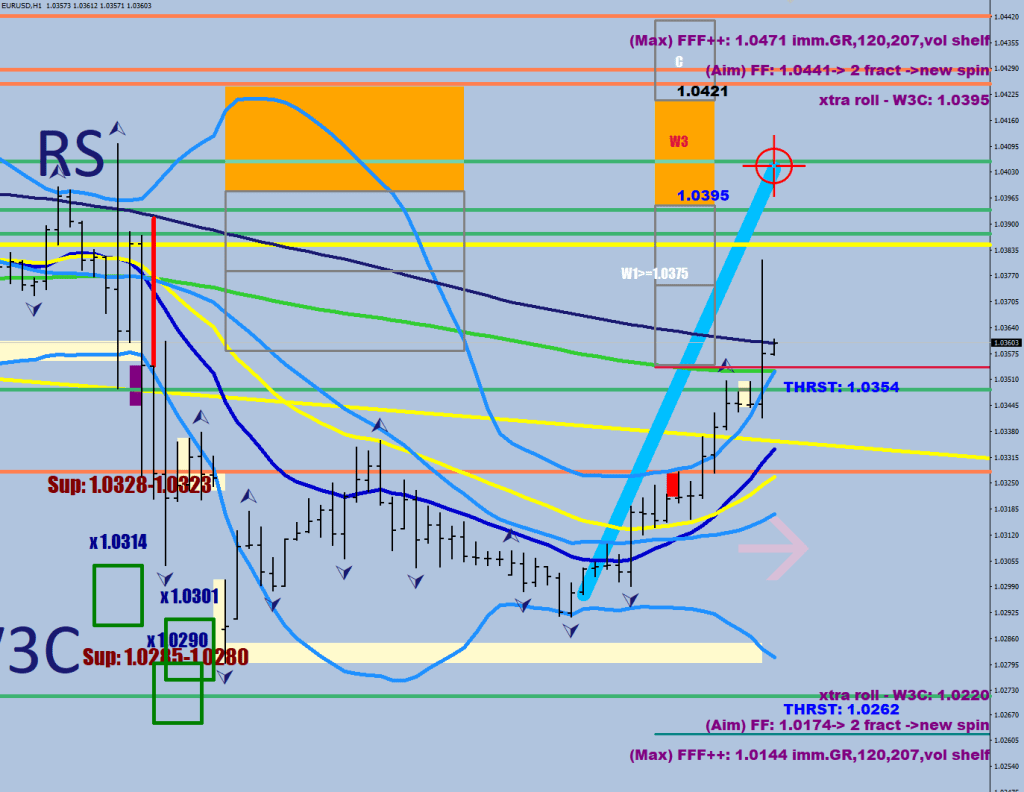
Could they buy the no-break extension at 1.0262 and start a wave 3 up?

This was a high-volume churn up, likely the end of a leg.
It may look bullish, but the up leg has fallen shy of a W3C print or even a Goldilocks (yellow horizontal).
If the high gets taken out next, that would be bullish. Currently, this seems to be a swing high.
Well done, you have just built a narrative for trapping yourself, but you seem to have forgotten one thing.
The money flow.

Somebody decided to pick up the money flow weakness, the rally printed an MF high that would suggest the need for a higher high. The 120 sample stochastic has a lot more room to give on the upside before it starts to get overbought.
The price is outside the 30BB, right after a squeeze-release. That is more of an opening move if you ask me. Would I be surprised if they double down on the upside holdings at the 8 EMO and in the following 7 pips below it?

How about a 3-3-5 sequence for a finale?

They saved the longs from dipping below R3 twice (where the compression could have commenced).
