
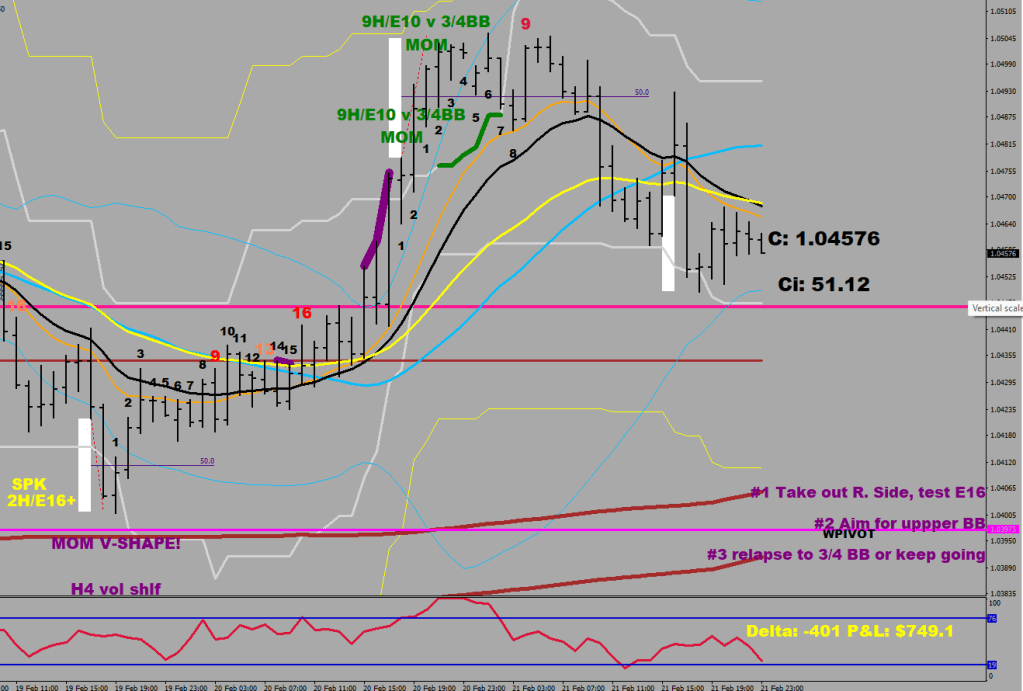
The white rectangles are likely reversal attempts. Once the far end gets taken by 10+ pips, the zone is considered a bust.
A reversal is a process, where the 16 EMA is the first challenge (fork for a relapse), then the 30 sample BB on the other side, where the whole thing could fail again, and the reversal was only a success if it starts to ride the 30 sample BB.
The filters for the long side:
I’m still working on the terminology, but I went with “discharge” first for the 16+ pips step (1/2 fluctuation size) that I am looking for.
if (High[i]>High[i+1]+160*Point && Close[i+1]>Open[i+1] && Low[i+2] && Low[i+1]>iMA(symbol,0,16,0,MODE_EMA,PRICE_MEDIAN,i+1)
   && High[i+2]-Low[i+2]>100*Point
   && High[i]<High[i+1]+500*Point
   && High[i]<ExtUpperBuffer3[i]-20*Point
As for what happens next, I believe that the revesal zone up is going to be called a bust: there has not been a proper lower BB test yet, meaning the upper reversal is still running its course. 1.0440 should be in the cards, as that is currently where the oversold level starts, and a full no break extension / thrust would put the price at 1.0416.
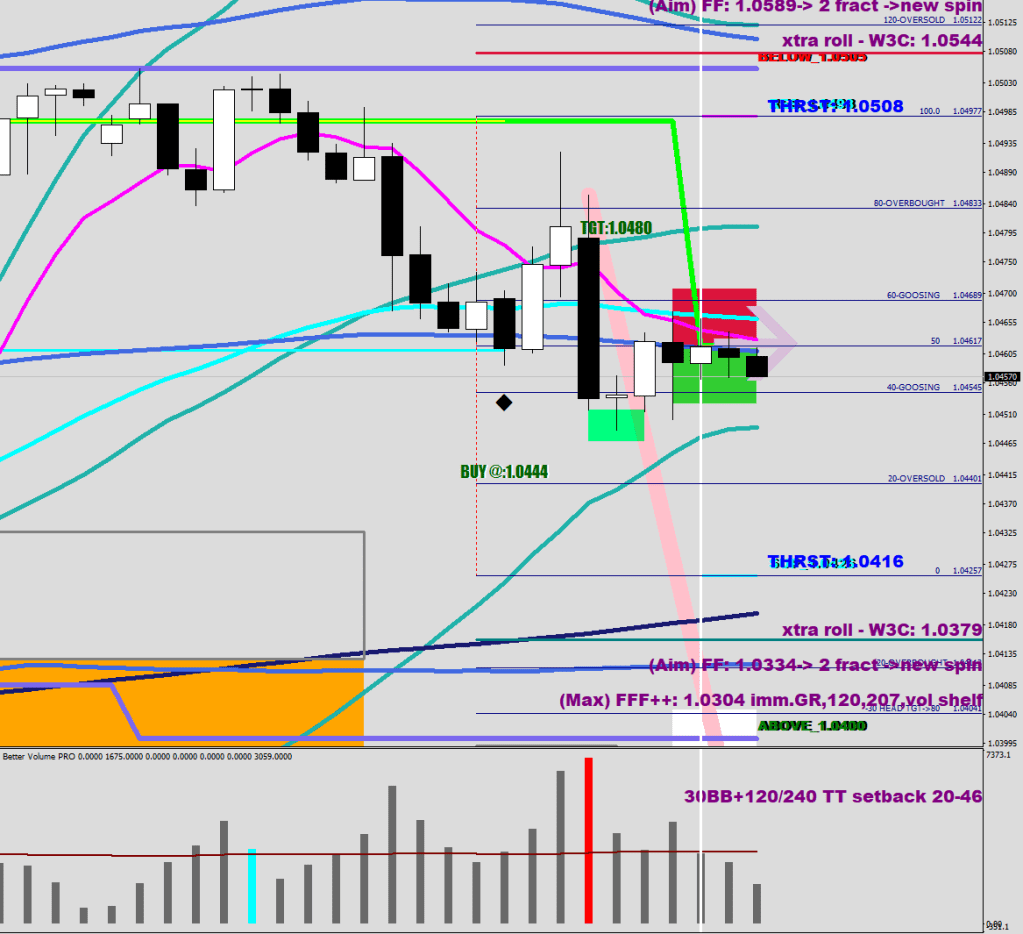
The German elections could certainly cause a bit of a gap this weekend. Either way, I went in with 4 lots short.
