
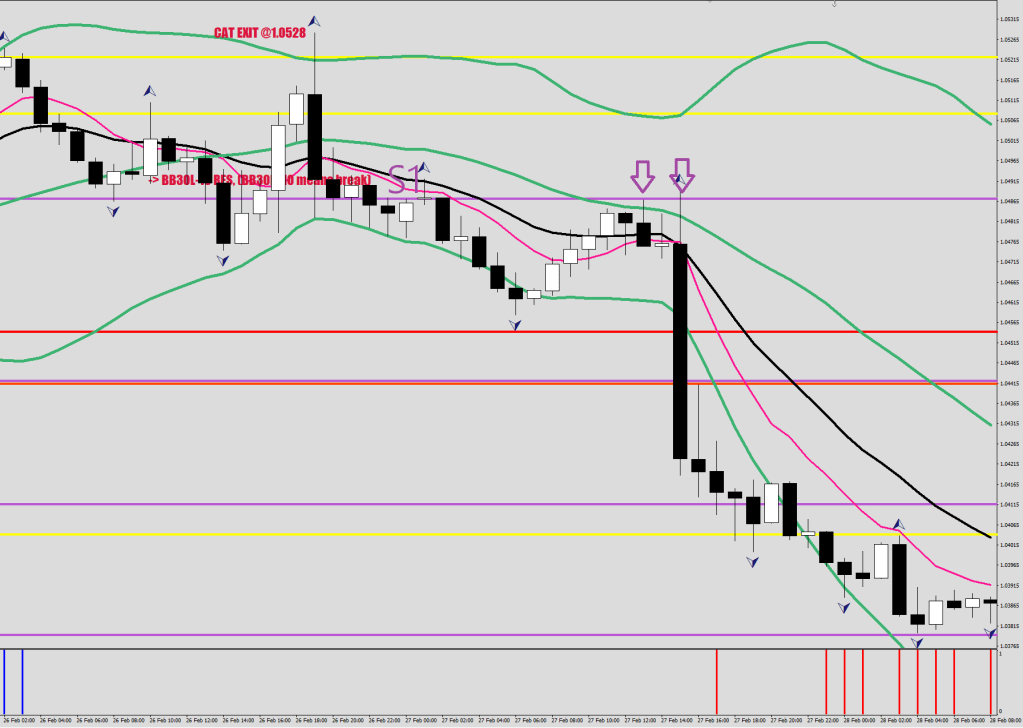
Having printed a catastrophic exit, the market is currently on the quest for making a new S1 level.

You would end up with another purple line, somewhere nearby the 30 sample BB, still on the inside, but within 10 pips of it.
The purple line normally would be placed on the body of the candle, the above picture got adjusted because of the Weak Cat Exit (did not poke above the BB on the first divergence), the body of that white is a bit bogus because of the credit spread expansion, so I went with a line that connects all 3 fractal prints.
What happens after the new S1 prints? If the price manages to close beyond the body, the pullback into the range would be a recoil for a future shot fired.

On the image above you can see that the R1 gets closed above, and then there is a pullback before the bigger run. As soon as R1 gets exceeded again, you see an acceleration to the other BB.
An R2 in red color gets printed with a candle achieving 10 pips+ outside the BB. In this case it pretty much coincided with an earlier R1 print. The rat poison was taken, and all resistances got dealt with for good.
Now let’s see an example of coming back down. This failure on the upside was about a 3x test of a level at 1.0522, and so the price is going back into a prior range.
The price made an S1 in the second hour, it broke it, it never made a new S2 (did not pull away from the BB by 10 pips), made two backtests of the S1 and then broke back inside the prior range targeting the other end of it (cat exit).
Now, let’s look at another one that may be closer to what is about to happen here.
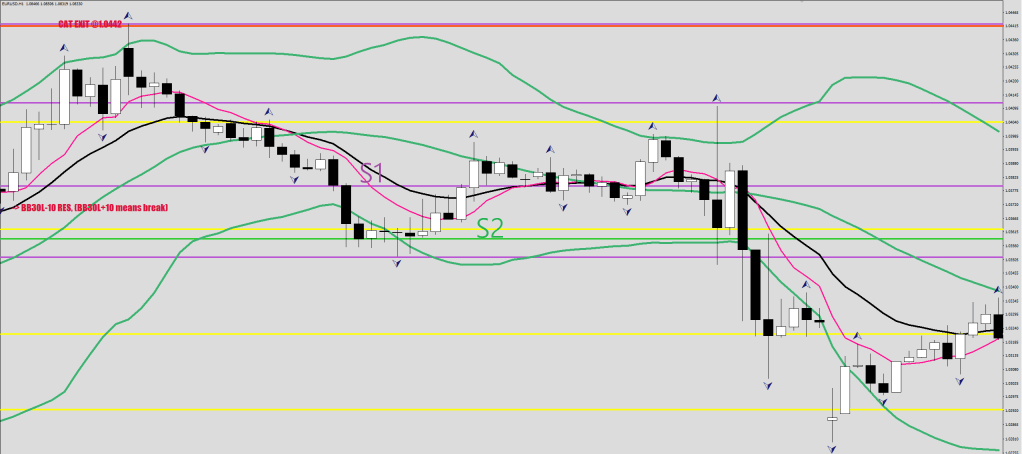
A print & break of S1 followed by an S2 stall out. A reach back for liquidity: can you spot it just above the first fractal up on the way down?
Also, after the 3rd hourly fractal print on the downside you had to go long.
Your blue print.
