
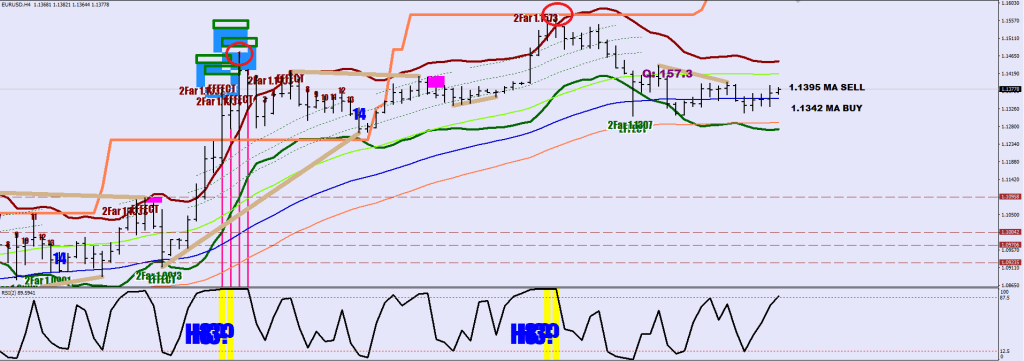
I have given this lesson many times, the bumper line is a 100-pip displacement with a 20x 4H delay
 if (High[i+20]>iHigh(symbol,0,iHighest(symbol,0,MODE_HIGH,200,i+21))) upperbumper[i]=High[i+20]+1000*Point;
    if (Low[i+20]<iLow(symbol,0,iLowest(symbol,0,MODE_LOW,200,i+21))) lowerbumper[i]=Low[i+20]-1000*Point;
The head and the right shoulder tend to have this relationship on EUR/USD. I cannot say anything similar about any other instrument.
Now take a look at where we are, that teal trendline is the very defining low of this current uptrend, I left the connection points lit, so you can see where it started.
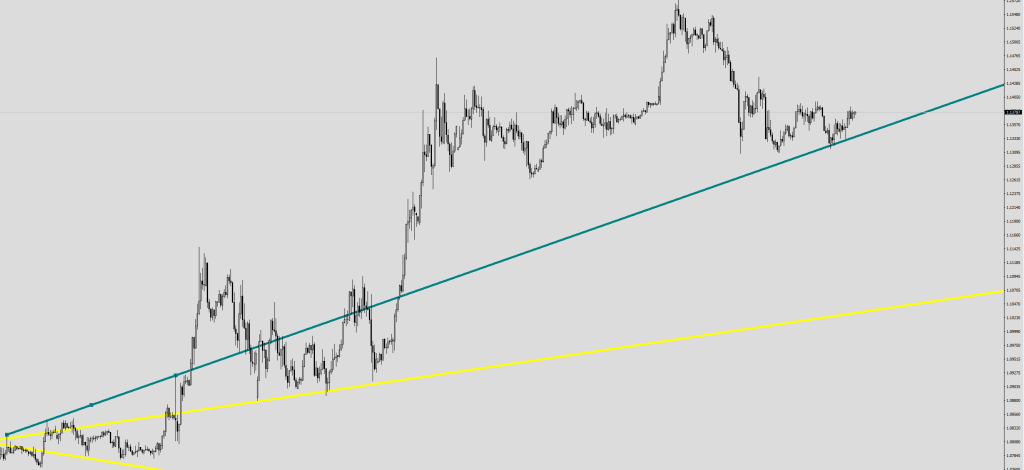
Pay attention to how meager the bounce has been.
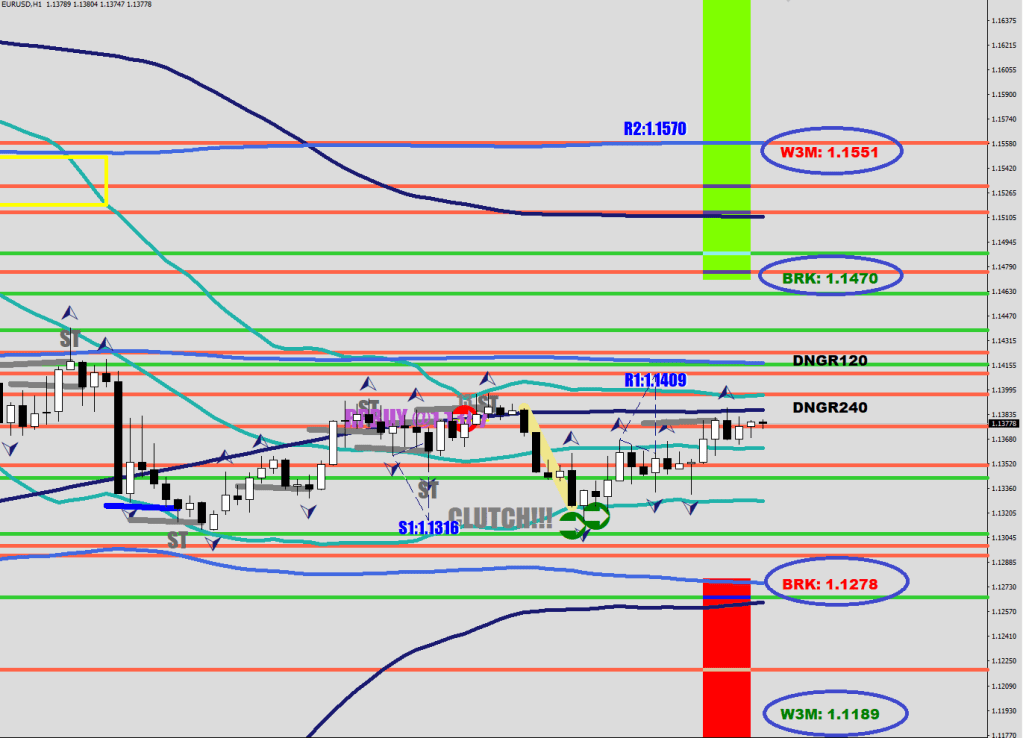
What are they selling and what are they buying.

I would say that in the last 72 hours, they typically sold after the 3rd hourly close above the E-44 and bought after a red volume print, mostly the undercut.
Now, triangular bells / fractal evaluation.
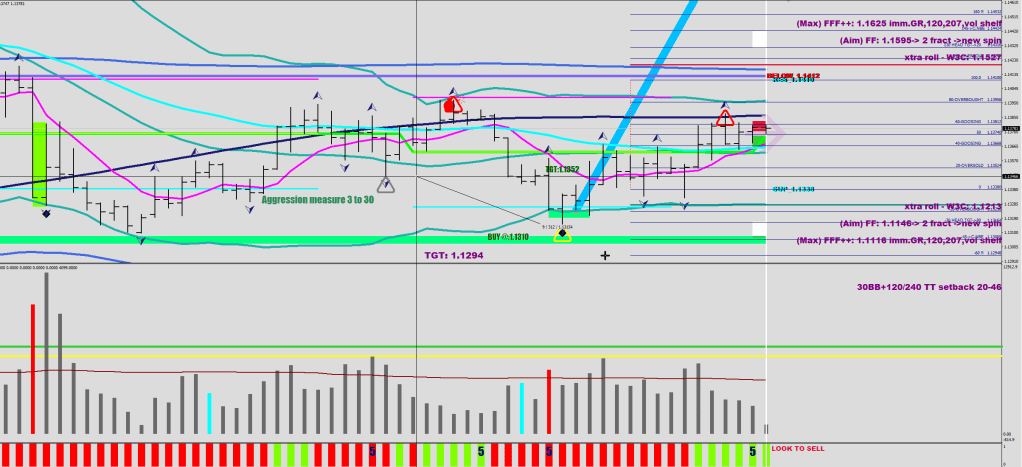
A gray triangle warns that bull aggression should be measured next. The undercut would likely be 3-30 pips lower. If they bought 3 pips out, they are very aggressive; if they bought 30 pips lower, they are pretty relaxed.
The current squeeze would most likely result in a volatility breakout. The rectangular strips show the numbers where the break could occur, depending on the manner of the approach (outside an expanding BB30 will do), and then you should be targeting the W3M numbers.
These numbers get adjusted when the consolidation mean gets re-adjusted. Do you have any clue about the breakout numbers for any other instrument? I don’t. It took me 12 years to figure these out.
