The mapping market starts with a steep change in futures contracts holdings, a sudden imbalance due to fair value concerns.
The blast-off move is going beyond the red line and consolidating there.

They hijacked the bombing weekend’s sudden found excess volatility with the gap down.
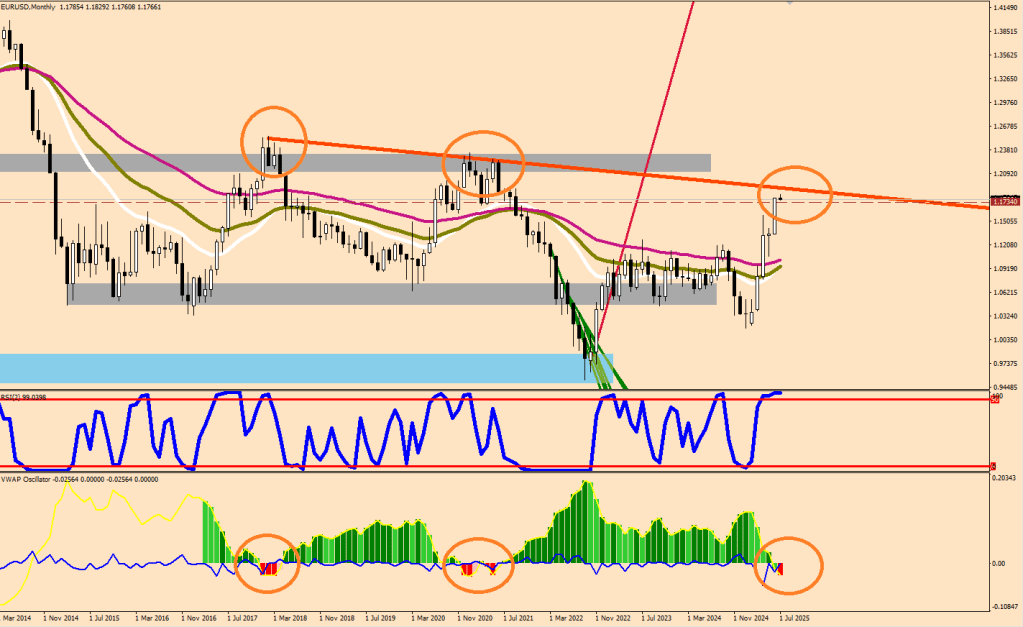
The red line is still a 10-sample low plus 90 pips
ninup[i-1]=iLow(symbol,0,iLowest(symbol,0,MODE_LOW,10,i-1))+900*Point;
My standard way of measuring how stretched the market becomes is by plotting the distance from the 9-day EMA band. This value can be utilized in the future when wanting to spot the challenge and shortfall from this first move.
The rotating out part is there to show that the core holdings have just become 5% less, which makes the turn of the tide possible.
Think of it like this: two checkpoints, the price is a lot higher, but there are significantly less long holders -> the price should reverse.
This Wave 5 came with a 4.75 stretch on the first move up.
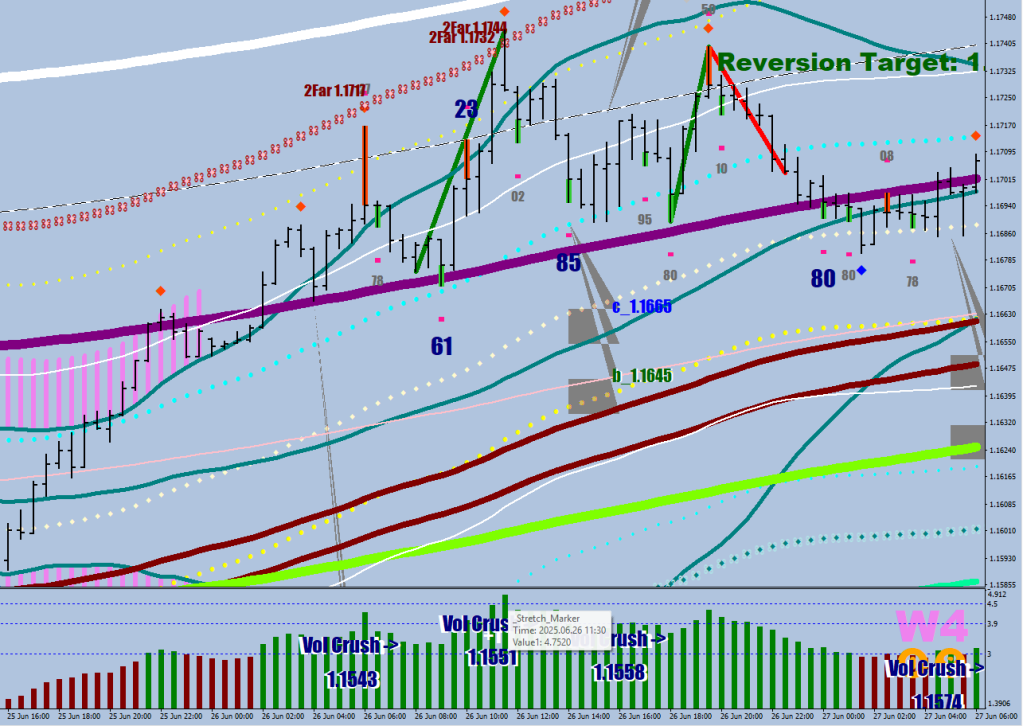
Today’s maximum stretch was at 4.57 which would make for a 4% loss.
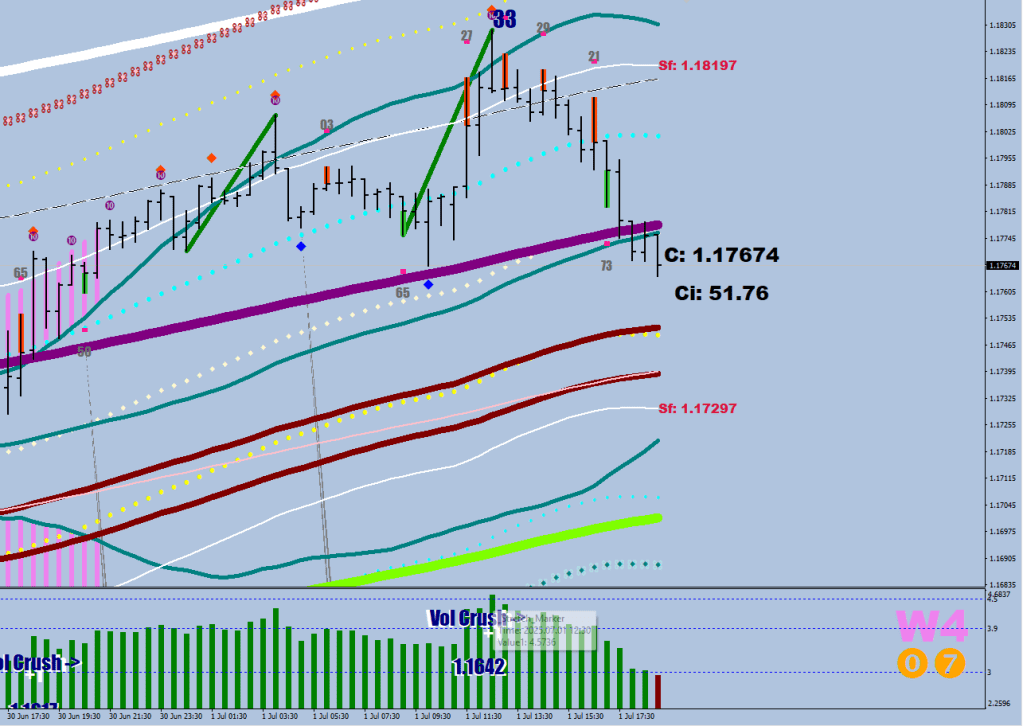
The Wave up seems to be up.
Now, notice that every time the price tested outside the house on the upside, then failed back inside, it has ultimately made it to home: beyond the E-32, and another leg perhaps below the E-44.

The same movie over and over again.

The reason why it could be different this time, is the divergence between the measuring points.
I want to release these notes, so I won’t start on the horizontal arrows and the upside break 16-pip trade this time.
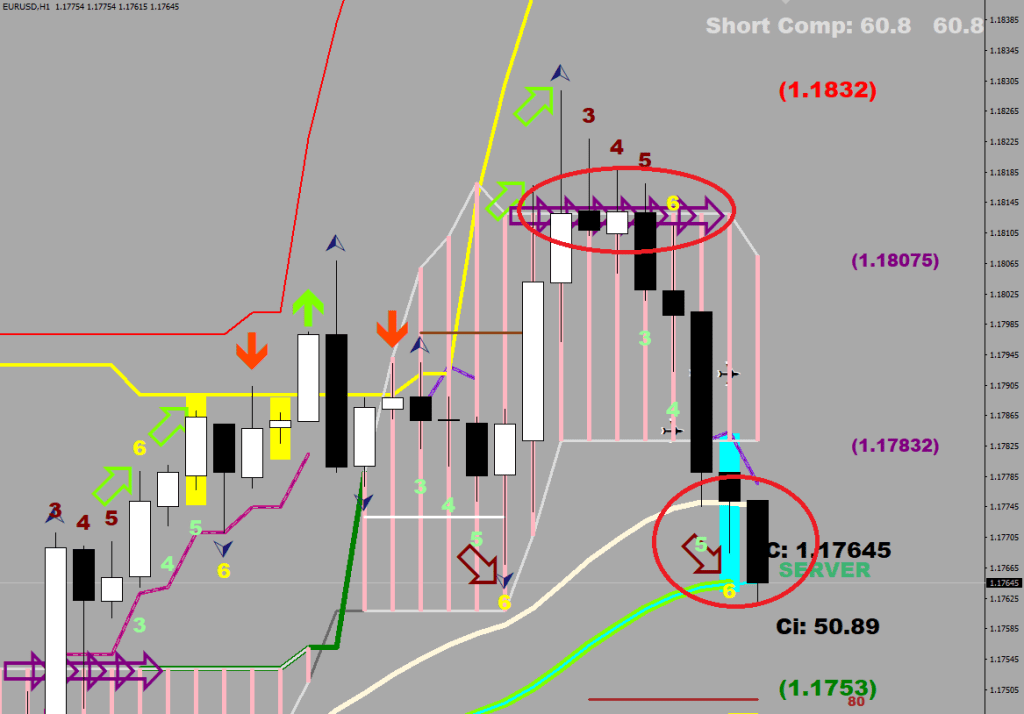
Things are in motion. There still haven’t been any closes below the Server (E-44 HL2), but that may occur next. A right shoulder up to the last established level is still a possibility for a kiss goodbye around 1.1813, but this is no longer a safe buy.