
…but don’t overthink.
The dilemma is always there. Is this the start of something or the end?
Your answer is the weight of the evidence, but you need enough uncorrelated things to plot, look at and evaluate correctly.
Exceptions & fake outs.
There are things you can learn & build upon.
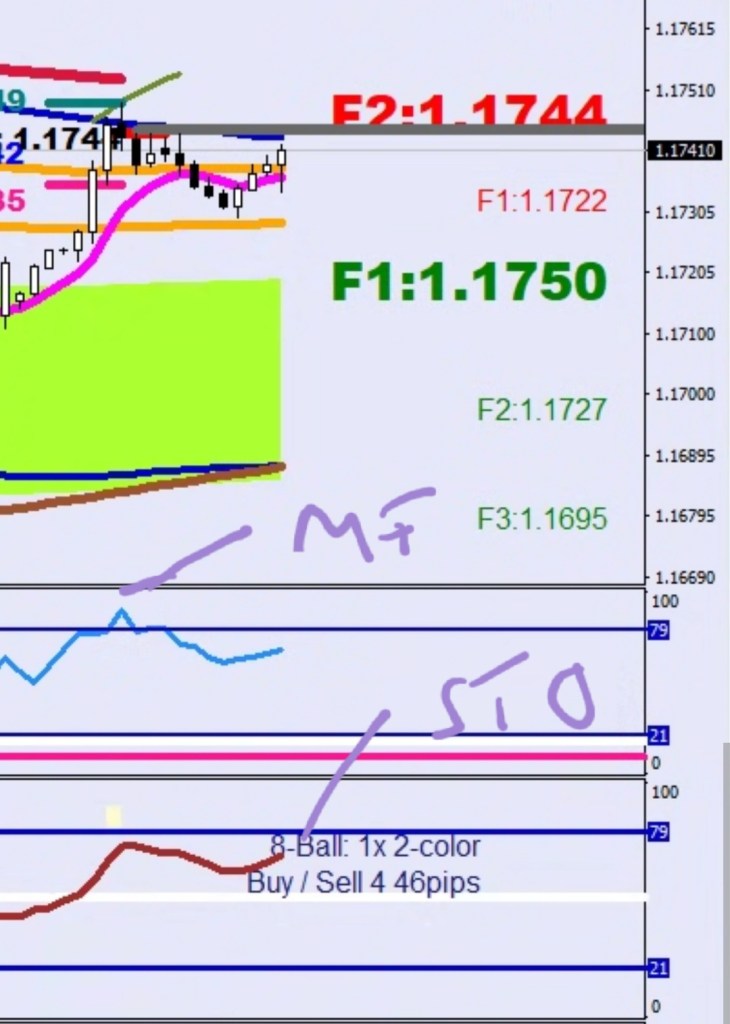
When the Money gets this overbought, a higher high has to correct back. The one exception is when the entire volume gets absorbed.
The stochastic not being overbought can mean both: there is room or it can’t seem to get overbought.
What do you know, pro volume print on that money flow peak.
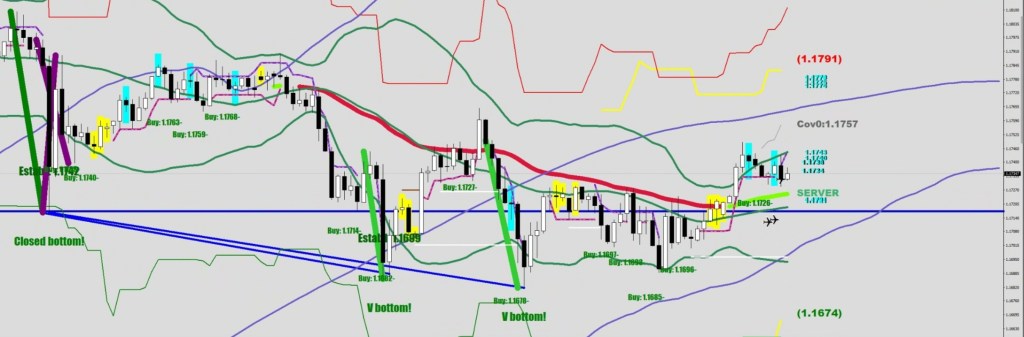
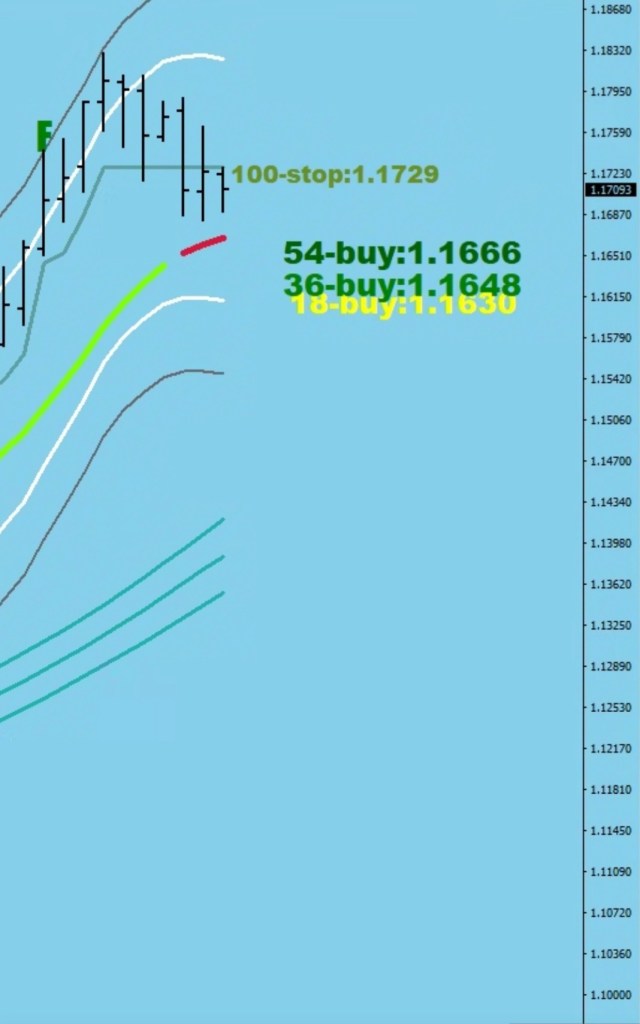
There were three thrusts (green) which meant a time out, but the bounce taking a day plus already has achieved nothing on the upside. The last leg’s first established level was bought at 1.1690, but there was an absolute stall out at the 100-pip stop.
This morning the level was cleared, but uou had 3 daily closes below it. Which is the fake out here?
There was a Tide turn warning, but the crash went on for 23 pips and we are still over the bump. Do you doubt a Tide Crash advisor?
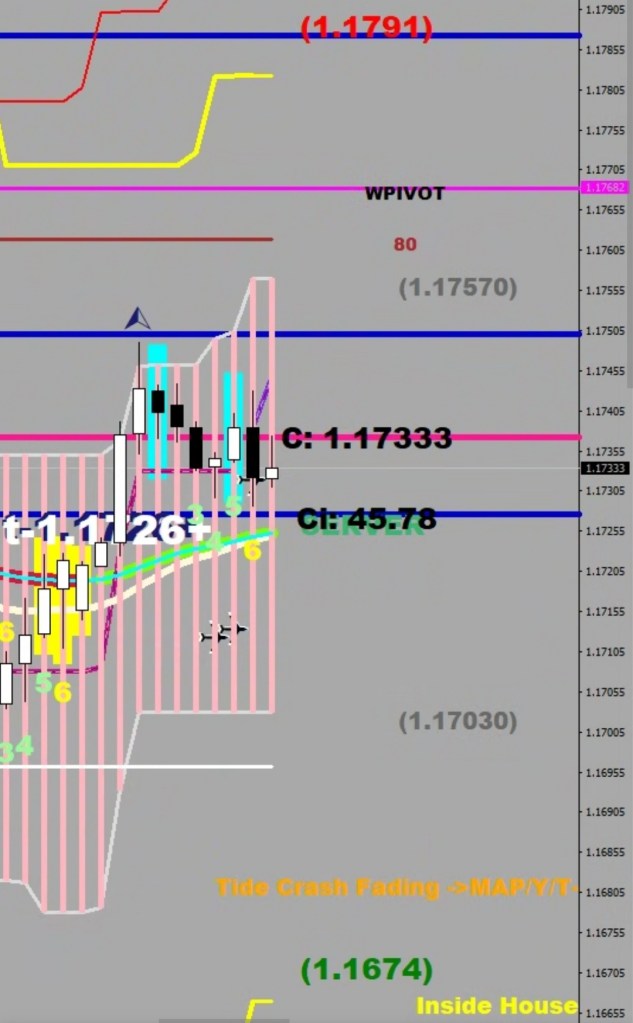
The house is too wide (grayed out numbers in the brackets) – meaning too high volatility to start a move.
The sell off did not result in momentum detection (stochastic bar prints) on the downside, but was flashing red with this measly move back up.
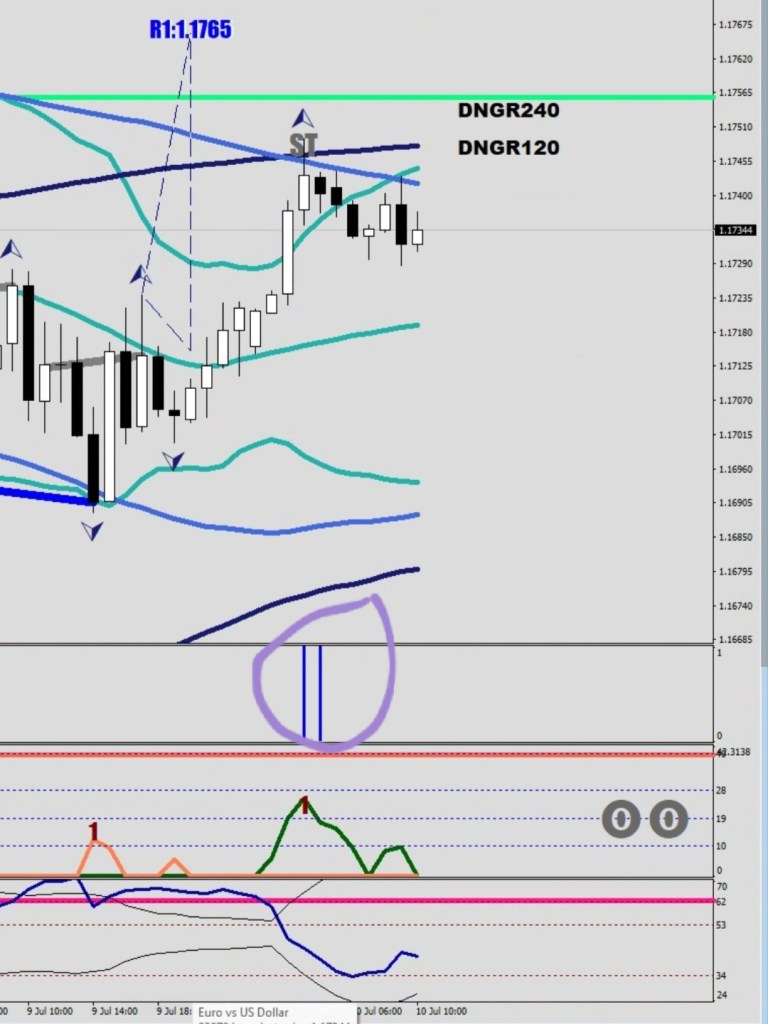
Does this mean the presence of momentum of fresh overbought toxicity?
Lastly, the Daily RSI2 seems to be doing a crooked finger move, rising up for the next bite. The Nick Rhodes scale has 2 more degrees to give before a final turn back up becomes a good probability.
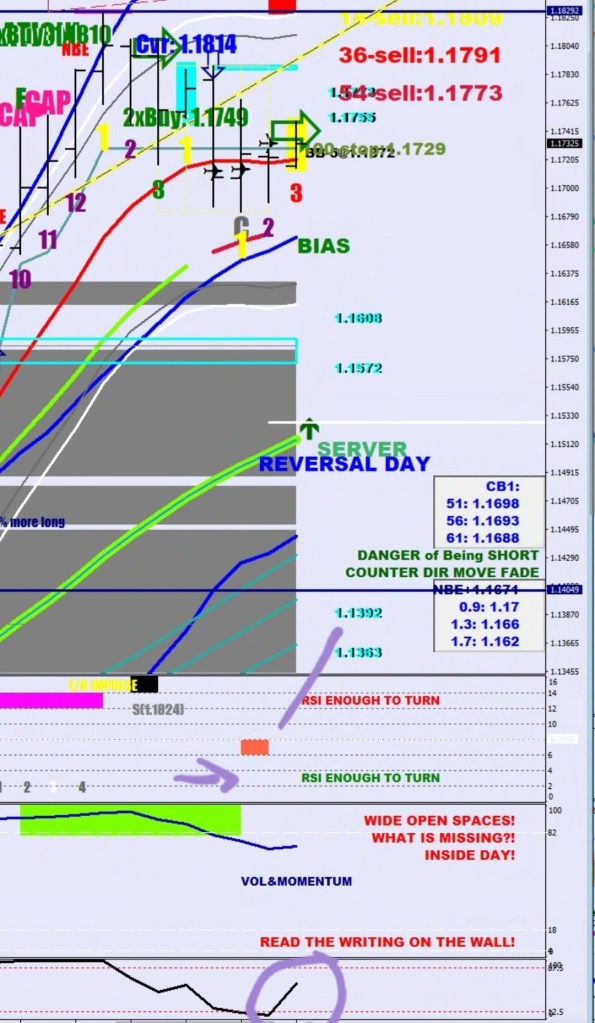
Due to the high energy reserves, the S20 might be taken out with ease. 3-5 days selling would bring the daily stochastic to neutral. 1.0608 and 1.1572 are two high volume call points on the way down.
