
So, the market remains in a Mapping mode. This means that the moves are volatile enough to ultimately get outside the Yellow lines (Yellow arrows) at least on the first legs.
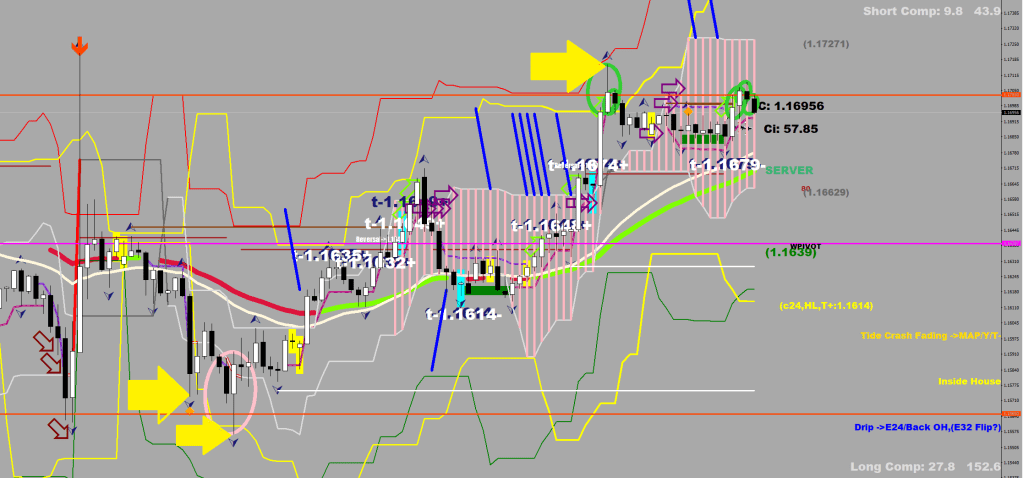
The tide turn signals are not useful in a mapping market. The green and pink hoops are turns occurring about 1 fluctuation maximum away from the 9-day EMA (“the valley”). The blue marker lines are trade suggestions for a 16, 35, 55-pip break, either because of the flip at the E-32 (Khaki) or at the edge of the house (Pink shading).
On the daily, the BB squeeze is about to set in, meaning a directional, trending move is pending.
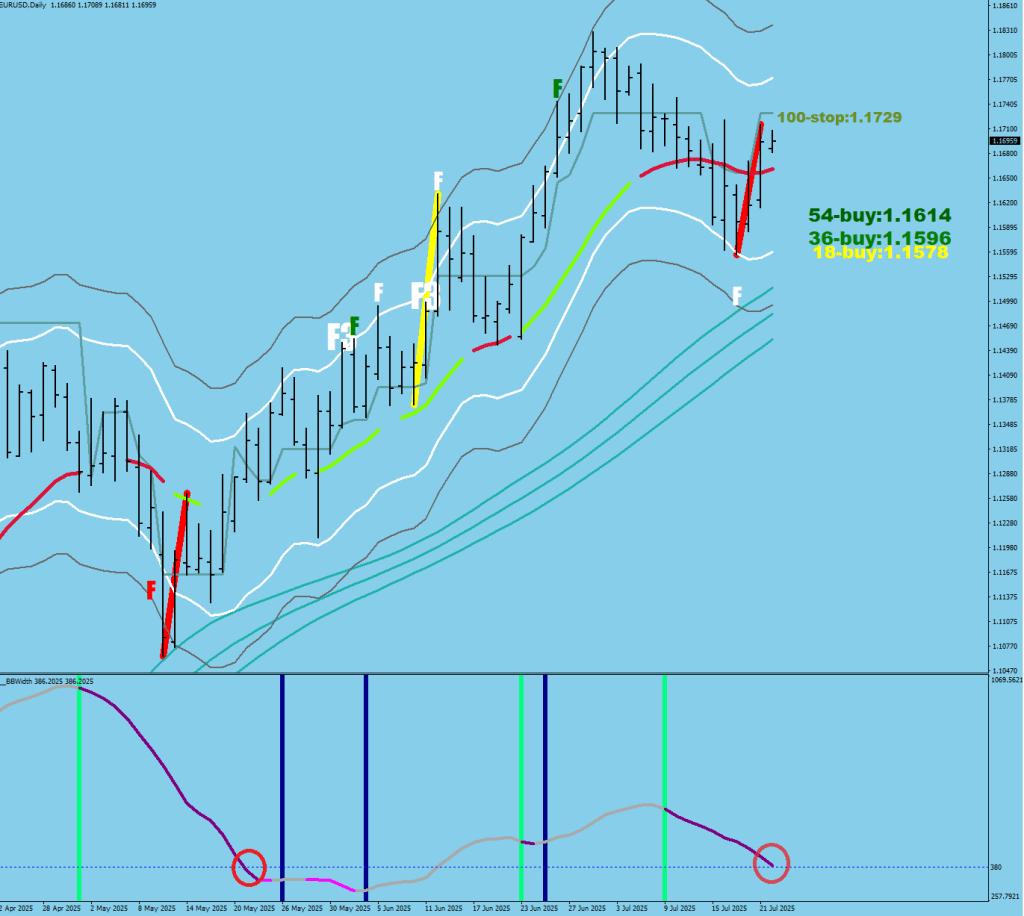
Sure, the last time it was to the upside, and I think it would be to the downside next.
The red diagonal line is a liquidity break to the upside. This one has come from the 2.8 fluctuation maximum line (white – no root), which is different from the previous, failed call that started from beyond 4.5 fluctuation maximum (deep root).
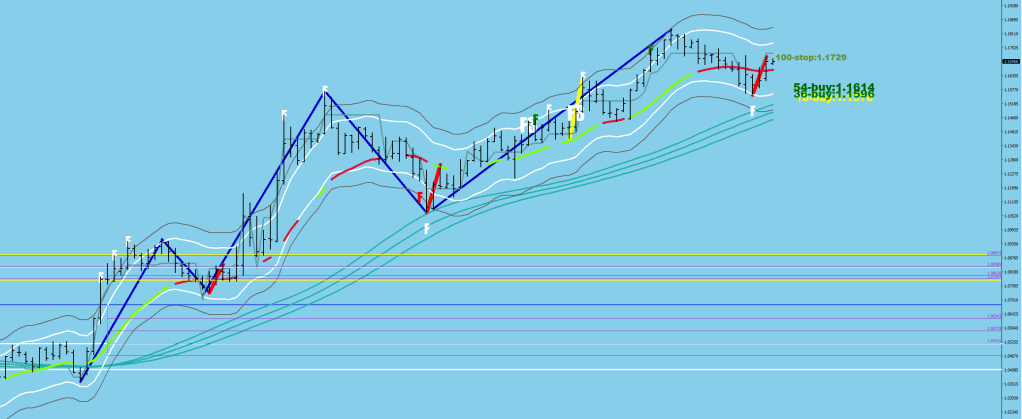
To please E.W. people, here is the 5-wave structure where Wave 3 could not be the shortest. Even if the current move down would be just an ABC (I think otherwise), we have not seen the C leg yet. A liquidity break sounds more like a Wave 2.
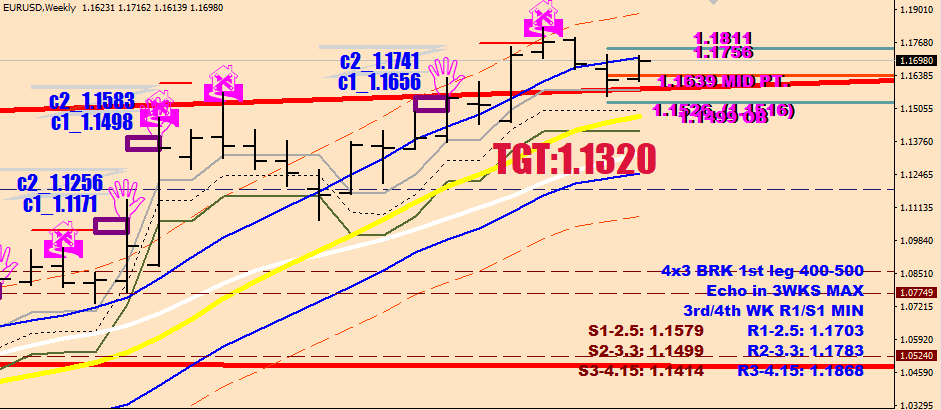
I believe that 1.1380 is in the cards, and possibly 1.1320 as well for the end of Wave 3 down.
Currently, there is an open top (Purple diagonal)
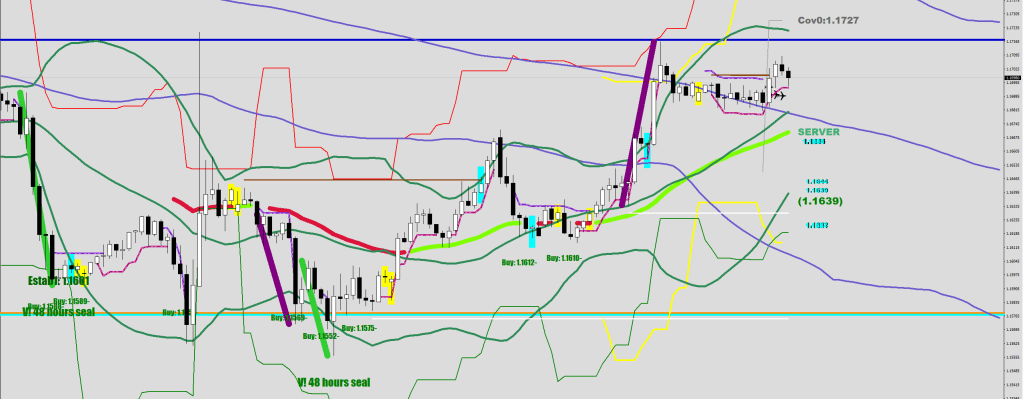
10 hours left to make a higher high; if that happens, the top is a bust. Beyond 10 hours, the beat (if it occurs) should be the bare minimum (1-2 pips).
Currently, I have doubts about the continuation, as the price should have returned to the E-24, but it did not; instead, it rebounded and started rallying after 16 hours, leaving this rally “in the air”, but it is right before Powell, so things may change.
If you like Madis, State Azure, you should fancy this track on album #79, Chill.
Track #6, Hay Little Dreamer is mopping the floor with this one for the views.
There’s my 5th French track here as well, Ensemble Maintenant (Track #9).
