Gotta lay down some vocabulary first.
For hype monitoring/control, a 30-minute chart with an RSI2, a 30-sample Bollinger, and an 8-sample EMO is ideal. You are not improving on anything by a lower timeframe.

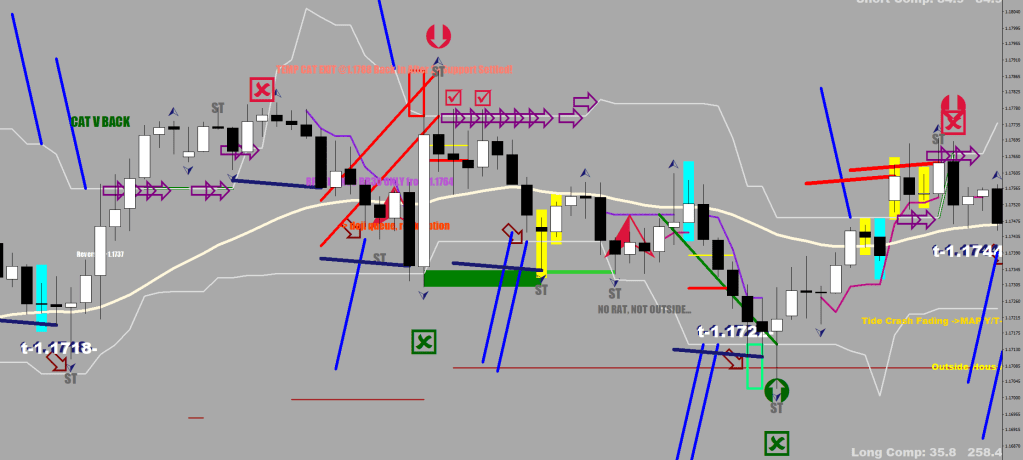
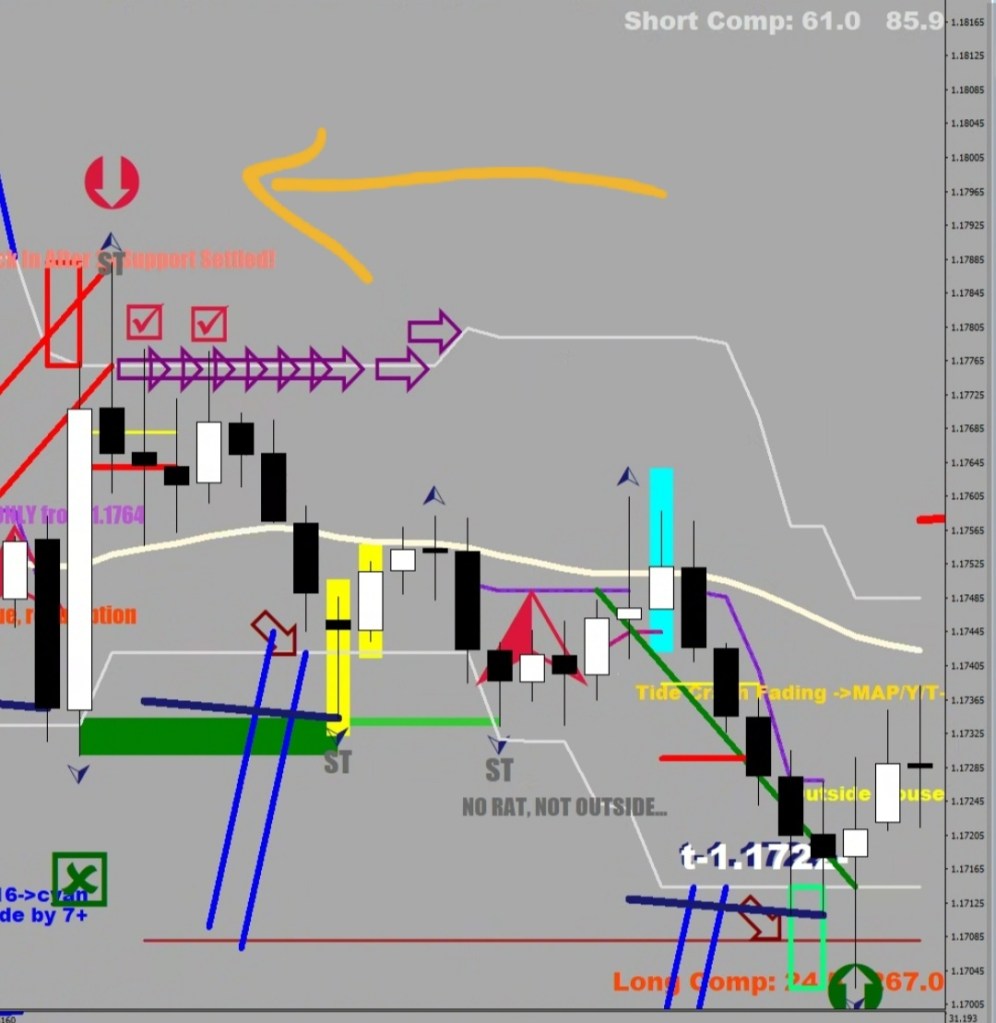
The hype is on after 6 consecutive closes outside the BB.
The hype should find support at the 8 EMO upon pullback.
If the RSI2 does not cross the 50 line, that’s not a pullback; call it a dip.
A correction has multiple legs and can be skewed. Meaning the second fractal merely approaches (typically within 4 pips) the fractal printed by the Measuring Leg.
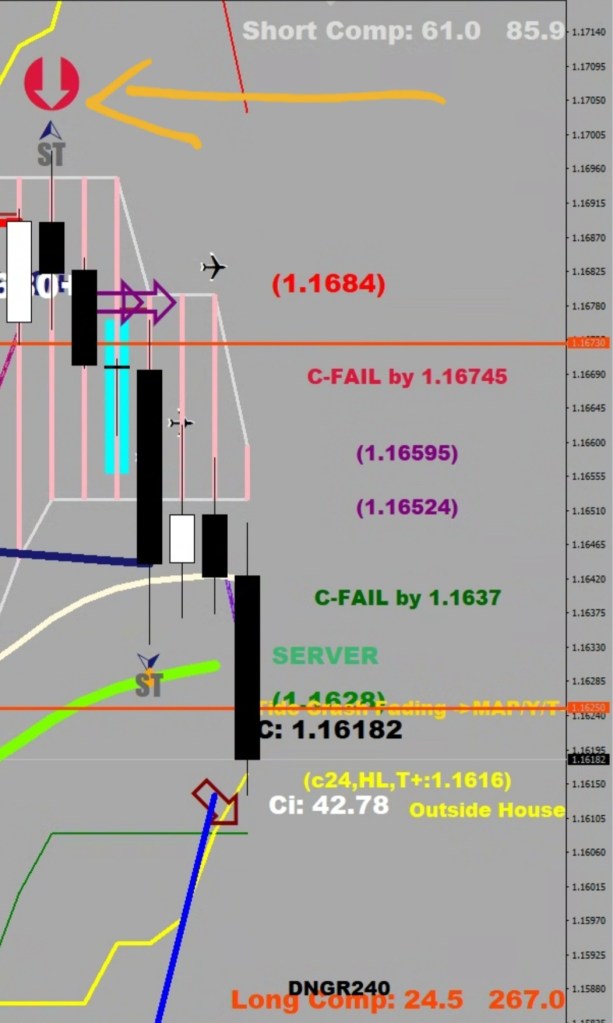
The 30-sample BB, when attacked from the inside, can prompt a stall / prompt a correction; it would require new money to close outside.

The hype ends with a correction, and is followed by a squirt.
One close above the BB, one below (one re-capture attempt) & it’s over.
First stop: S-30 – E-44 reset on the hourly.
Album # 81
Silento parody (next level silly), Mercury opera-sings, new French one, rap, disco, alternative. Oh, and Say Goodbye To The Bad Rhymes.
I find the drum-use rather creative in this one:
I am a signals guy, always have been.
I just need to get around to puttung the relation marks right. The best performer currently:


You would think I’m cherry-picking, but not. Repaint? Sure, the first hour is needed for the paint to dry
Does this look overoptimized to you?
   ///wick out on the upside mark up
   if (High[i]<High[i+1] && High[i+1]>ExtUpperBuffer_[i+1]+30*Point
   && Open[i+1]<ExtUpperBuffer_[i+1]
   && Open[i+1]>Close[i+1]
    && MathAbs(ExtUpperBuffer_[i+1]-ExtUpperBuffer_[i])<30*Point
    && High[i+1]>High[i+2]-20*Point
      )