
Appreciate the difference.
I am spending all of my time with one instrument, figuring out the conditions necessary for a turn, how the hype works, entries, and plausible exits.
To monitor the progression of a hype, be on the 30 minutes.
A hype is momentum embedding. The hype has an objective, which is freedom, liberation. The hype is a method used to get the price outside the yellow lines and have it consolidate there.
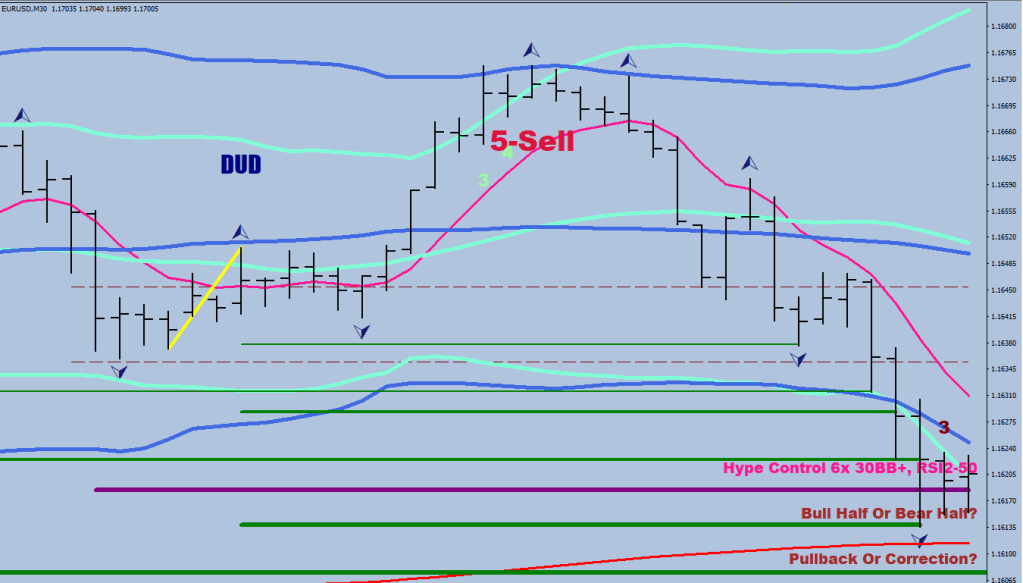
A hype-phase is at least 5 closes outside the 30 BB (HL2) on the 30-minute chart.
A hype can fail on the 5th candle if there are no closes outside the 60 BB despite prior interaction with it.
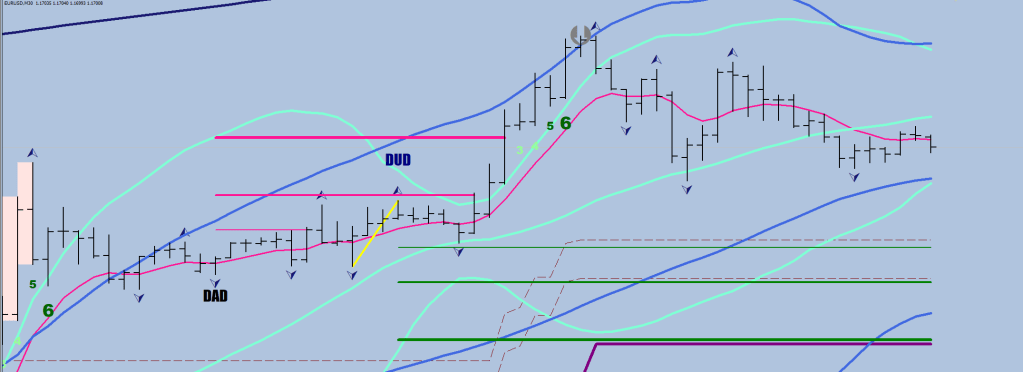
An all-out hype arrives with the 6th consecutive close outside the BB 30 and gets confirmed by a 1-hour pullback, responded to with a 30-minute engulfing print. From then on, the attack on the yellow line becomes blatantly clear: likely any 1-hour pullback would receive retaliation in the form of a 30-minute engulfing move.

Success is still not guaranteed, if 3 engulfing moves do not manage to put the price past the yellow line enough that the correction setting in would cap out at the yellow line, the hype would end up being a failure.
During an all-out hype, the 8-EMO would remain largely untouched, but a piercing is a sign of the last charge starting. A fallback to the house is a location for adding.
A pullback lasting beyond 1 hr is the first leg of a correction. The correction ends the hype, but it is giving birth to a final thrust. In the first 4 hours of the correction (that shall last 4-9 hours typically) you would already have the support level made in the form of the deepest close. If you get a retest of the deepest wick as well, that is a place to put on some extra money.
Otherwise, there are one-size-fits-all all people with no practical advice. I.e.:
EW1: This is Wave 3 down (so you could sell practically anywhere, right?)
EW2: This is a Wave 3 up (so you could buy practically anywhere, right?)
me: You need $2 for a bottom
Keep the change.

Found a 50p coin so far.
There was a hype, there will be a higher high after the correction.
    if (Close[i]>iBands(symbol,0,30,2,0,PRICE_MEDIAN,MODE_UPPER,i)) counter++;
      if (Close[i]<iBands(symbol,0,30,2,0,PRICE_MEDIAN,MODE_UPPER,i)) counter=0;

      if (Close[i]<iBands(symbol,0,30,2,0,PRICE_MEDIAN,MODE_LOWER,i)) counterd++;
      if (Close[i]>iBands(symbol,0,30,2,0,PRICE_MEDIAN,MODE_LOWER,i)) counterd=0;

 //downside counter
       if (counterd>2 && counterd<7){
               ObjectCreate("Countesst"+i,OBJ_TEXT, 0, Time[i], High[i]+50*Point);
                ObjectSetText("Countesst"+i, IntegerToString(counterd,1,0), 18, "Arial Black", clrMaroon);
                if (counterd==5) ObjectSetText("Countesst"+i, IntegerToString(counterd,1,0), 18, "Arial Black", clrCrimson);
                  if (counterd==6) ObjectSetText("Countesst"+i, IntegerToString(counterd,1,0), 28, "Arial Black", clrCrimson);


                  }


  //upside counter
 if (counter>2 && counter<7){
               ObjectCreate("Countess"+i,OBJ_TEXT, 0, Time[i], Low[i]-30*Point);
            ObjectSetText("Countess"+i, IntegerToString(counter,1,0), 18, "Arial Black", clrPaleGreen);
            if (counter==5) ObjectSetText("Countess"+i, IntegerToString(counter,1,0), 18, "Arial Black", clrDarkGreen);
            if (counter==5
          //  && High[i]<High[i+1]
            && High[i+2]>iBands(symbol,0,60,2,0,PRICE_MEDIAN,MODE_UPPER,i+2)
            && Close[i]<iBands(symbol,0,60,2,0,PRICE_MEDIAN,MODE_UPPER,i) &&  Close[i+1]<iBands(symbol,0,60,2,0,PRICE_MEDIAN,MODE_UPPER,i+1) && Close[i+2]<iBands(symbol,0,60,2,0,PRICE_MEDIAN,MODE_UPPER,i+2) ) ObjectSetText("Countess"+i, IntegerToString(counter,1,0)+"-Sell", 28, "Arial Black", clrCrimson);
               if (counter==6) {ObjectSetText("Countess"+i, IntegerToString(counter,1,0), 28, "Arial Black", clrDarkGreen);


               }
I wanted to talk about how this is light-years ahead of the YouTube scammers.
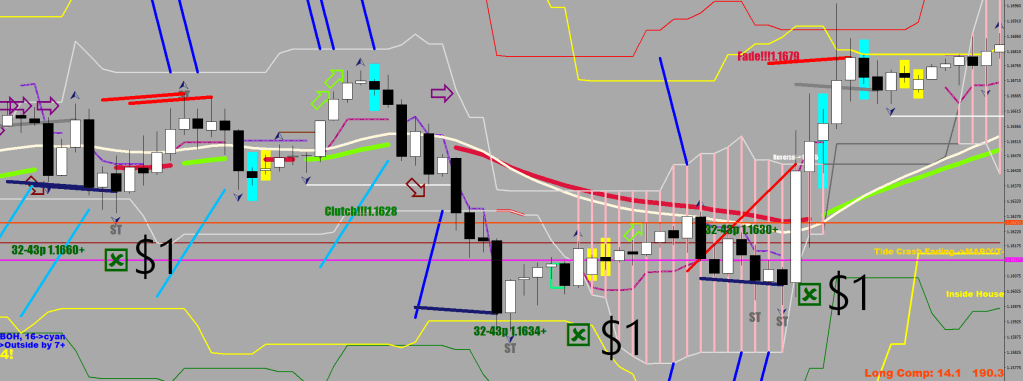
That they would never figure out that there are only 3 breakout distances, but how would they when nobody knows the location of the breakout levels, aka the edges of the house. Drawing things would not get you any closer. Plotting is a must, as you cannot calculate in your head in real time.
The yellow line, just as the house remains a mystery.
I also wanted to show you how the last breakdown at the edge of the house was 35+ pips, the first breakout on the upside was 55+ pips, and the third one was 16+ pips. All three sizes I have been citing here. I do not know these values for any other instrument.
   ///wick out on the upside mark up
   if (High[i]<High[i+1] && High[i+1]>ExtUpperBuffer_[i+1]+30*Point
   && Open[i+1]<ExtUpperBuffer_[i+1]
   && Open[i+1]>Close[i+1]
    && MathAbs(ExtUpperBuffer_[i+1]-ExtUpperBuffer_[i])<30*Point
    && High[i+1]>High[i+2]-20*Point
    && High[i+1]>High[i]
      )
A $2 top could come in the shape of a Wick out. That’s anywhere from 1.1741 currently, falling shy of the yellow line at 1.1760.
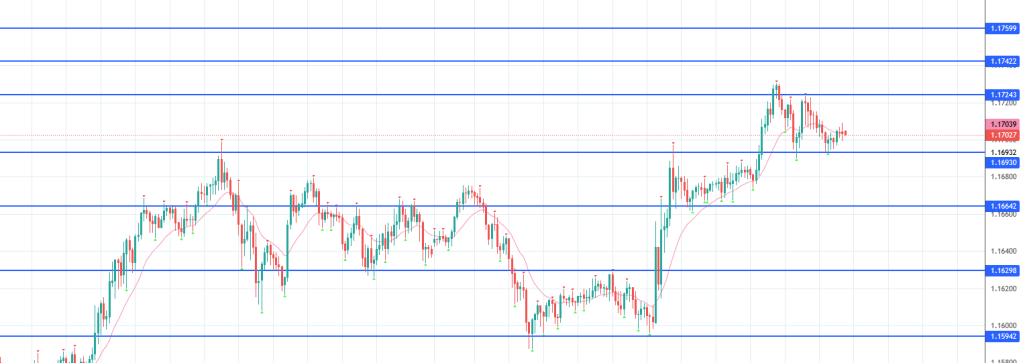
The next two levels up are 42 and 60.
