
You know already what you’re gonna get. Nothing nice and something nice.
Like Schrödinger’s War President. Bombed everyone and bombed no one at the same time.
The first problem with trading is that everyone wants to believe is an existing “science”. There isn’t one.
The second problem is that scammers are cashing in on this belief. Despite having nothing of value to offer beyond what you could figure out, they aren’t shy to take your money and do not care about misleading and planting the wrong bias.
This is not about picking on individuals. It is about showing you the trap you are falling into.
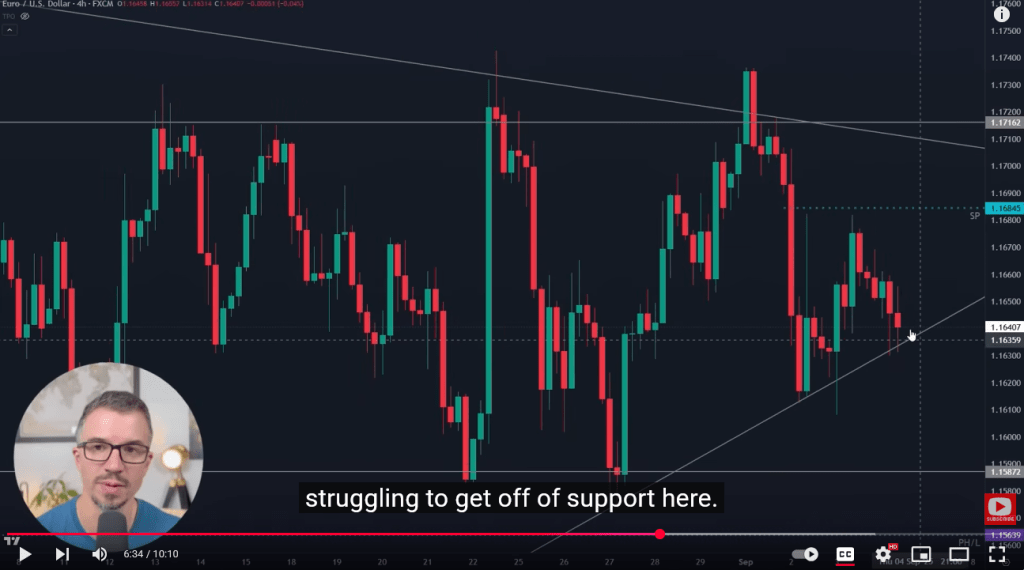
So he did not seem to have the right idea. Why? Because he does not know how to measure stuff.
Where he concluded relative weakness, there was strength.
Can you see how the pullback is unable to take the stochastic into the oversold field?

Can you spot the “time out”, 4 fractals printing outside the 30-sample BB, no volatility, minuscule increments, and the 4th fractal is actually a higher low.

My point here is to find ways to gauge weakness or strength for yourself and don’t be lazy.
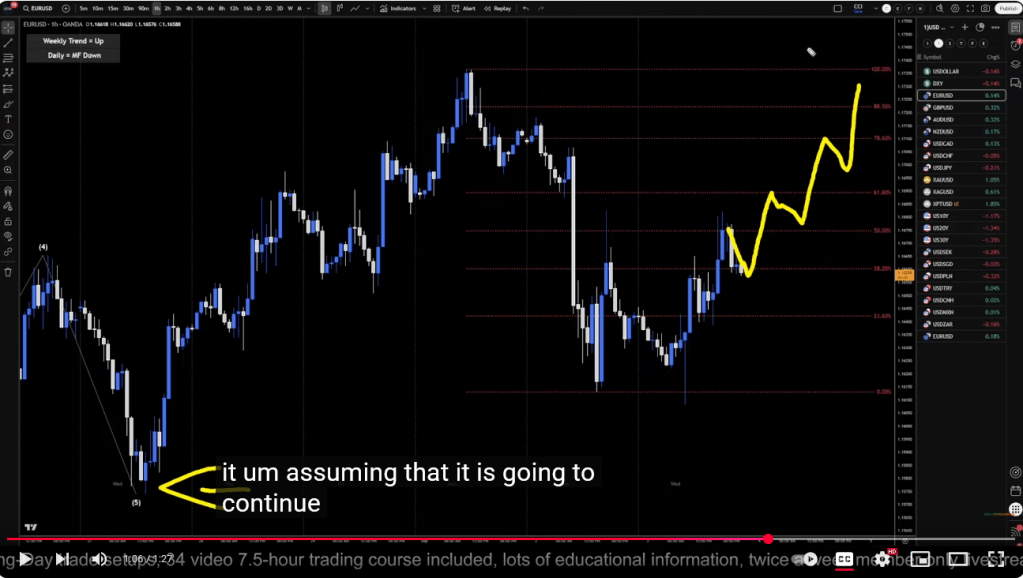
This guy below is always talking about the “struter”. I don’t know what that means, yet it sounds Smart, but Final at the minimum.
Next?
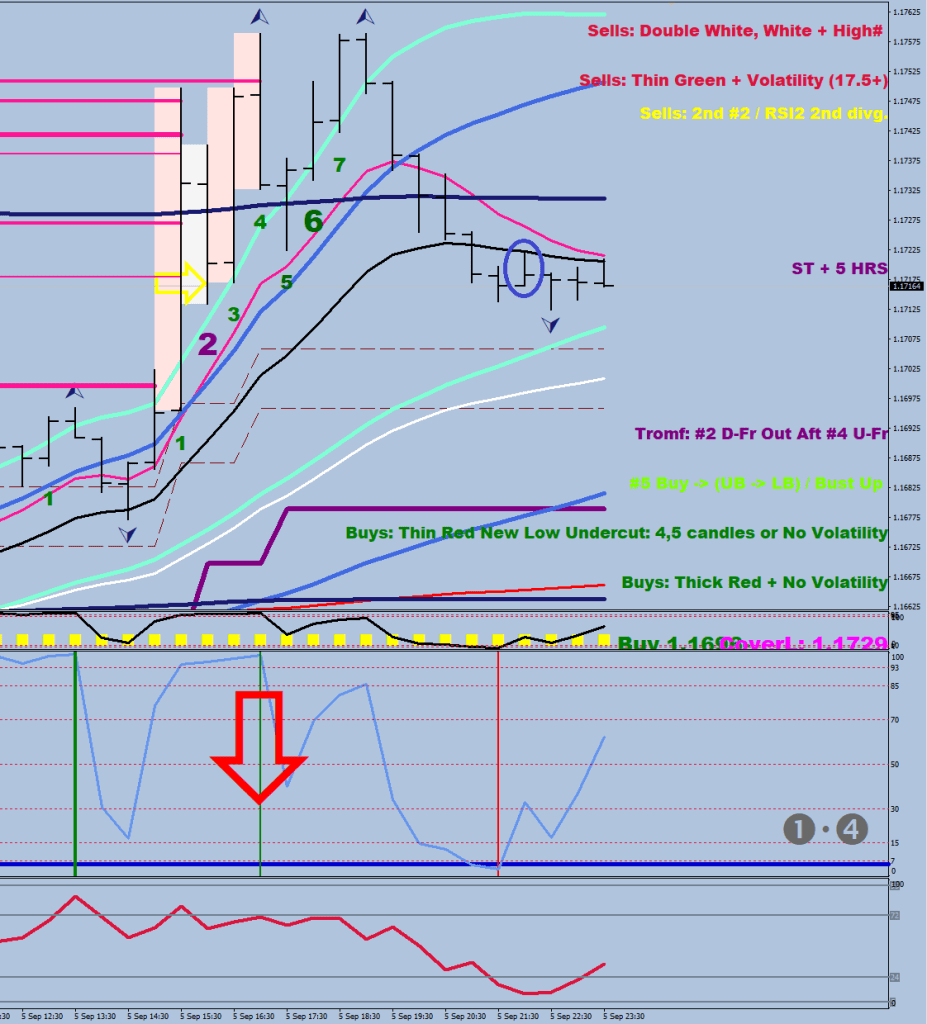
There was a test of the break level on the upside, and a close back inside the yellow line, as well as the house.

This means a failure on the upside. (A mirror image to what happened on the downside with the breakout level – 96 pips from the consolidation mean.)
The high was followed by 3 hours of selling. If it went on for another hour, I would be looking for a test back, into the first established level. What we got instead is some alleviation, taking away the pressure a bit as a relief.
The box on the downside is currently starting at 1.1555. With any future full charge achieved, this value would get pushed about. Multiple hourly closes outside, and you get the start of a volatility expansion run. Measured by the BBWidth

I have found some new ways to abuse things, see album #85.
