
You know, markets love symmetry, and I love people who can’t stop repeating that the market loves symmetry.
Terminal sequences identified so far:
2-M-0-2-M
2nd 2-B-B
2nd 3
1-0-1-B-B (weak)

1 stands for a hit / near miss of the 30-sample BB (1 H). B is a beat before a “0” tie off, which is going over the orange, 12 EMA. The white line calls attention to the close back inside the 12 EMA after a fresh low / high was made within the last 4 hours (versus 6 or more).
I started calling the bow back beats a B as well after a 2 print if they are in excess of 10 pips.
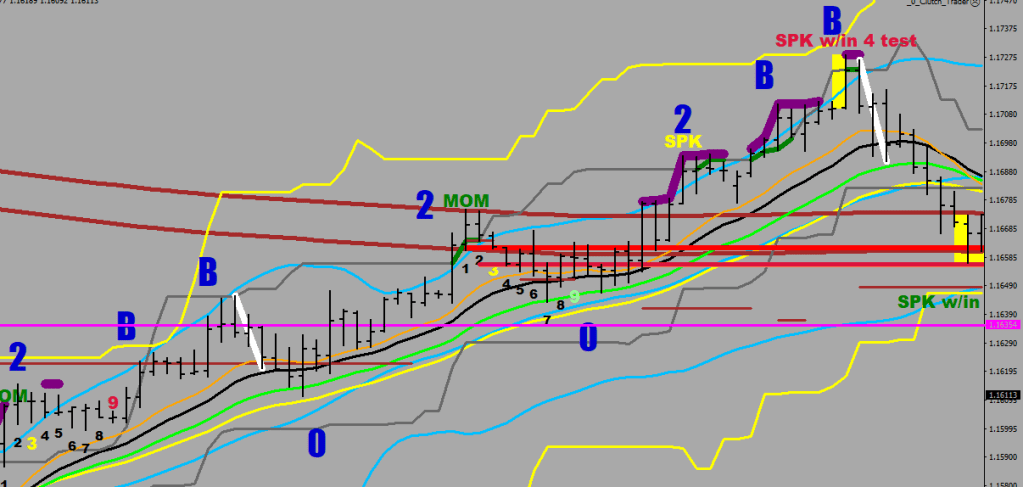
An M is a match, which re-visits the 2 print (a swing high/low beyond the gray line) within +/- 6 pips (of course, without the price getting all the way to the 12 EMA first).
I also believe that it is a good idea to keep track of the price going outside the 30, 120, and 240 Bollinger bands on the 30-minute chart.
////3x out down
 if (Low[i]<iBands(symbol,0,30,2,0,PRICE_MEDIAN,MODE_LOWER,i) && Low[i]<iBands(symbol,0,120,2,0,PRICE_MEDIAN,MODE_LOWER,i) && Low[i]<iBands(symbol,0,240,2,0,PRICE_MEDIAN,MODE_LOWER,i) ) {
               ObjectCreate("MINUSXX"+IntegerToString(i),OBJ_TEXT, 2, Time[i],15);
                ObjectSetText("MINUSXX"+IntegerToString(i),"3x Out!", 26, "Impact", clrIndigo);
            }

////3x out up
 if (High[i]>iBands(symbol,0,30,2,0,PRICE_MEDIAN,MODE_UPPER,i) && High[i]>iBands(symbol,0,120,2,0,PRICE_MEDIAN,MODE_UPPER,i) && High[i]>iBands(symbol,0,240,2,0,PRICE_MEDIAN,MODE_UPPER,i) && (High[i+1]<iBands(symbol,0,30,2,0,PRICE_MEDIAN,MODE_UPPER,i+1) ||  High[i+1]<iBands(symbol,0,120,2,0,PRICE_MEDIAN,MODE_UPPER,i+1))  ) {
               ObjectCreate("MINUSXX"+IntegerToString(i),OBJ_TEXT, 2, Time[i],95);
                ObjectSetText("MINUSXX"+IntegerToString(i),"3x Out!", 26, "Impact", clrIndigo);
            }

In conclusion, the deeply oversold state (poking outside the 3 bands) upgraded the weak reversal signal.
Now, how does this look?

Well, there seems to be a symmetry between the starting leg achieving a #2 and this finishing spike scoring about the same. The previous week’s pivot was backtested on Friday towards the end.
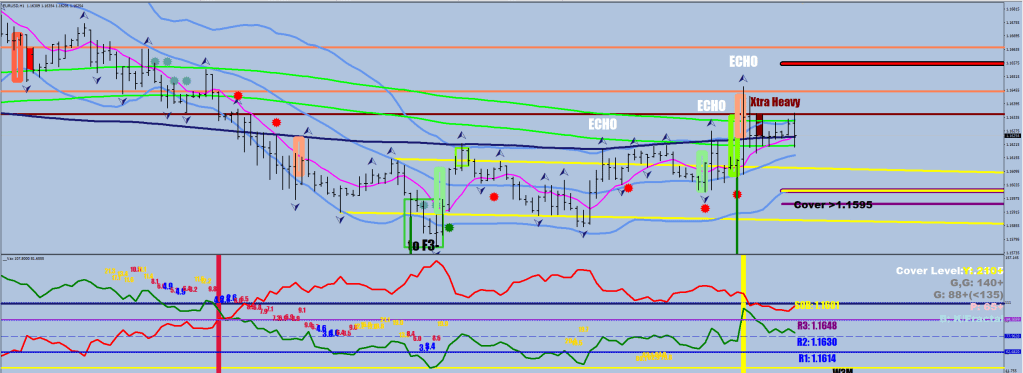
Well, the bears never lost their lead. The bulls were kept in the volatility compressor all along. At the finish, the bears/bulls were 58% to 38%. There seemed to be an extra-heavy long cover at the mean (9-day EMA). Sure, I am biased, 4.25 lots net short. See the glowing green rectangle? That was possibly the Grande after the Ariana in the top left. That hourly close plus 10 pips would be the low-risk short entry.
1400+ songs now in the Topic. On this album, I mostly plagiarized myself, upgrading some older poems.
Some spam from here on.
