
The Euro has been hurdling inside the Valley…
…only managing to get below the 9-day EMA in the last few days. It may be ready to break, but the progress is not very convincing.

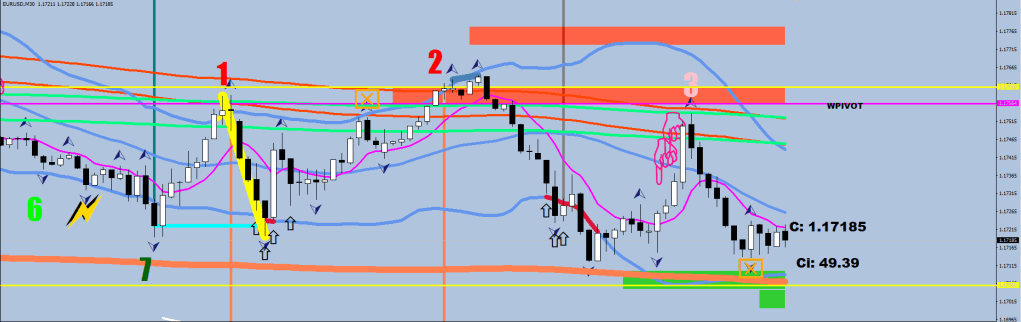
On the Vax you can see that the short lead has been on for 2 days after 5 failed attempts. At the same time, this is all happening within the context of a squeeze: the red Volatility Compression is also in the Doghouse still, inside S3. (S3=R3, depending on which one is on the bottom, you get the prints.)

Not certain of the Blue Arrow plot, to make it stay on, I had to change the filter (it did not affect all the previous plots). That small box – big box – green arrow sequence is a strong taper.
if (i>0  && Open[i]>iBands(symbol,0,120,2,0,PRICE_MEDIAN,MODE_LOWER,i)
         && Close[i]>iBands(symbol,0,30,2,0,PRICE_MEDIAN,MODE_LOWER,i)
         && Close[i]>iBands(symbol,0,120,2,0,PRICE_MEDIAN,MODE_LOWER,i)
         && Low[i]<iBands(symbol,0,120,2,0,PRICE_MEDIAN,MODE_LOWER,i)-10*Point
         && Low[i-1]>Low[i]
       //  && Low[i-1]>iBands(symbol,0,120,2,0,PRICE_MEDIAN,MODE_LOWER,i-1)
 && (iLow(symbol,30,i)<iBands(symbol,0,30,2,0,PRICE_MEDIAN,MODE_LOWER,i)+60*Point || iHigh(symbol,30,i+1)-iLow(symbol,30,i+1)>60*Point)
)
Earlier, I had this idea that the scrape low (1.1703) was gonna get run and we’d see a 30-pip undercut. Still could happen, but the level of confidence went way down. More volatility compression here (black arrow prints, fractals falling short of the 120BB) would mean a bottom.
