
Can’t think of anything more reassuring than when someone with a net worth of 712 billion USD tells you: money would be irrelevant.

China: Build Your Dreams. Musk: I’ll sell you your dreams.
Now, some elusive subjects, such as momentum and holdings in real time.
It is tempting to think in symmetries. In the world of filters, this goal is a vanity project.
My proxy for measuring strong momentum is the Stochastic Bars Hybrid. On the upside, I use a 25-sample stochastic with the last 10%, on the downside, I use a 60 and a 100-sample stochastic with the last 5 and 3 percent. The logic is what works best.
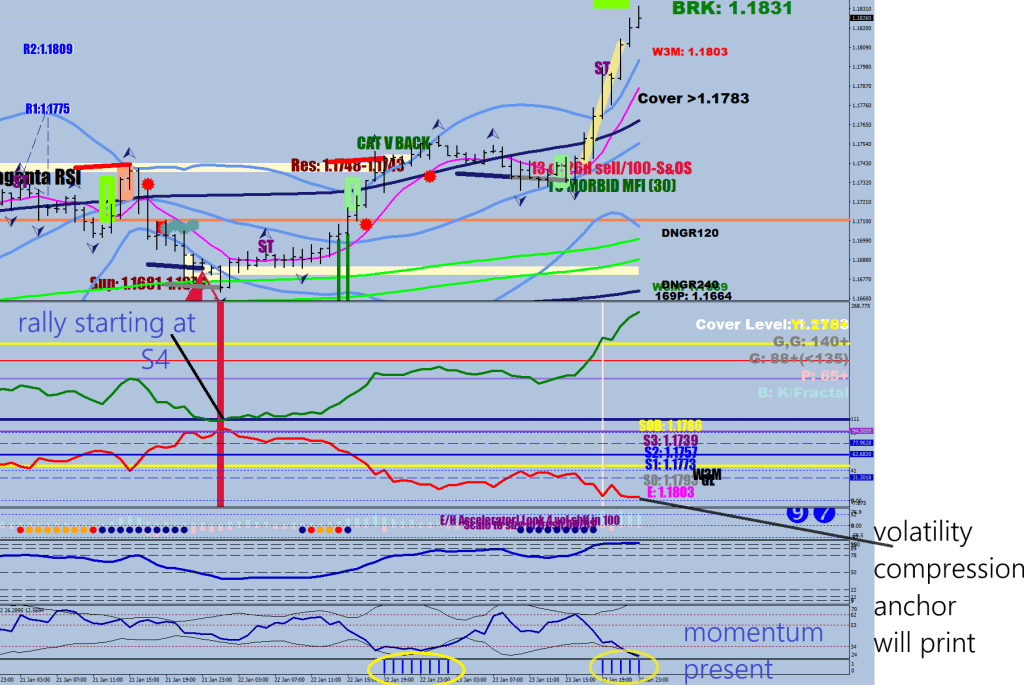
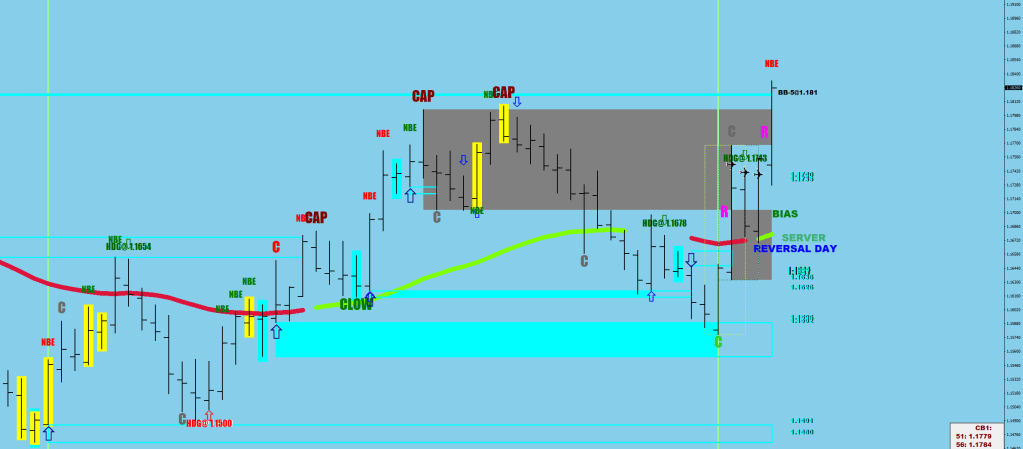
With the invention of Vax, that is measuring directional volatility from the 200-hour high and 200-hour low, you now have a tool that can give an instant read of holdings as well as plotting short-term changes. i.e., the shorts have the upper hand. What are they doing lately? Covering.
When the two distances converge, is there an instant reinforcement (rejection)? When they start to diverge again, has the leadership been switched over? Being outside the S4 / R4, of course, means stronger domination.
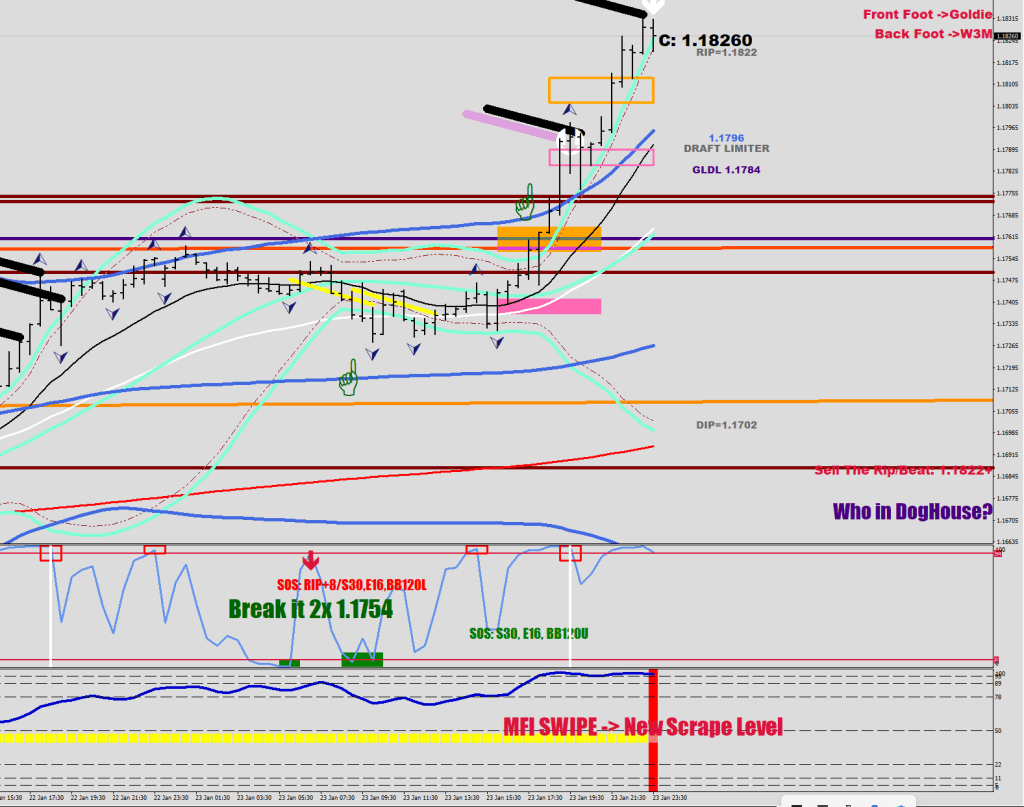
Now, there’s a buy momentum entry filter. I can now say that momentum buying happens inside the BB30.
The two gigantic arrows below: both happened with a flat brick, the first one was right after a triple False Break sequence.
///RSI2 momentum buys if (RSI2[i]>RSI2[i+1] && RSI2[i+1]<RSI2[i+2] && RSI2[i+1]<7.4 && Low[i+1]<iLow(symbol,0,iLowest(symbol,0,MODE_LOW,4,i+4)) ){ if (MFI[i+1]>29 && Low[i+1]<Low[i+2]&& MFI[ArrayMinimum(MFI,7,i)]<15 && RSI2[ArrayMaximum(RSI2,5,i+2)]>50){ ObjectCreate("Citeral"+IntegerToString(i), OBJ_TEXT, 2, Time[i+1], 115); ObjectSetText("Citeral"+IntegerToString(i), CharToStr(233), 144, "Wingdings", Purple); } }
The last add-on entry was an RSI2 taper (late in the game).
Small brick – big brick combo.
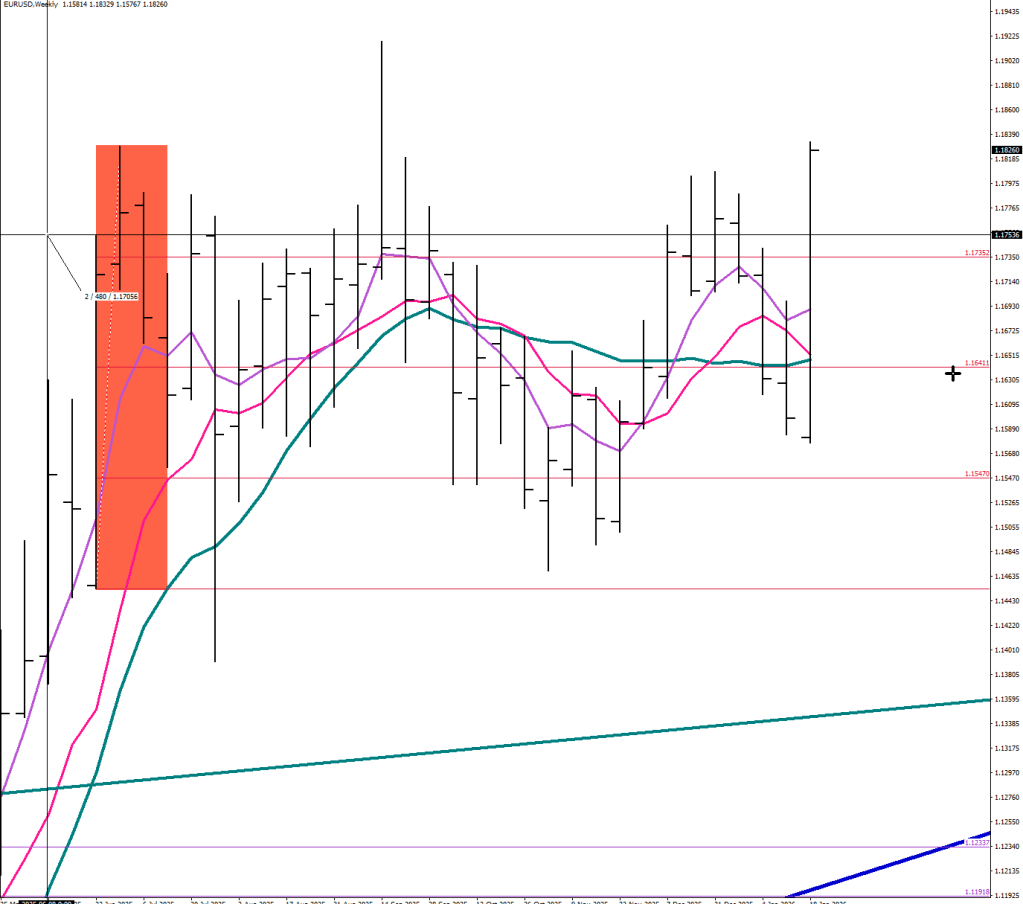
This is looking like a 5-wave structure.
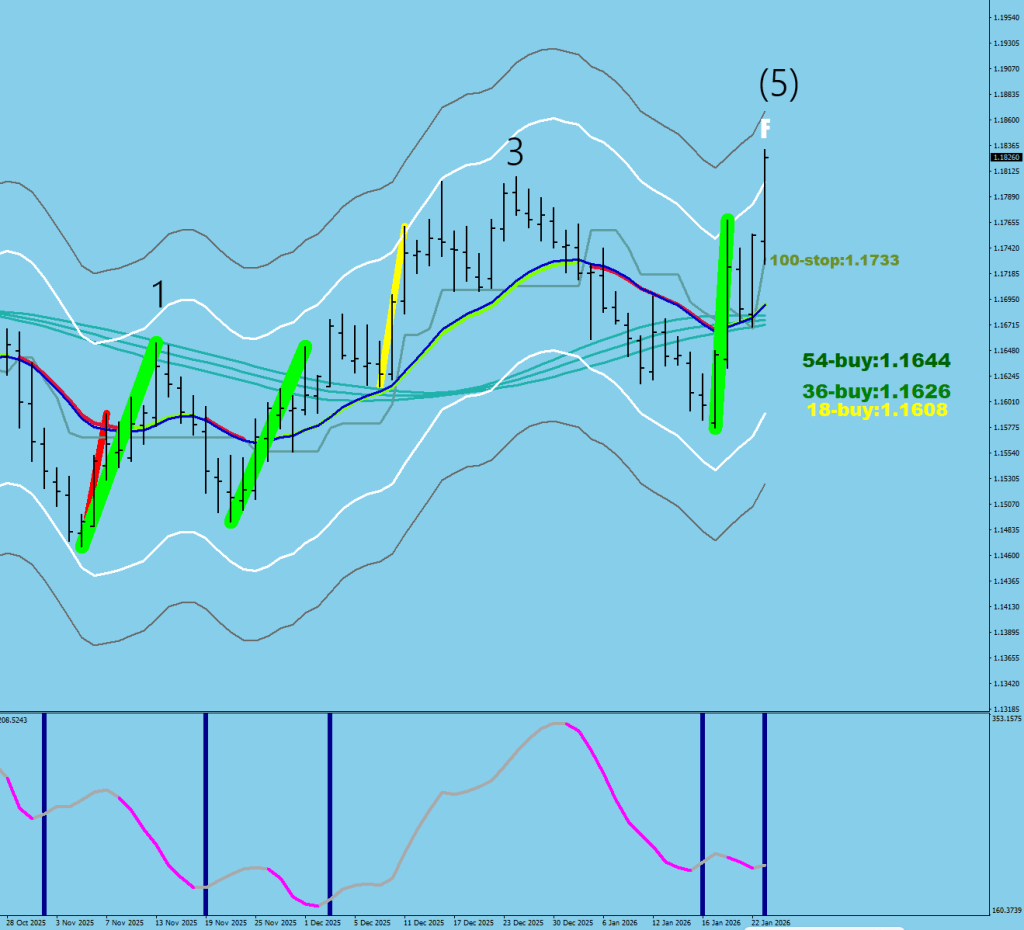
Admittedly, the close was on the high, so another higher high should not be a surprise.
The last volume block was violated; there is no clear/visible target currently.
Sure, there was a high made at 1.1918 earlier, but I don’t think it could be made without a 45-pip pullback first.
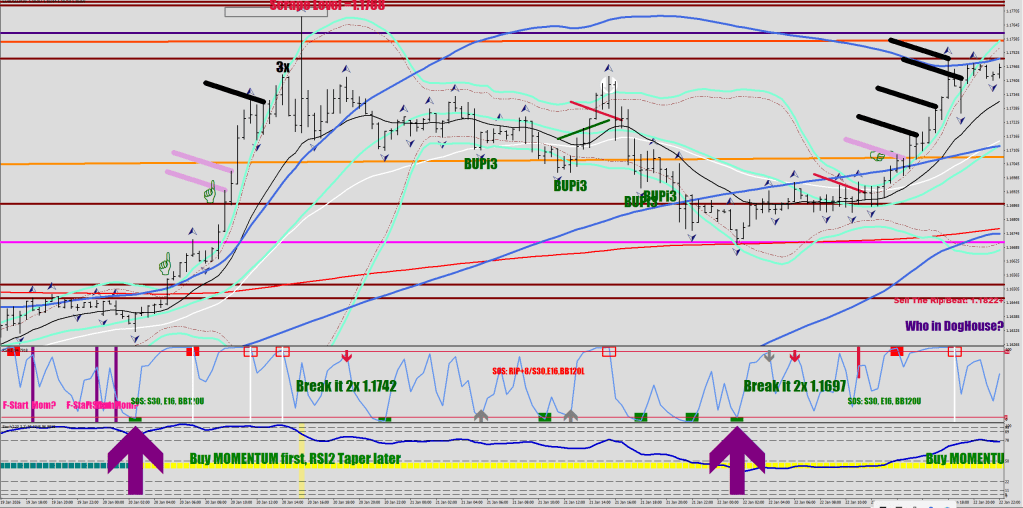
In the image below, the green horizontal arrows are break-outs with their associated statistically achievable displacement. These arrows are a really good buy when they print near the red line (9 EMA), but would be a fake out near the two bands.
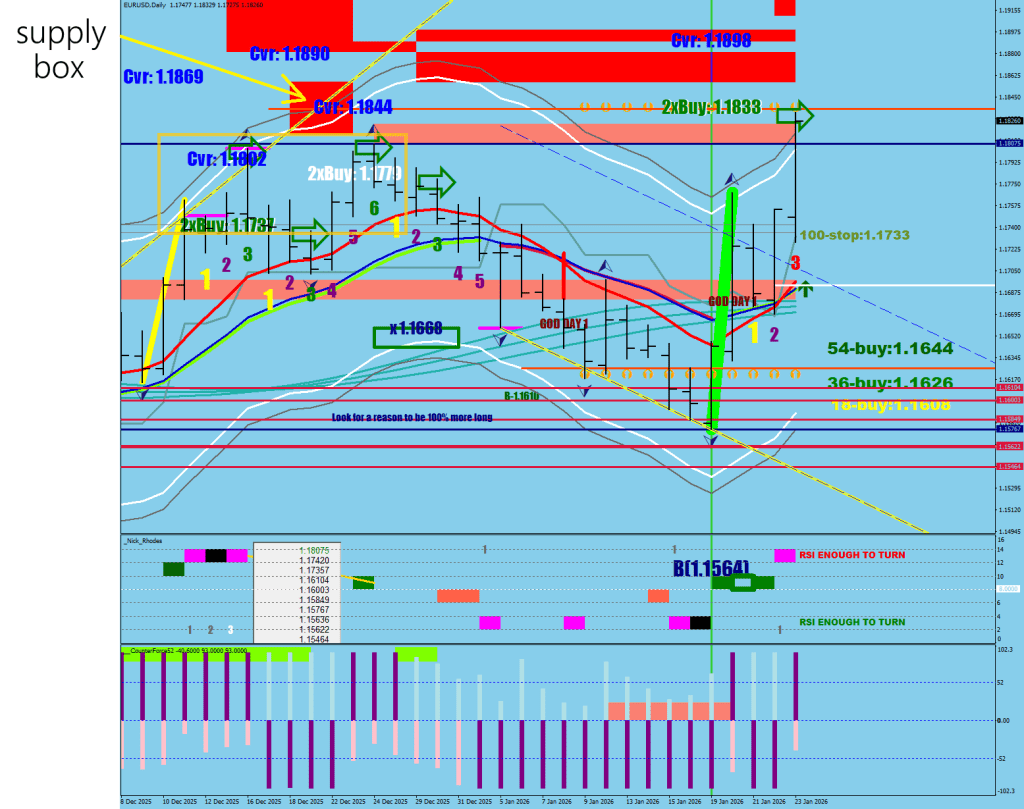
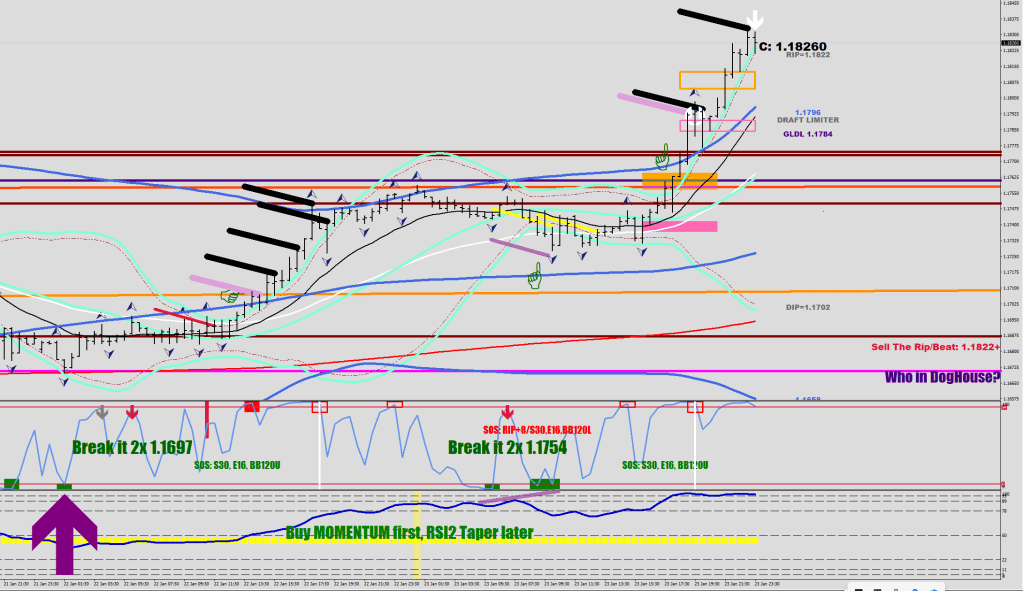
We just tapped into the supply box of the last breakout cover leg (1.1737 to 1.1802), but admittedly showed no reaction by the close. The 1.1779 arrow was violated, and it has a cover associated with it, starting from 1.1844.
The summary, a higher high cannot be ruled out, a move to 1.1844 is possible around the open, but to tackle the 1.1918 high, the new leg would have to come from below the daily 16 EMA.
If the high stays intact, and the fractal settles, you would be in a sell that is indefinite.
(I had to rush the plot by calling this location a full fractal)
(Close[i+1]>iBands(symbol,0,30,2,0,PRICE_MEDIAN,MODE_UPPER,i+1) && Close[i]<iBands(symbol,0,30,2,0,PRICE_MEDIAN,MODE_UPPER,i)+20*Point && MFI14[i]>80) instead of iFractals(symbol,0,MODE_UPPER,i)
