
A quick lesson about relative strength, short-term volatility, and statistics in trading.
The first thing is the daily RSI2. Statistically, it does not stay in this block for more than 5 days, and we already had 4.
Examples from the past:
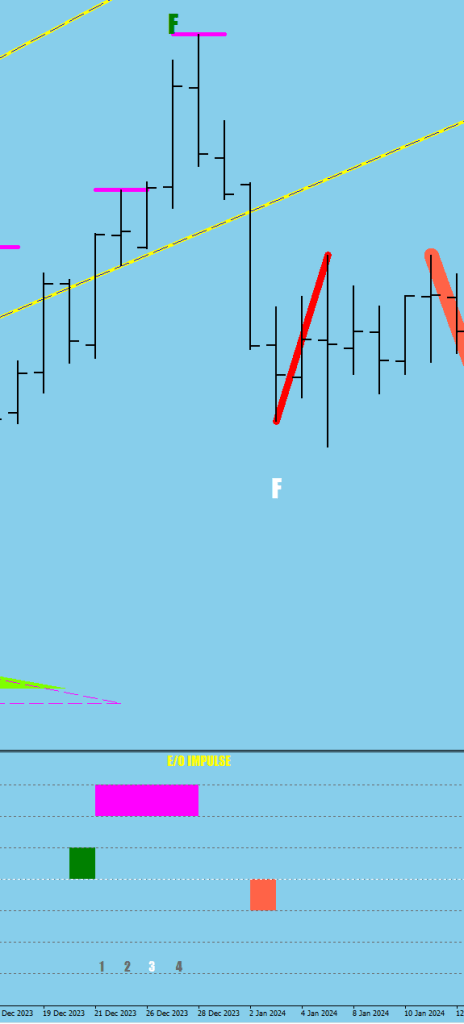
The magenta prints are in the (RSI2<5.3 and RSI2>2) or (RSI2>96 and RSI2<98) zone. The numbers are there to keep track of the quantity.
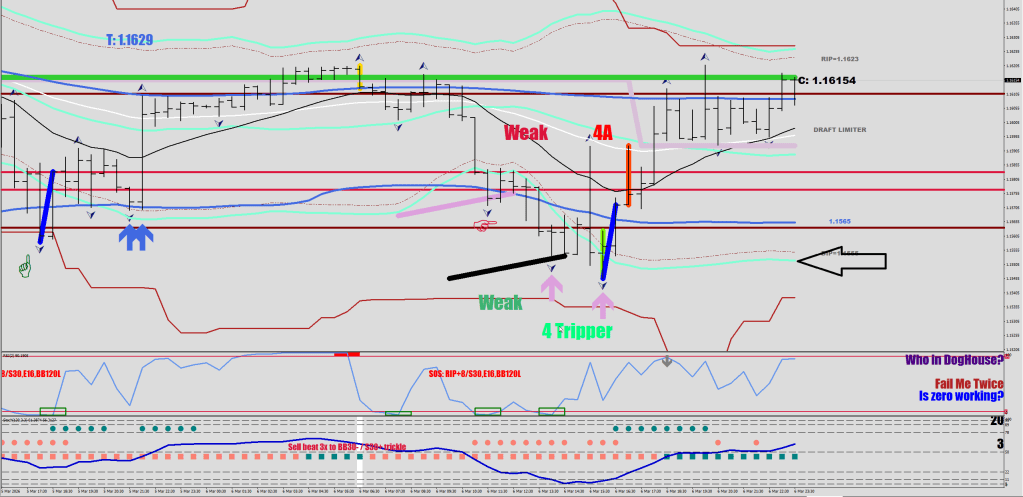
This basically means that there may be one more daily lower low (if) on Monday before a lift.
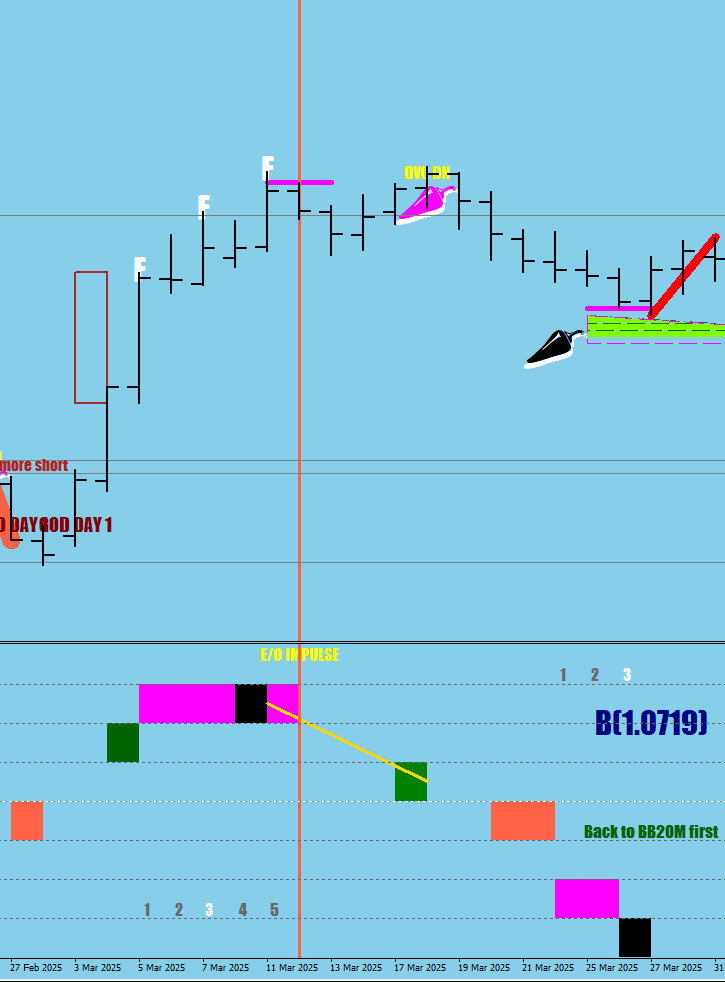
It becomes even less likely to make a new low if I bring up my latest volatility plot.
I have not talked about the dots until now (black arrows).
I did not know how they would come in handy immediately, but I have figured it out since.
We are talking 6-sample volatility measured from the current close to the lowest low and the highest high (30-minute).
volup[i]=NormalizeDouble(MathAbs((Close[i]-iLow(symbol,0,iLowest(symbol,0,MODE_LOW,5,i)))*10000),0);
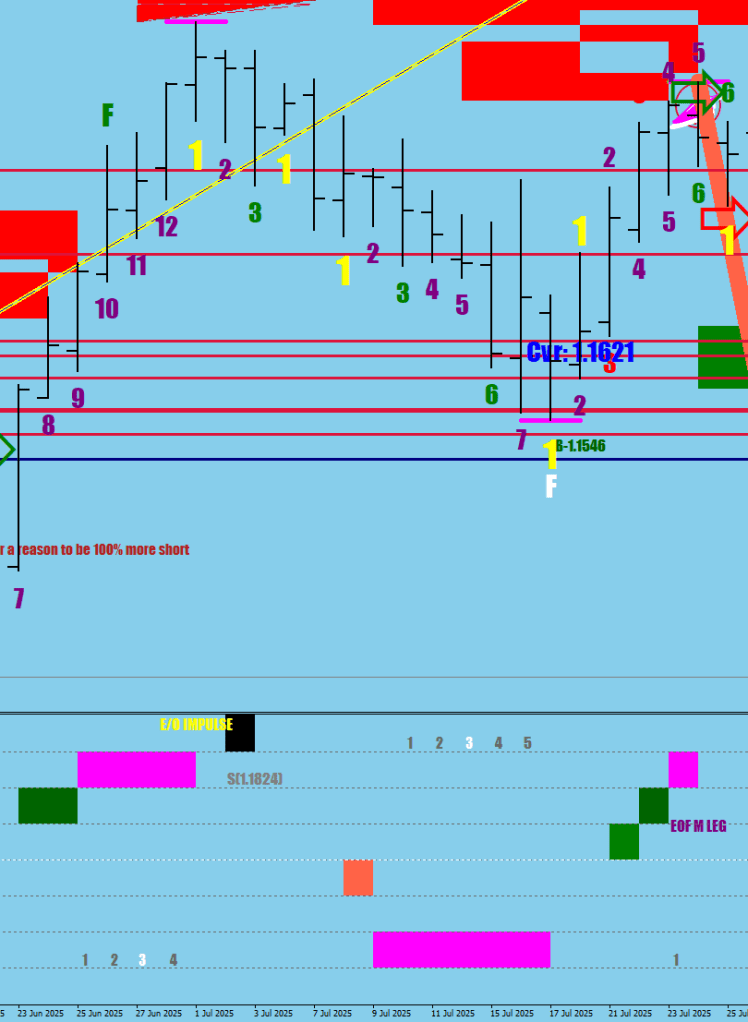
voldn[i]=NormalizeDouble(MathAbs((iHigh(symbol,0,iHighest(symbol,0,MODE_HIGH,5,i))-Close[i])*10000),0);20 pips does not sound like much for a 6-candle “progression”. But it becomes extra important when the market is off the rails (outside the 120 / 240 sample BB), and you get back-to-back two candles with both sides scoring. I’ll show you what I mean.
The blue rectangle circles a 2×2 rapid fire.
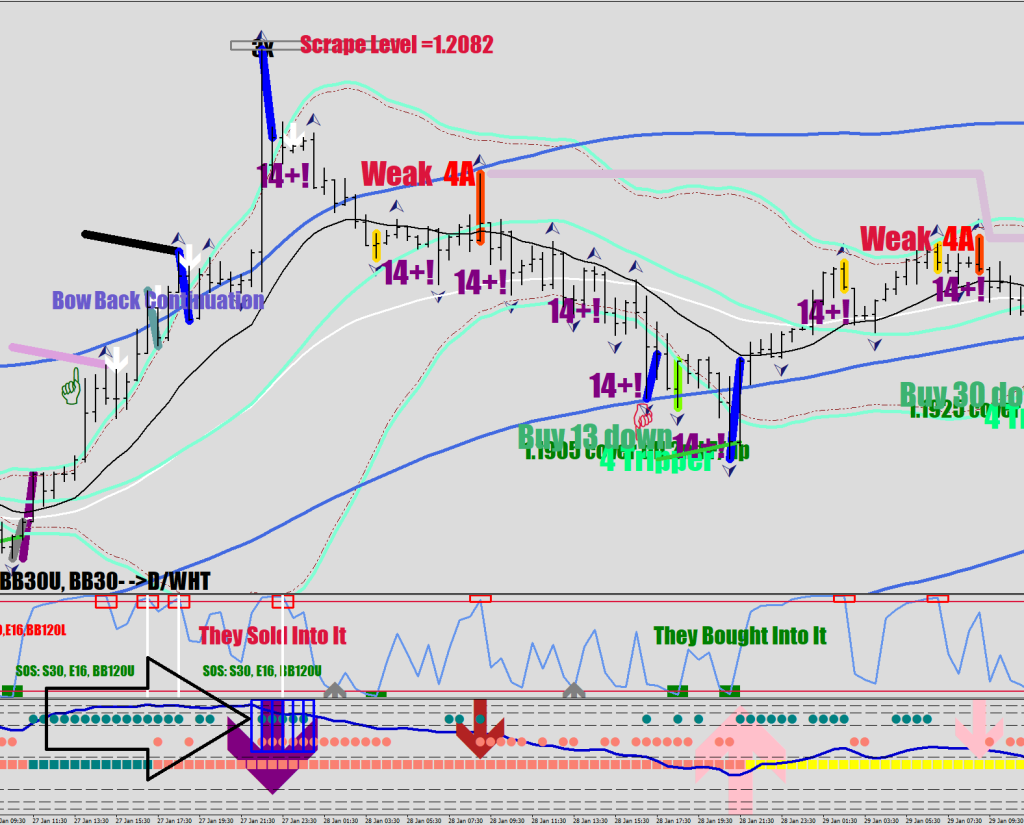
Once that peak was made, it remained untouchable. A 4A print was needed for the downtrend to kick in.
Can you spot the mirror image?
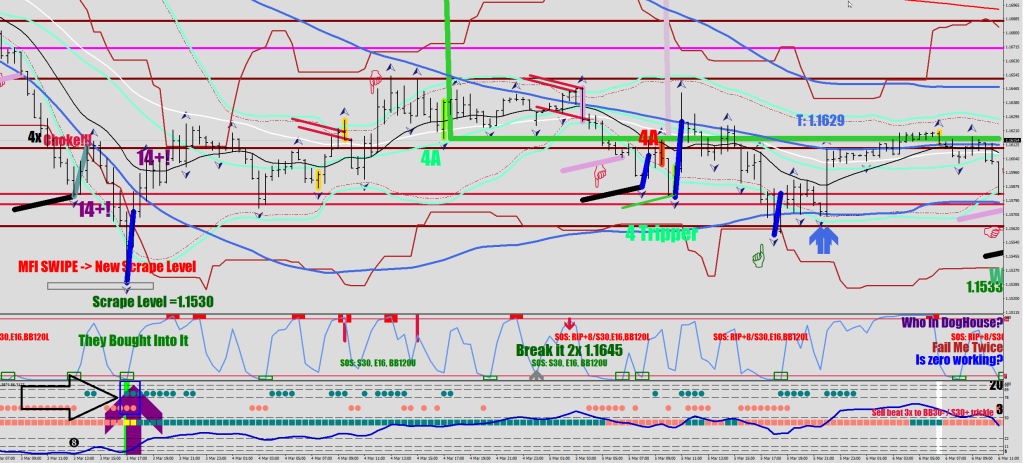
The 14+! increment, the MFI Swipe (=They Bought Into It), the New Scrape Level made. It’s just the number of boxes that was less. The stretch achieved a 6x fluctuation maximum versus 8x at the top. The number of boxes did not mean anything beyond the first print; the volatility remained elevated in both directions for longer in the first example.
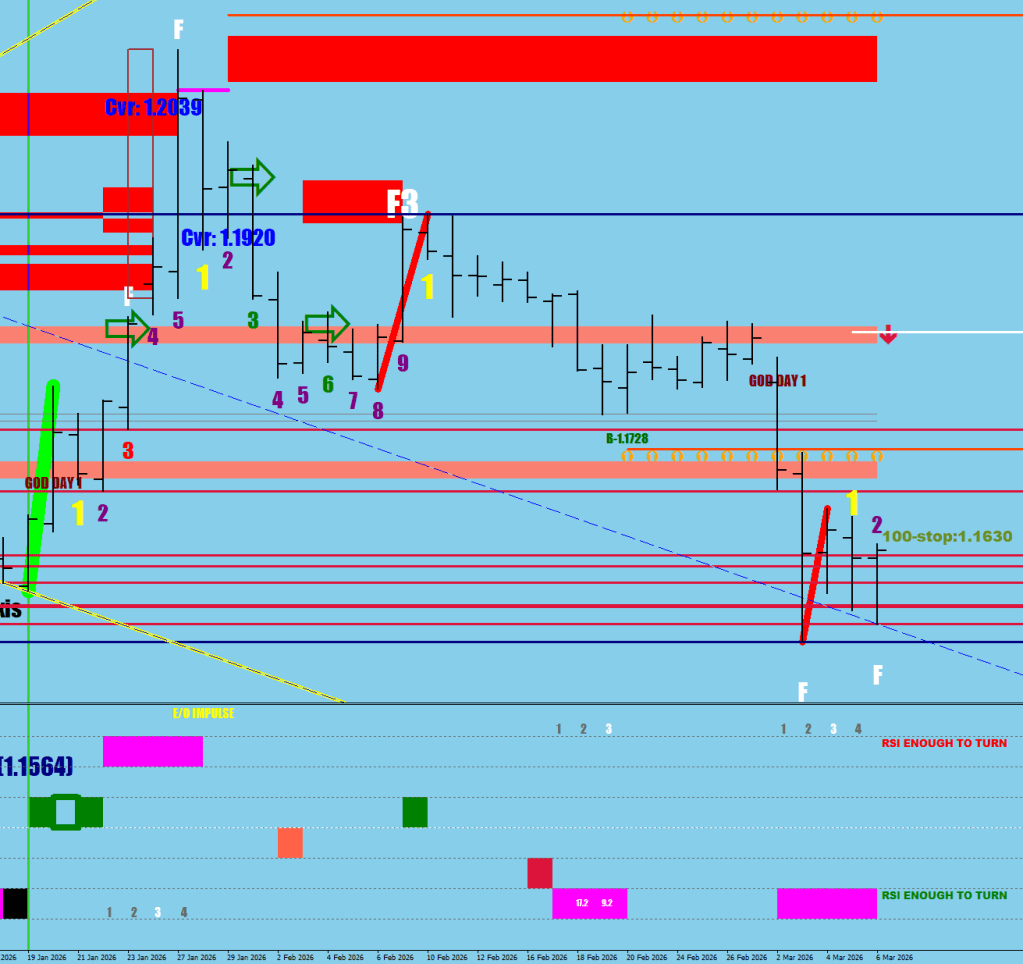
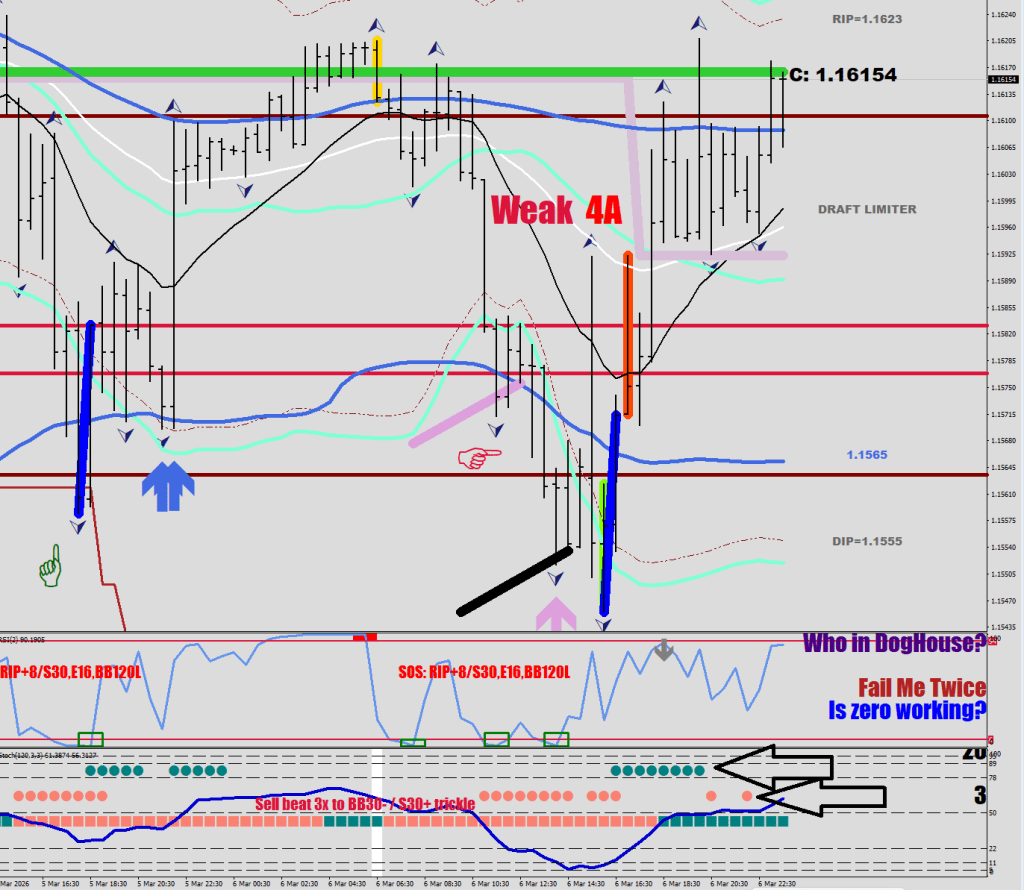
Now, the 4A part.
We have had a 4A print earlier, but it was too high, above the S30.
We have been waiting on the BB30 to expand and move lower to accommodate a near miss of the current low and kick an uptrend in motion.
I had another lesson in mind as well about spotting what they are selling (rip) or any strength (RSI2>85) when the market is off the rails, but I’d rather not veer your attention away from what is a more important subject.
Oh, the title? A song reference. Adolphamine, at your own risk.
