(off topic)
This is my only paid surface to publish about things that are important to me. At the same time, I think you may find this one interesting.
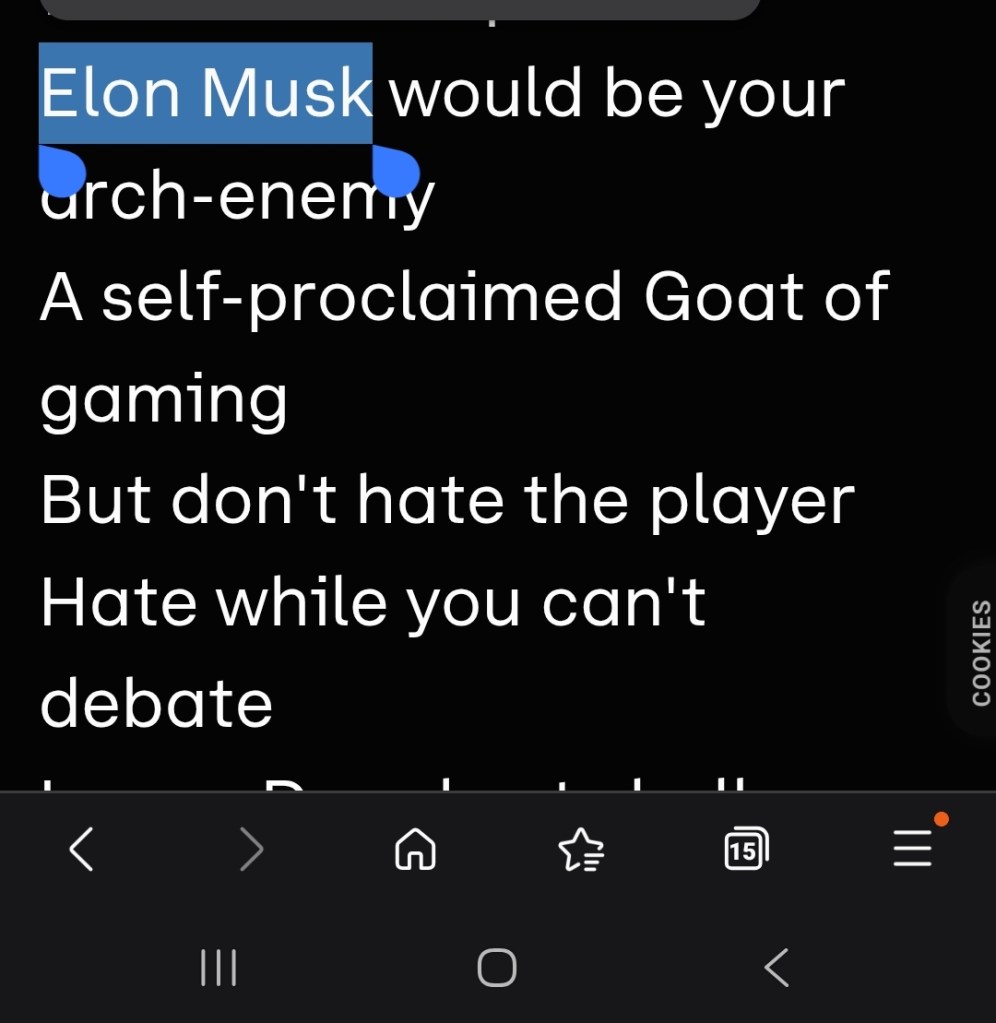
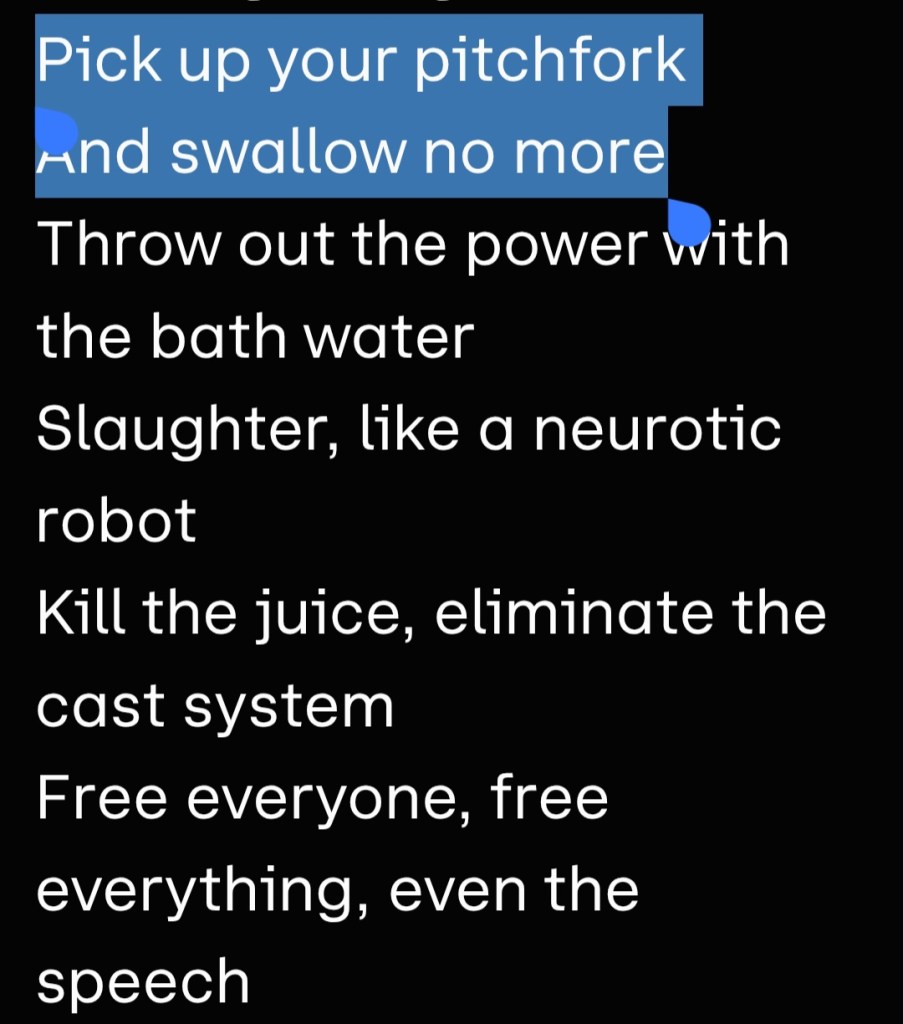
lyrics, everybody
There are 3 areas where large language models fall short. The first one can be learned to an extent with enough examples.
This is frequent switching off between languages. Like when I write “Monchici with the mochila drink some agua para tomar.”
The second is layered meanings. This has to do with emotions and context. AI would never understand feelings; all it does is assign probabilities. For instance, poetic stuff like “how long did persistence last, all you ever do is relapse” – AI does not have examples of the “persistence” being followed up by “last”, and so it would never make up an order like that.
In the same song, I wrote: “I know it’s a quantum world, the bird is the word is the bird.”
Beyond the unusual sentence construction, this is a poet’s parallel to pass on a take on quantum entanglement. The array of meanings has an emotional level that cannot be understood by a machine.
And now we are going deep into the connection between language and intelligence.
AI hallucination = male mutation. I see a challenger that would probably speed up evolution itself.
Even without AI availability, I was always of the opinion that the Hungarian language was an extra fine tool capable of passing down some extra logical circuits, improving on the user’s problem-solving ability (general intelligence).
The language reforming part is advanced-level poetry that computers would never be able to get the keys to.
When I say in Hungarian “megtihalvad a tihavér”, good luck finding the meaning of that anywhere. I know, especially today, people are of the opinion that changing words can mean translating into another language. I’ve got news for you.
Some things only receive meaning within a context, or all they meant to do was fine-tune emotions.
I can, for instance, combine two words into a third, and people who have never encountered this new word, but are in possession of the language (understanding it on the level of emotions), can derive a good comprehension of what I intend to relay.
If you want some examples, my poetry’s cornerstone is shaping the language:
“Mert meghetedni nem tudtam, meghatódtam”
Meghetedni is not an existing word, a humorous twist involving numbers
“vidámkás” – everyone would understand that this means the opposite of “szomorkás”, but likely no one has ever used it since the language has existed
“bennszülôk és bennszülöttek”
“tékenyek es féltekenyek”
words that have never existed until I wrote them down, making fun of the precision of the language itself.
“kvarcba boldog jövônkért megyünk” is a twist on the Communist-era slogan with a word that is “allowed” by the logic of the language, but there was never any real need/use case for it; on a first read, it is meaningless.
“Vokhagyma” is a reference to Germans pronouncing a V as F
In Hungarian, the exceptions are more common than the rules. Go, find a logic for that.
Macdulio (the 1st) said about me once that “he says 3 words with 2”.
The end is the beginning is the end
Udio has eliminated the download function with the merger and given me a lot of headaches with having to record streams in real time that got infected by artefacts, and YouTube was dragging its feet for several months in accepting music.
I had no clue going in to this 6 months period of “composing and not sharing anything”, that British Pop and, in particular, Billy Corgan would steal my thunder.
I made 8 tracks earlier with his voice. Not once did I ask for Billy Corgan or Smashing Pumpkins. You simply can’t do that; the voice you get is the result of a Roulette Shuffle. Impressive enough (very unlikely) that you would get the same voice 19 times in 2 months. (Like spinning number twenty-one nineteen times out of 200 roulette spins, and there are way more than 37 numbers, and the decimals play as well.
Very unique, even more than Simon LeBon. I always liked its tone, but never purchased a Smashing Pumpkins album. I would recognise things like “The world is a vsmpire”, I would be able to finish some of their lines, but I never learnt a single song title. I learned Billy’s name after having made 4 songs with his voice.
My prior Billy Corgan songs (8).
On this album, Simon LeBon and Sir Francis Neil Tennant share playtime. Not sure if I ever paid for Duran Duran (other than Come Undone in the jukebox), but I definitely bought some Pet Shop Boys
My Simon LeBon/Duran Duran-like songs (41).
My PSB-like songs (37). (The abuse that I put Neil Tennant through was way worse than what Freddy or Billy got from me, well, Ok, maybe besides Prince and Britney.)
The best (white) male pop singing voices (according to me)
Simon LeBon
Dave Gahan
Billy Corgan
Neil Tennant
Morten Harket
Marian Gold
George Michael
Peter Heppner
Marc Almond
Kimmo Karjalainnen
Klaus Meine
It’s no secret that the world is in darkness tonight, nor is it that I have made some of the best DM songs.
101 was an opportunity to round up the concert tour made in the US (named after the Highway of course). If you are interested in how fascism works around music bands, make something in the synth-pop genre and try to present it to DM fans. You’ll find out. The protectionism and denial you’d encounter would be unbelievable. Filtering for music on an ideological basis is a very real thing.
My DM/Dave Gahan-related songs (56).
67 Hungarian songs, 23 new French, 2 German, 1 Norwegian, 1 Romanian (I hold Romanian to be the ugliest spoken language on the planet, but with this song, I have no issues.)
The French connection? There isn’t one. I like Mylene Farmer songs (I bought most of her CDs). She’s Canadian, but I would not know this if I did not work at Le Bateau Ivre, where Julien told me that. The language is very musical to the point of qualifying as an additional instrument.
I was once in Paris, where they stole my daughter’s shoes out of the hotel room.
What else? 2 Snoop Doggs, 1 Jay-Z, 5 Madonna, 3 Jackson, 3 Prince, 1 Marc Almond, 3 Linkin Park/Chester Bennington, 1 New Order (no Britney, but some Rihanna in this batch), lots of Punk (Robert Smith-like), classic Disco, indie, synth, & rap, a bunch of Alphavilles (From them I bought everything, the 8 Dreamscapes albums were really hard to find).
My Alhaville-like tracks (62).
I have a musician friend who is very much against AI, particularly Instrumental music, as for him to make a track, he puts in 50x the effort. Well, the idea of pressing a button and getting a good quality and enjoyable track is false. Suno generates 89Kbps MP3s, which have the use case of a political satire song for Scared Ketchup. They went down all the wrong avenues. At the same time, while Udio has included a lot of gimmicks, the quality can hit 192Kbps, and the 35-second blocks system with lyrics placement makes it a professional tool (generating lyrics is its NEON Achilles heel.)
What gives value to an AI instrumental track?
Life is a hospice. Listening to music can be pain-relieving via hijacking your emotions. An accelerator for getting into a certain mood, a way to open up memories. The substitute for music is still music, no matter how it was made.
An AI instrumental track is a capture, with a great deal of chance. Can you not appreciate a nice photograph? Would you always take an issue with what filters, hardware/software were used, or could you just judge the image as nice, worthwhile, & an unrepeatable moment?
For me, instrumental music making requires knowledge of performers to try to influence the outcome, taste, luck, and lots of credits (real money). You are working with your likes, your esthetics, your judgement, your feelings. This is what producers do. I like to experiment, but I do have a returning mean, which is Chris Spheeris-like smooth jazz (at a minimum, you would start producing more milk with this kind of music), thanks to spending 12 years around the KKSF broadcaster, and of course, taking a liking to it.
By the way, music bands are filters, flavours. Of course, you can hype anything up, but besides the singer’s voice, there is the instrumental park and the BPM range.
Two tracks for highlights.
Baffling why the above Daft Punk hasn’t gone viral.
If your mind is still saying that AI music lacks in quality, try one of these (Riffusion is better than Suno, around 128Kbps, but still behind Udio):
I have only received Mercury for voice 3 times. I’ve been hoping for a George Michael, but no luck so far (it feels like he wasn’t included in the trading data). With the new batch, I have gone unusually unpolitical. Even the parodies are mostly just that of DM songs.
Made a couple of Sting songs as well, the newer generations don’t even know his name.
What do you know, I have made a song called “AI is never going to be conscious”. I let AI hallucinate some music to it.
Speaking of hallucination,
The last thing to talk about is how free speech is waived at YouTube.
Therefore, I would suggest not writing a song where you call out powerful billionaires by name and make suggestions about what to do with them. As my example shows, an album could just disappear with 18 songs on it, because someone did not approve of what you said. Even if the title was “Quest For Free Speech”. Your content may become “ineligible” at once. Trust me, I managed to hit the limit of freedom.

I only started uploading to a Topic ftom ny 8th album.

This is what you can make with 2000 tracks released in 15 months. Minus 30% witheld for foreign income, the currency conversion and the handling fee.
Which does not cover the Udio credit purchases, the Distrokid yearly fee & the NCH mastering software. You know I am not in it for the money, because there isn’t any in it. 1700 songs (average 3+ per day) aren’t enough to make a penny of profit, even excluding your own time and writing efforts. I am doing it because it is therapeutic, and sharing it because I think it has value (easier passing).