Facts

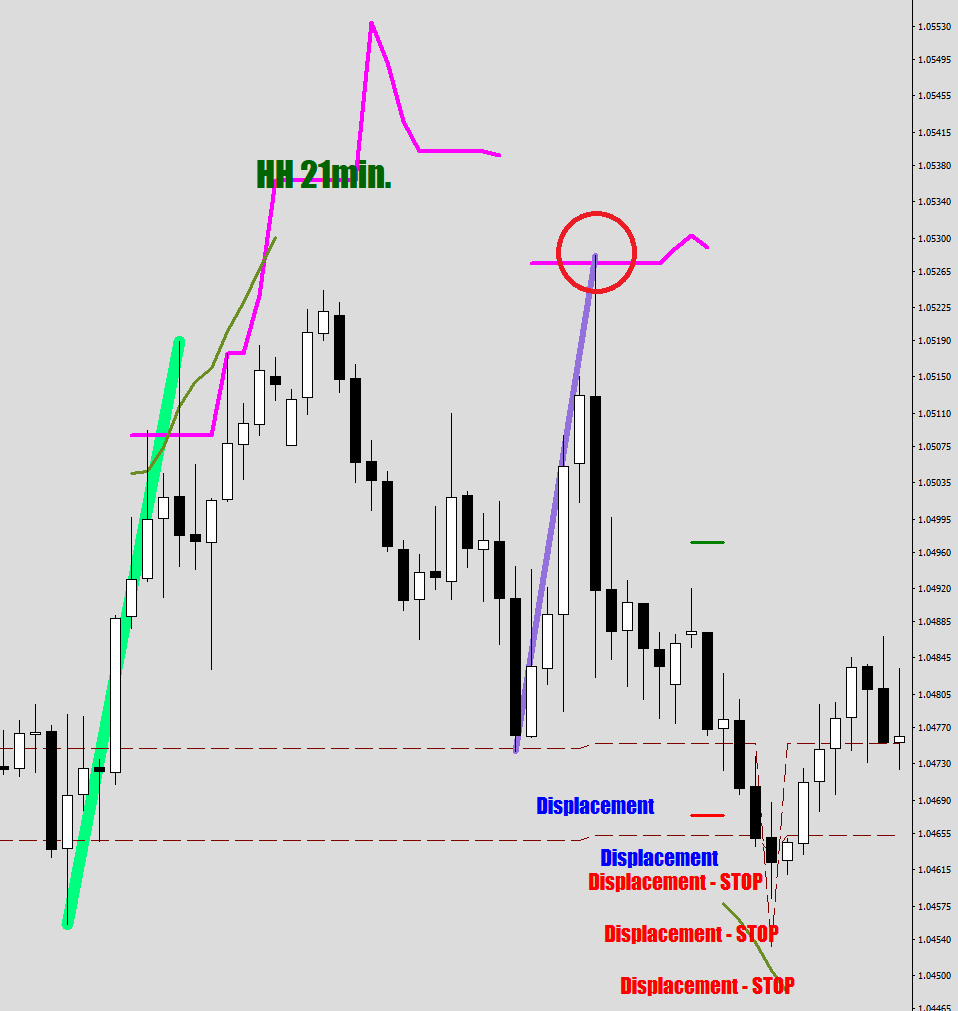
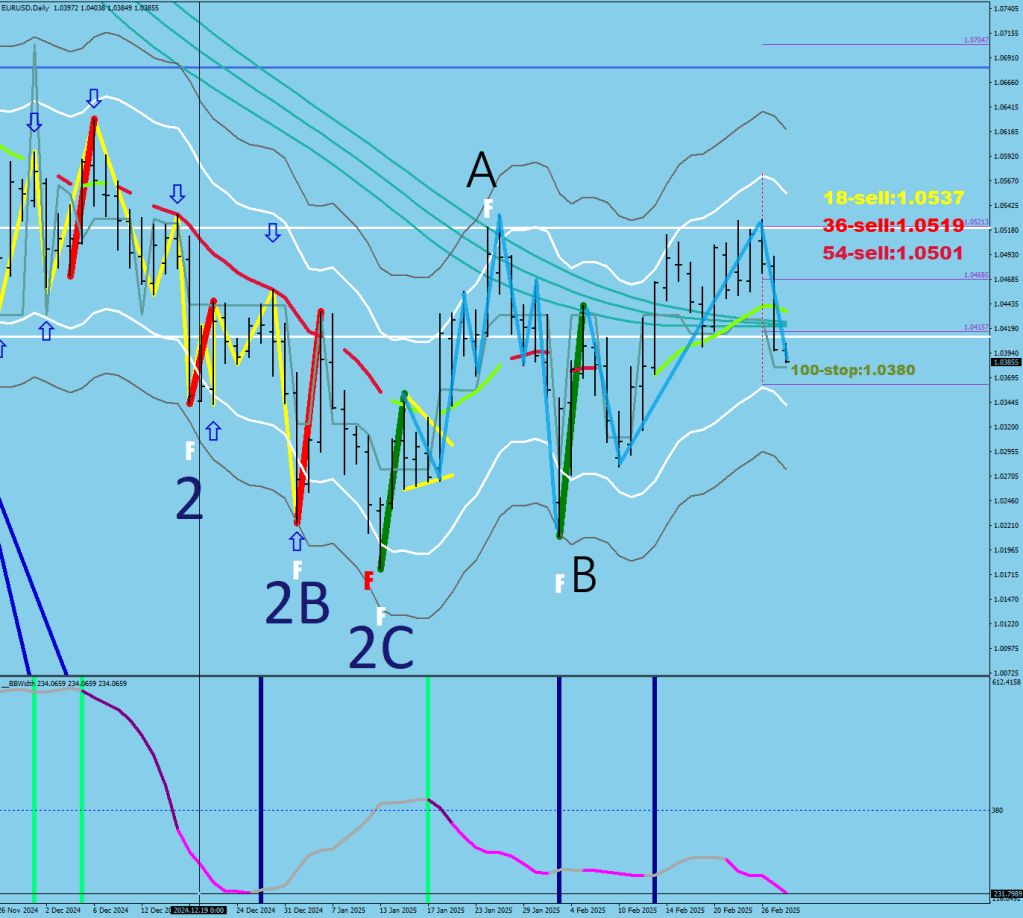
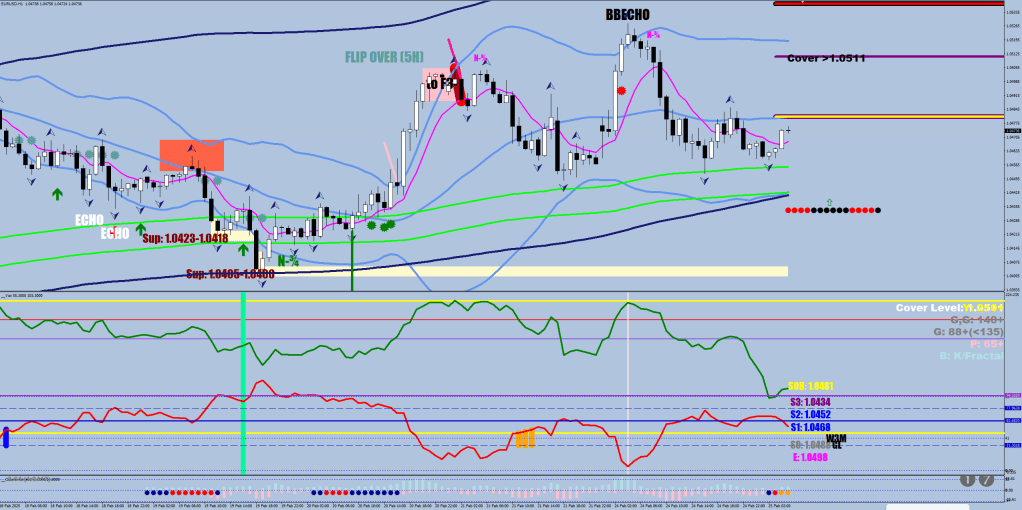
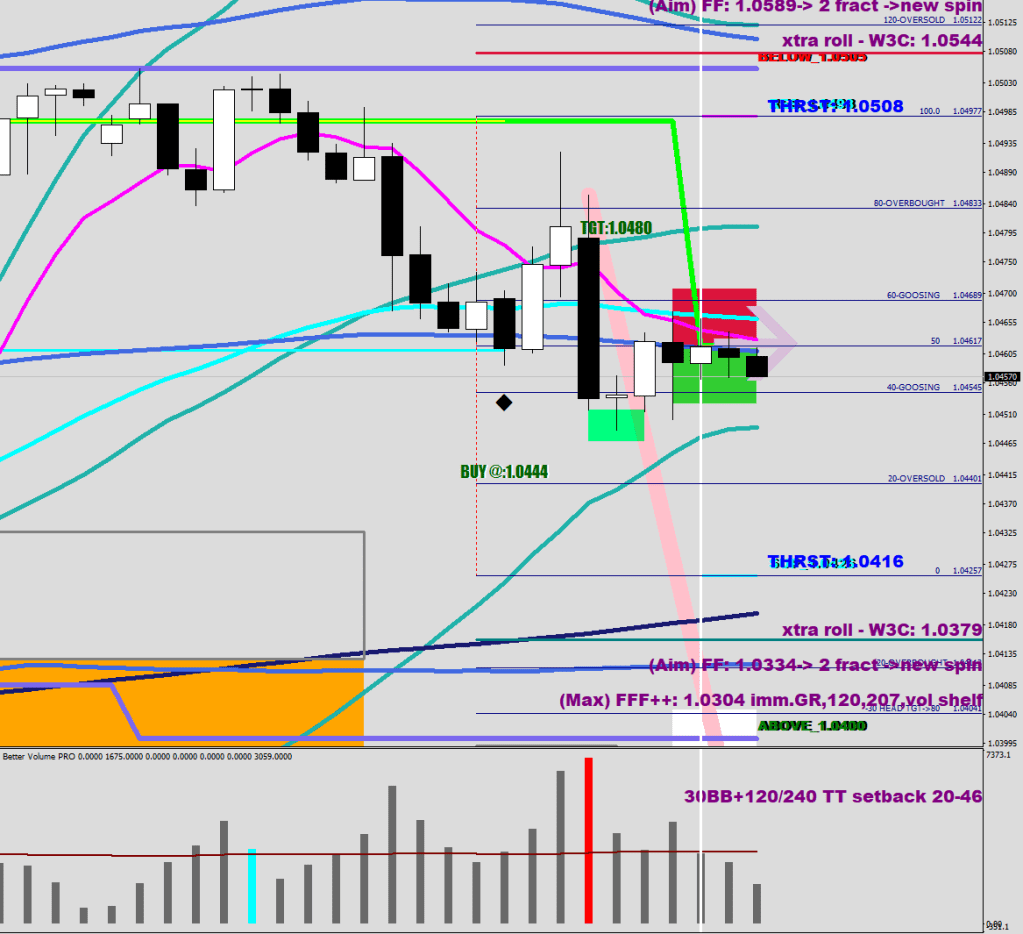
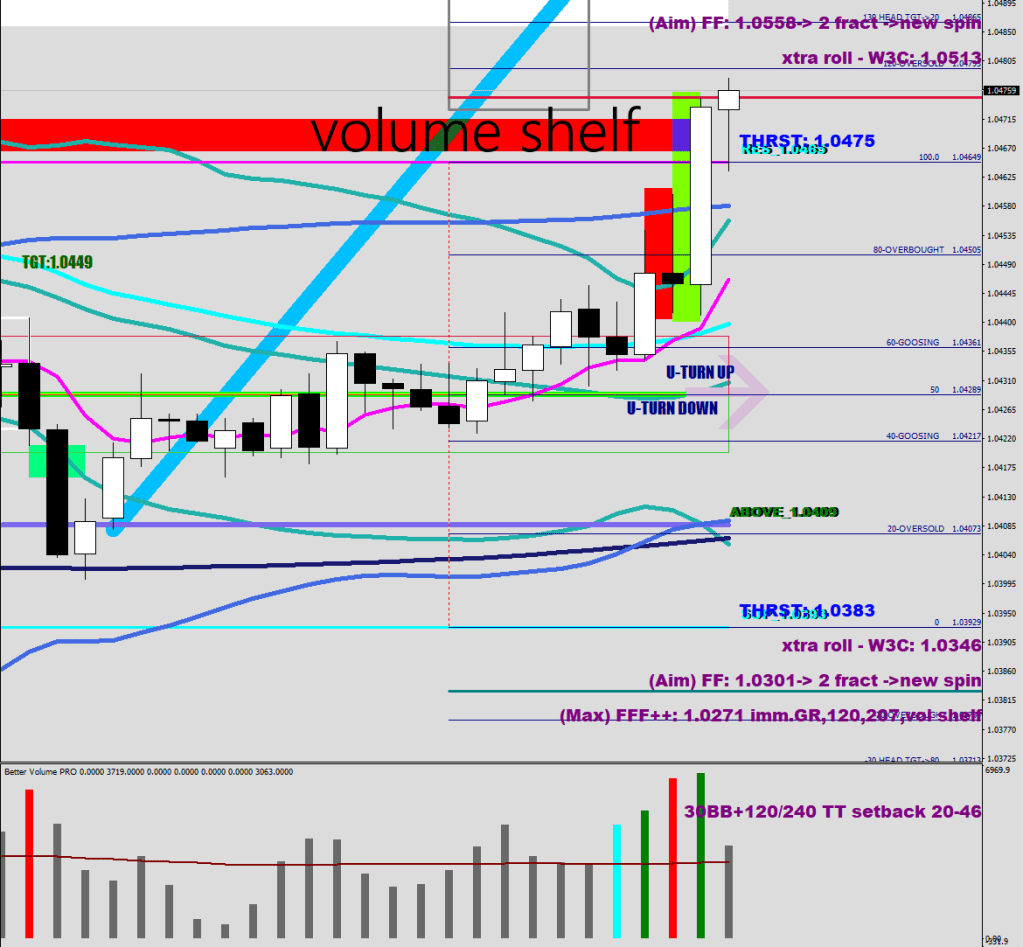
Looking at the cyan, professional-size volume block trades, this looks like a distribution.

The stochastic bars hybrid calls the last high bogus.

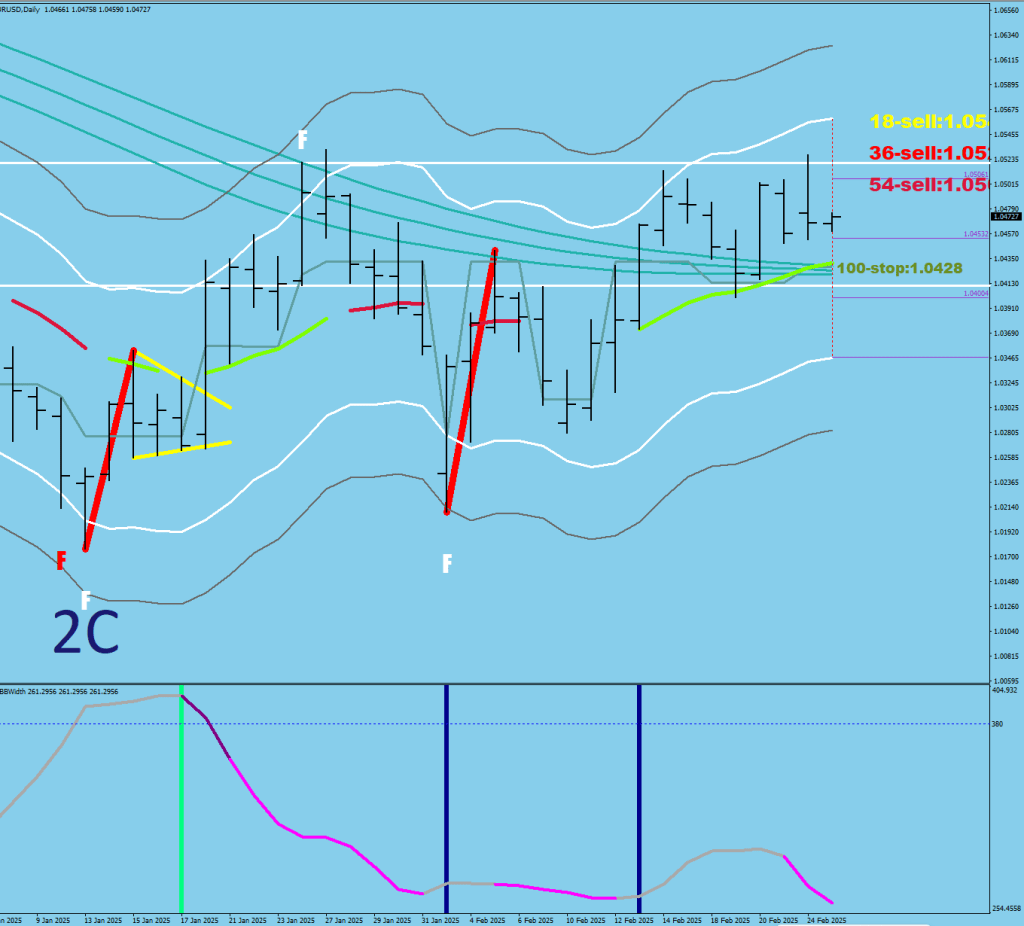
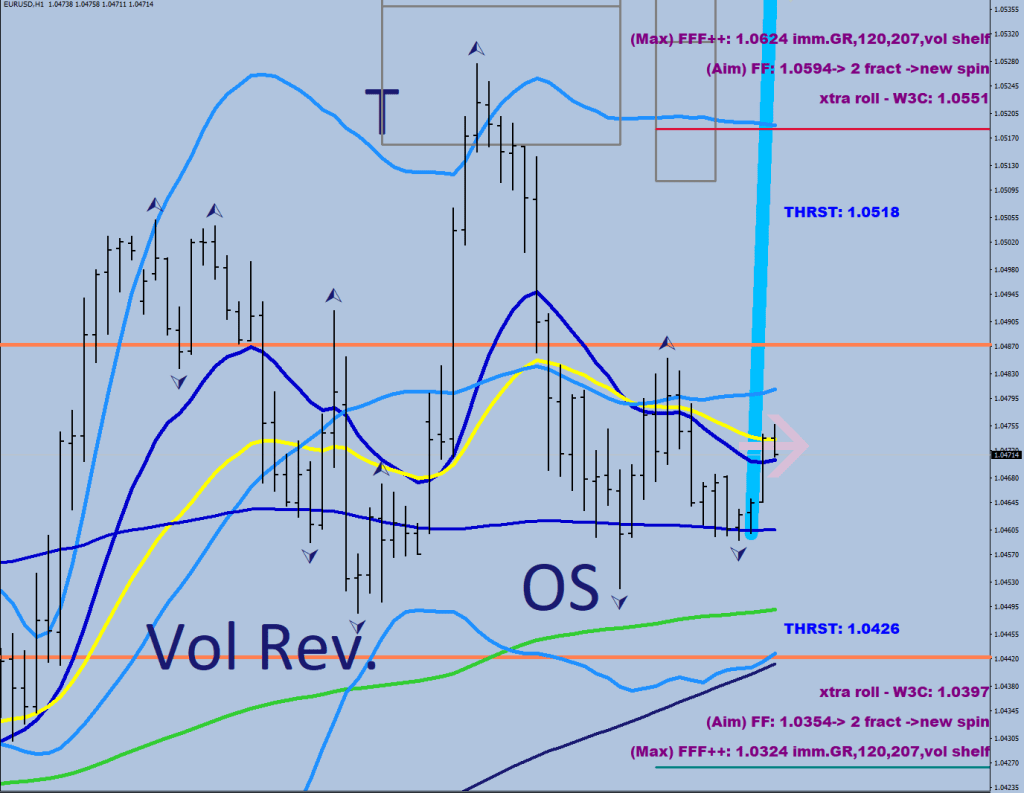
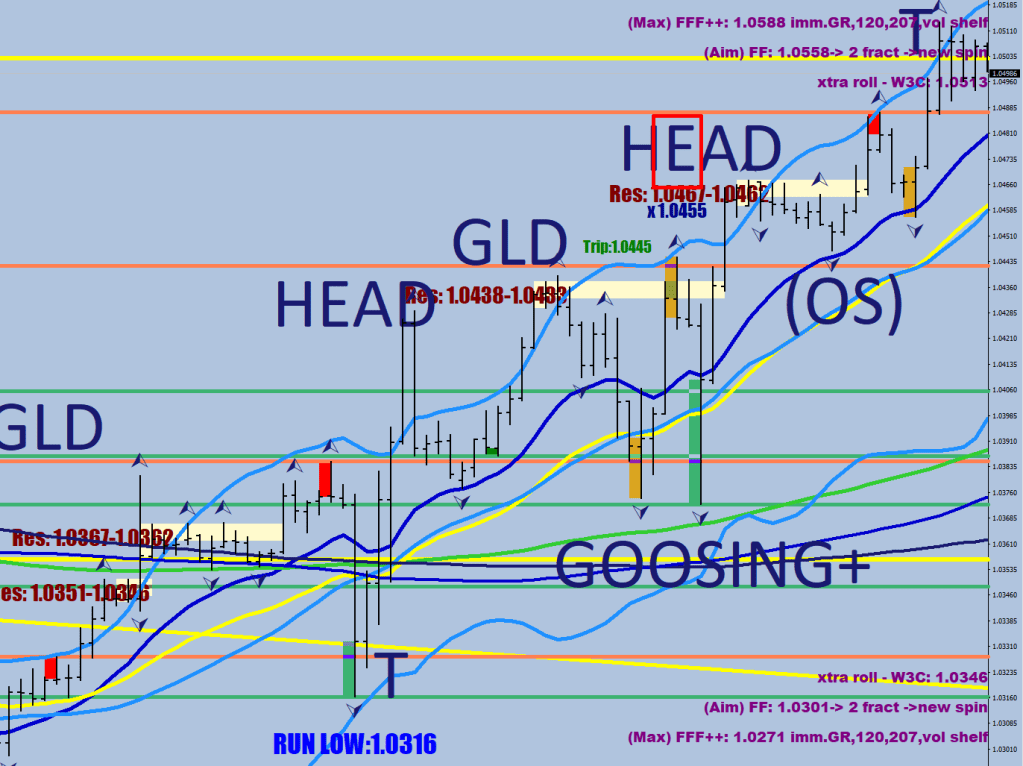
The two interrupted lines are the fair price of the euro based on the last 3 years. This was reverting to the average.

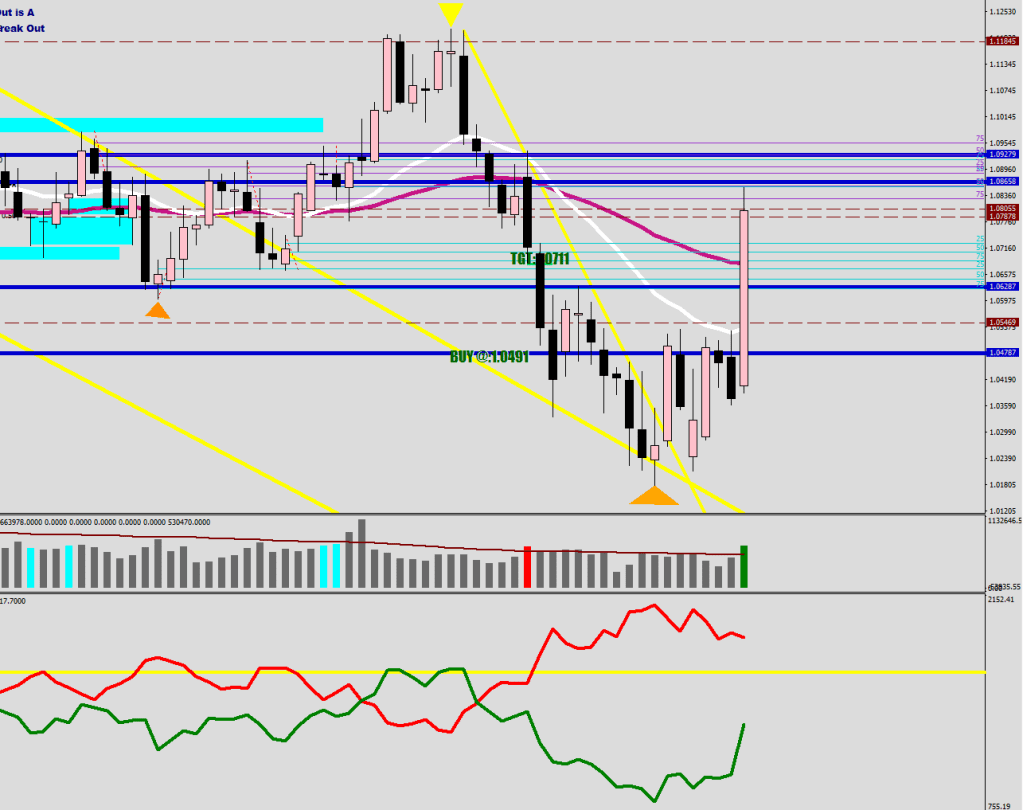
Normally a high volume churn print is followed by 2 more weeks in the same direction, but given the size of this week’s print this looks like 3 weeks in one.

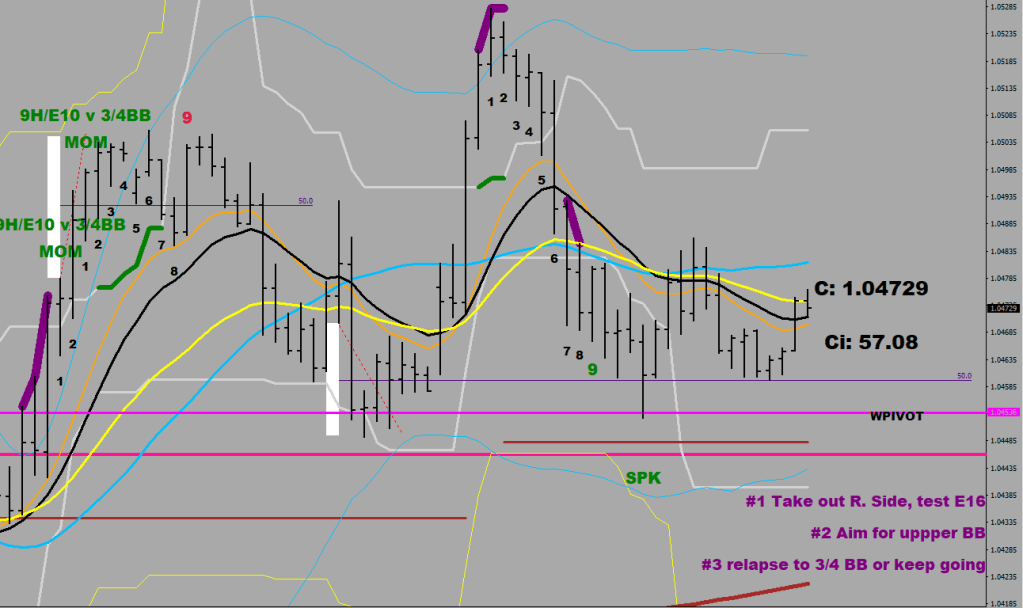
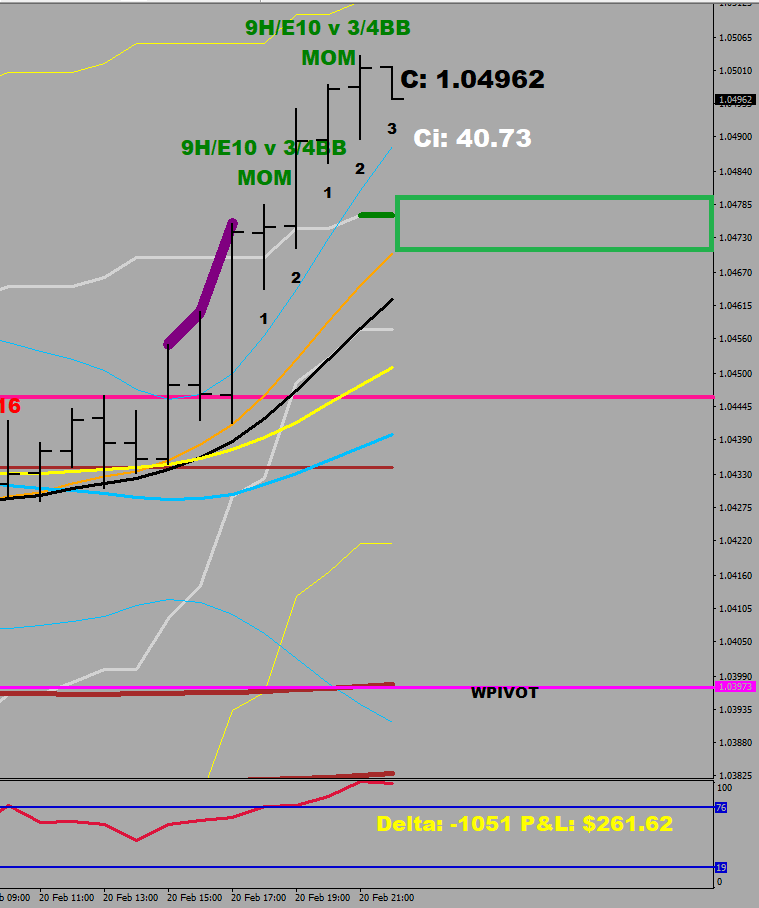
There is a 7.6x->7.55x slight stretch divergence between the two peak fractals.

I don’t think anyone else is looking at this move up as a C wave.
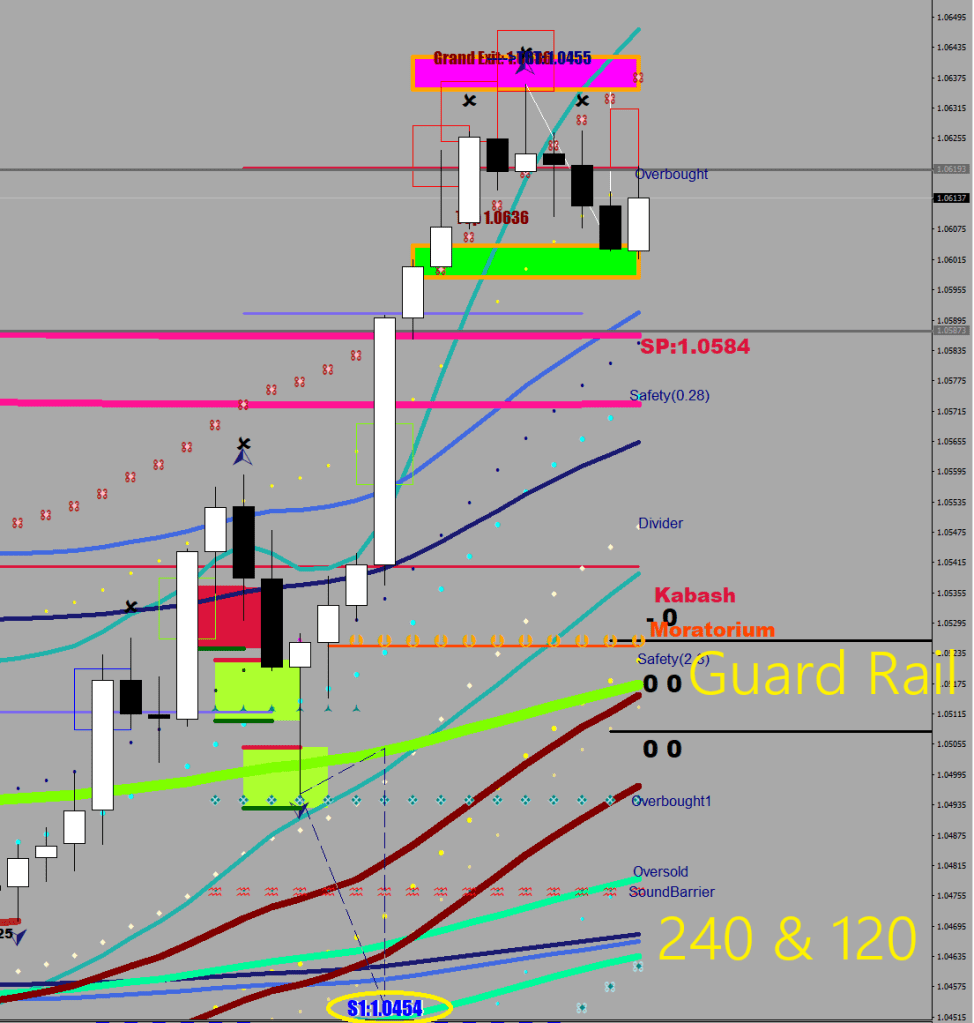
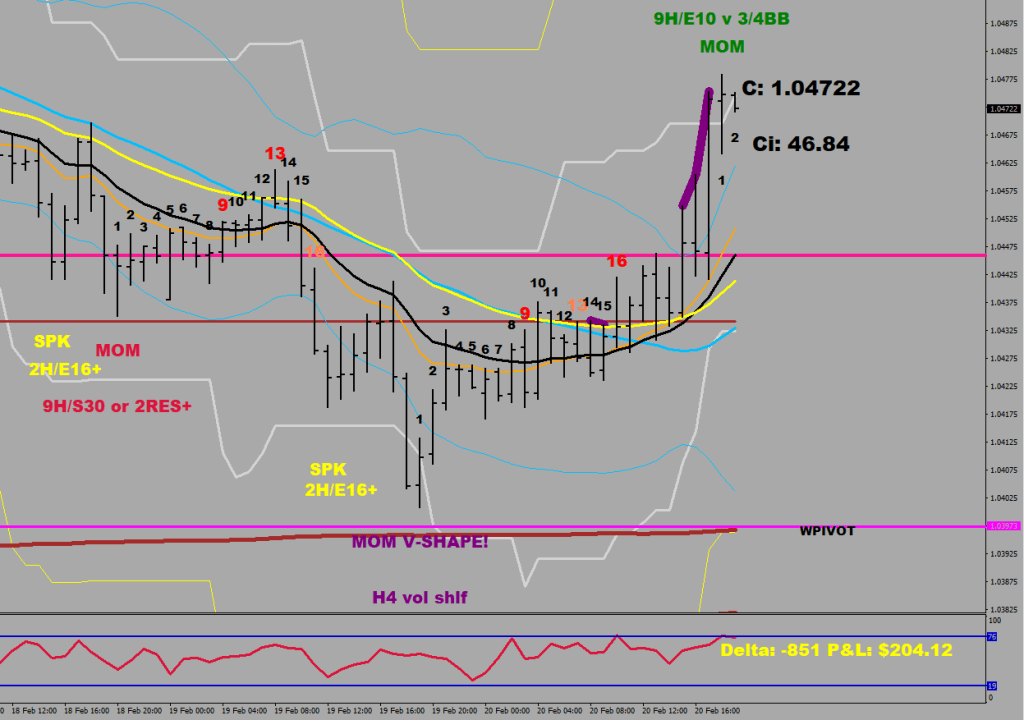
Trade setups

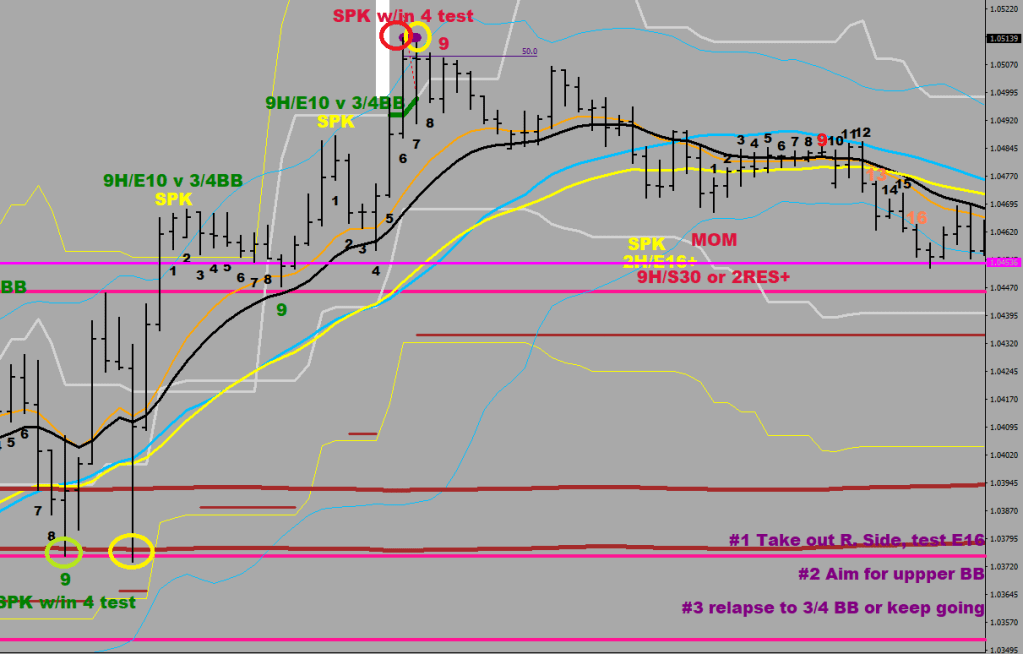
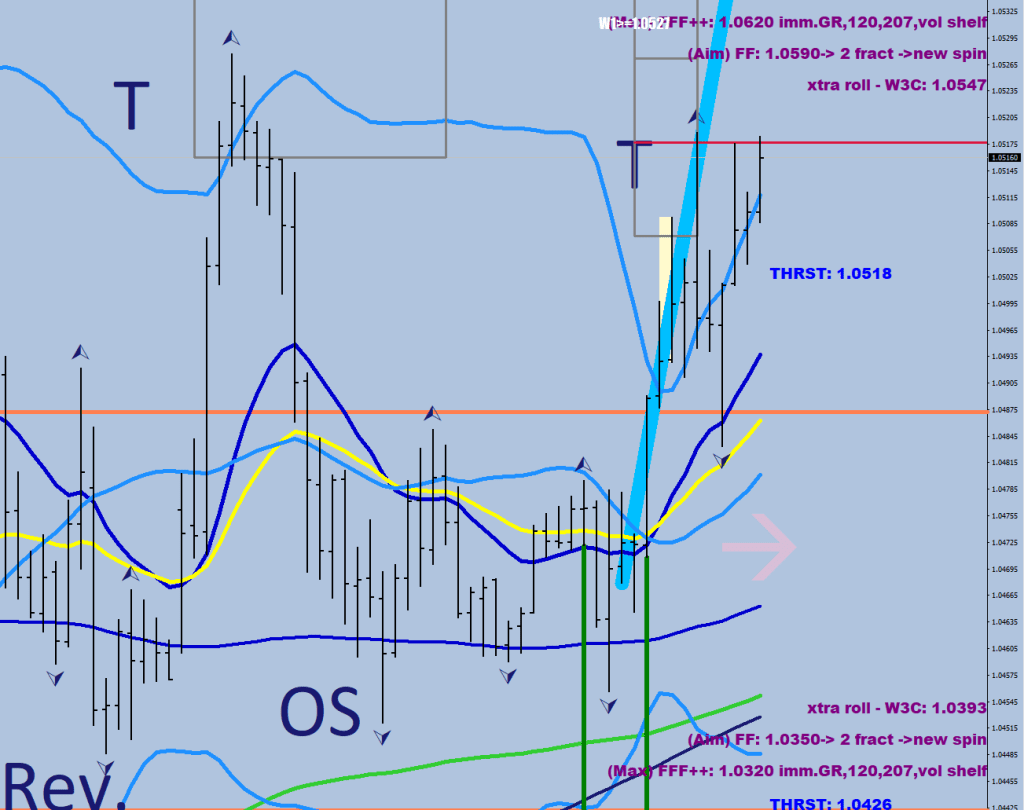
E-8 is the market going parabolic?
Spike back, 3 imcremental candles of a color, go long after the 3rd hour’s close
Stop below candle 3’s body

If not, it’s a fade from beyond the 2nd flipback candle’s wick to the next question, stop 10 pips out

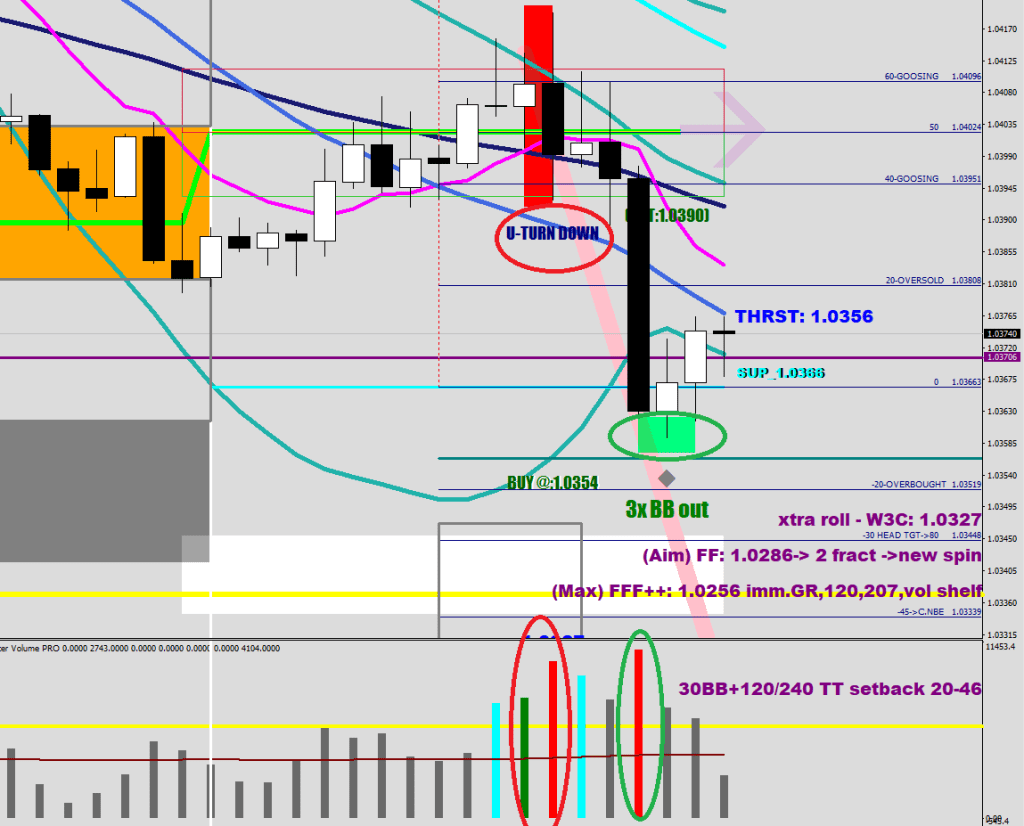
E-16 is the market taking the rat poison?
8 hours above / below,
Spike back, 3 imcremental candles of a color, go long after the 3rd hour’s close
Stop below candle 3’s body
Scale out at FFF+
Close on a reverse (E-8) setup

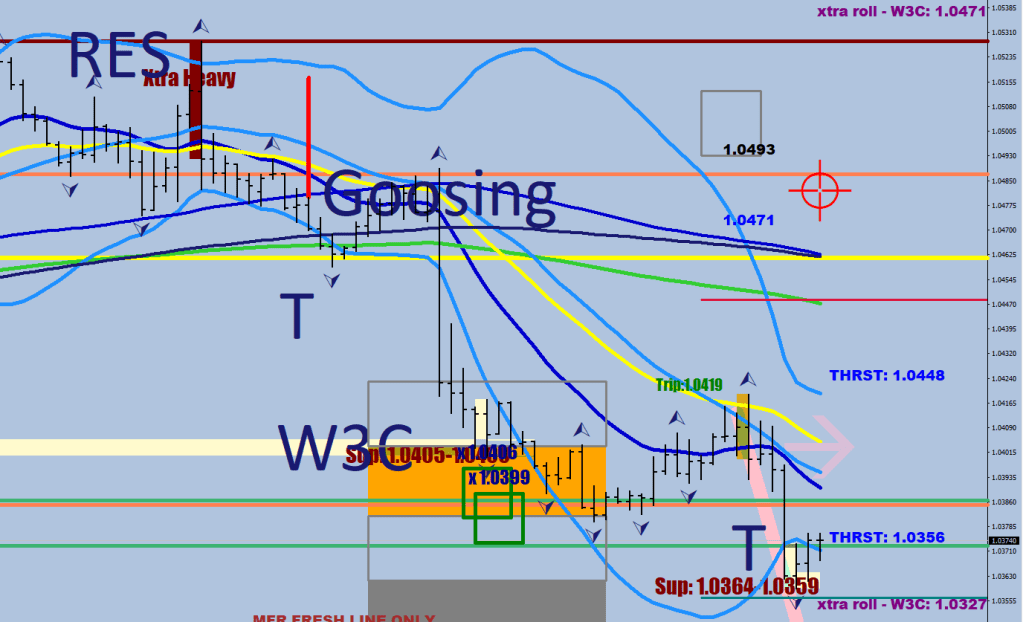
E-4 catastrophic trade
8 hours above / below,
Spike back, 2 imcremental candles of a color, go long after the 3rd hour’s close
Stop below candle 2’s body
Target outside the 240 BB

Limit Down

The price has hit the end of the pendulum with the second 3xBB breach.

The immunity should allow for the Guard Rail, the S120 & 240 to be tagged, and ultimately the S1 at 1.0455.

The 100-pip stop is at 1.0536 currently.

5 Waves Down

Lots of volume signals.

A U-turn down is bearish. A high volume churn down makes its own resistance, in combination with the terminal distance, this is an end of wave/wave structure.

The 5 waves down were a Thrust, a W3C (rounded up to a W3F with the LL), and another Thrust.

It was 4 pips shy of the T level, but you must work with a little slippage. There is a trip high at 1.0419, good for a quick 16-pip trade as is.

The 14th hour was the reversal from the momentum low, and the volatility increase resulted in a V shape bottom.

If you still don’t believe in driven thrusts, you just saw two of them back to back, with the knowledge that the pullback from the HH/LL is a continuation trade targeting the cover line.

As a reminder, this happened on the upside.

I don’t just blog, I also trade.

I should align my thinking though to start using real size for sure bets.

Comments

Professional volume came in a the recent, lower high. I commented the following: if that high gets challenged, they are gonna step up within an extra 15 pips, but I do not expect a challenge within 5 days.

If I had to imagine a “death of money flow” image, it would look like the yellow box. I don’t think this intensity can be kept up for long.

A speculative drawing of an ABC correction with an A leg being a 5-wave structure, a B leg a 3, a C leg another 5 waves. Not sure why, but the idea of a contracting flat correction does not feel satisfying. It feels like another higher high is still in the cards.

I have figured out the filter to distinguish a liquidity break from a stong rally. 130+ pips that is within 2 days.

The BB width just made a new low.

3x BB out #1. We may get 2 more, but the 30BB has to start coming back in radically. The bow back did not make it to the lifeline (8 EMO). Again, this kind of aggression is not sustainable.

The writing was on the wall with that Xtra Heavy MM long cover at the high. The W3C distance got rounded up to a W3F (far end of the orange projection box). We are in a buy box now, so consolidation is more than necessary.

After a W3-something print, the next leg should be a Support or a Thrust print – that would mean a 36-46 pip leg down from the new consolidation mean.

You can see how the Stochastic Bars Hybrid can call attention to a higher high with a missing momentum print.

The up move should cap out at the SOB.

The thrust could get to 1.0365 or so. Scale in to a short between 1.0410 and 1.0427 knowing that a lower low needs to be made for a 3-point turn.

Damage Assessment

only a quick image

The daily stochastic is starting to embed.

The configuration above the 80 line is bullish.

What is missing? At least one more driven thrust to the upside.

The structure of a driven thrust is (1) acceleration, HH (Higher High 4-20 pips extra), (2) thrust.

The above picture has a thin purple line, because the price hasn’t made it outside 2 dev from the S240 line. The grand finale with a thick purple is missing.

Spike On Me

The question is this: is it gonna continue up?

Based on the driven thrust idea, a higher high and a thrust in sequence should exist.

I have noticed something. The 1-hour spikes get a re-test within 4 pips before the over is over.

The red circle was back-tested by the following candle (yellow circle).

The green was back-tested and was even undercut slightly around news.

Spike filters

//downside   
if (i>1 && (Low[i+1]==iLow(symbol,0,iLowest(symbol,0,MODE_LOW,14,i)) || Low[i]==iLow(symbol,0,iLowest(symbol,0,MODE_LOW,14,i-1))) &&
      Low[i+1]<Low[i+2]-90*Point 
      && Low[i]>Low[i+1]-10*Point && Low[i-1]>Low[i+1]
      && High[i+2]<iBands(symbol,0,30,2,0,PRICE_MEDIAN,MODE_UPPER,i+2)
      ) 
//upside
 if (
      i>=0 && High[i+1]>=iHigh(symbol,0,iHighest(symbol,0,MODE_HIGH,14,i))-20*Point &&
      High[i+1]>High[i+2]+130*Point && High[i]<High[i+1]+20*Point && Low[i+1]>iMA(symbol,0,8,0,MODE_EMA,PRICE_OPEN,i+1) 
      )

It could be this simple.

If this fizzles here, printing the second T (thrust distance) and doing three passes over this right shoulder as a lower high… Watch out below.

No Takers

This is totally a buy setup, but no one seems to care, they are refusing to buy.

The BB width is at its lowest, from here on the volatility should start expanding, and the direction… does not look like it would be upwards.

The best clue is on the 200-sample Vax.

Can you see how the red line has been below the purple horizontal line (meaning price above S3), but the green is starting to penetrate the zone itself (time out) promoting the possibility of a switch-off and the start of the compression of the upside volatility.

It would take a 20-pip move to find itself below the daily E-9 band (E-207 hourly, the two spring green lines above) and from then on… you could have a 9-12 days disconnect and keeping away.

If anything you seem to be finding acceptance near the oversold field.

I am not certain that the professional volume print (cyan) wasn’t a big sell.

A spike low, but no rally commencing.


#55 is dub step, house, trap, Eurodisco and R&B.

Reversal Zones

The white rectangles are likely reversal attempts. Once the far end gets taken by 10+ pips, the zone is considered a bust.

A reversal is a process, where the 16 EMA is the first challenge (fork for a relapse), then the 30 sample BB on the other side, where the whole thing could fail again, and the reversal was only a success if it starts to ride the 30 sample BB.

The filters for the long side:

I’m still working on the terminology, but I went with “discharge” first for the 16+ pips step (1/2 fluctuation size) that I am looking for.

if (High[i]>High[i+1]+160*Point && Close[i+1]>Open[i+1] && Low[i+2] && Low[i+1]>iMA(symbol,0,16,0,MODE_EMA,PRICE_MEDIAN,i+1)
   && High[i+2]-Low[i+2]>100*Point
   && High[i]<High[i+1]+500*Point 
   && High[i]<ExtUpperBuffer3[i]-20*Point

As for what happens next, I believe that the revesal zone up is going to be called a bust: there has not been a proper lower BB test yet, meaning the upper reversal is still running its course. 1.0440 should be in the cards, as that is currently where the oversold level starts, and a full no break extension / thrust would put the price at 1.0416.

The German elections could certainly cause a bit of a gap this weekend. Either way, I went in with 4 lots short.

GLD Examples

GLD stands for Goldilocks. The market gained the right to continue higher after a pullback & a correction or a correction.

The Goldilocks level can mean a Wave 1 or a Wave 3.

During the last leg up a GLD was followed by a pullback to the E16 (only 26 pips down), a marginally higher high, then a 68-pips correction with the MM rolling out of shorts.

The second GLD example was a correction of 64 pips.

Currently the price has been outside the BB for 4 hours straight, so upon re-entry the MM may want to square their shorts, like so:

All the way to the 10 EMA.

I hope this gives you some idea of what to do.

Scale in, but try to get a good location. Lay the bulk between 1.0480 and 1.0470.

End of B

This was a Shape up to a No Break Extension (T). There was a volume shelf attraction, and a triple volume flip that made this possible.

Blue horizontal is still a resistance.

Buy the 9th hour for a higher high.

It should cap out between 80 and 90. You want to see a spike high, not a Momentum one.

The head level started at 1.0486

Refer to my Head Chokes entry to figure out how to work with a pending head.

I have a 2-pip tolerance for keeping the spike high in place.

   
      if (
      i>=0 && High[i+1]>=iHigh(symbol,0,iHighest(symbol,0,MODE_HIGH,14,i))-20*Point &&
      High[i+1]>High[i+2]+130*Point && High[i]<High[i+1]+20*Point && Low[i+1]>iMA(symbol,0,8,0,MODE_EMA,PRICE_OPEN,i+1) 
      ) {
        ObjectCreate("Countessz"+i,OBJ_TEXT, 0, Time[i+1], High[i+1]+90*Point);
             ObjectSetText("Countessz"+i, "SPK", 15, "Arial Black", clrCrimson);
             if (Open[i]<Close[i]) ObjectSetText("Countessz"+i, "SPK", 15, "Arial Black", clrYellow);
             
              }