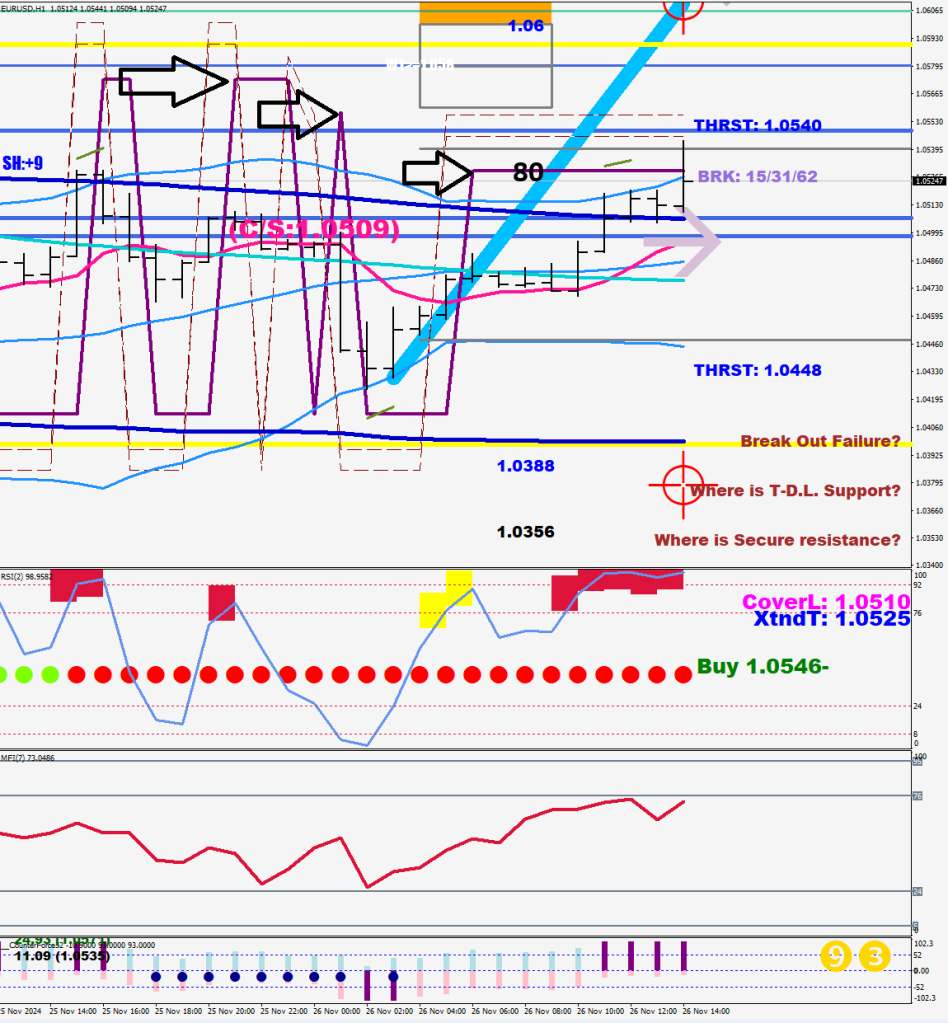
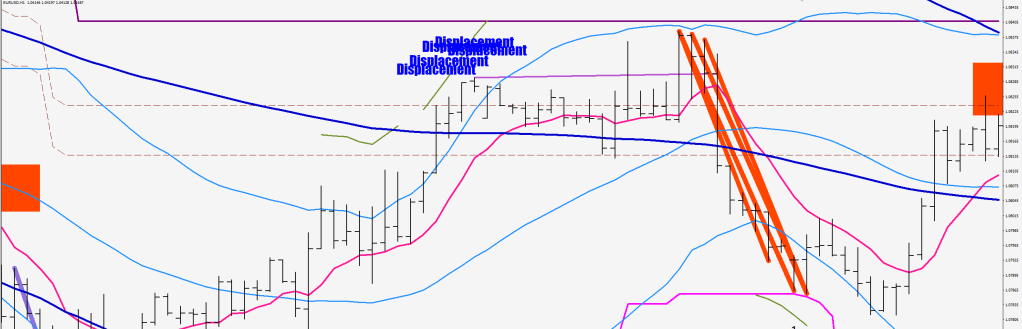
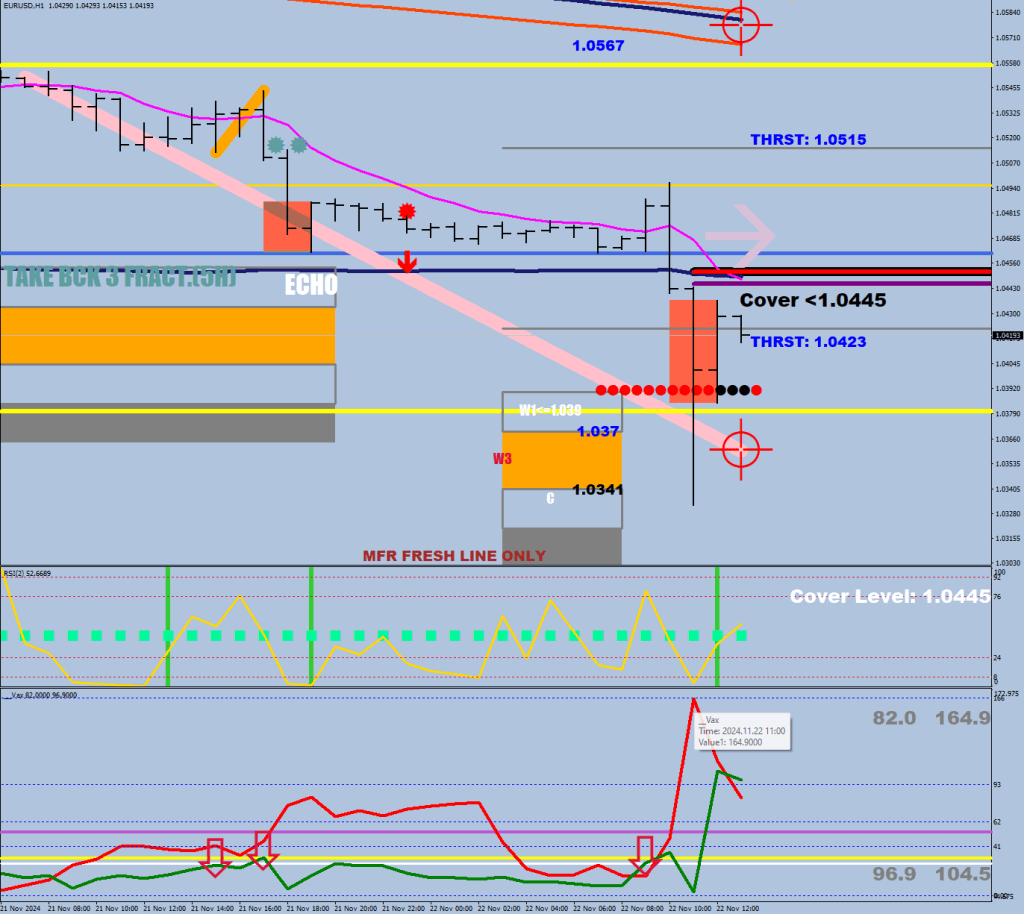
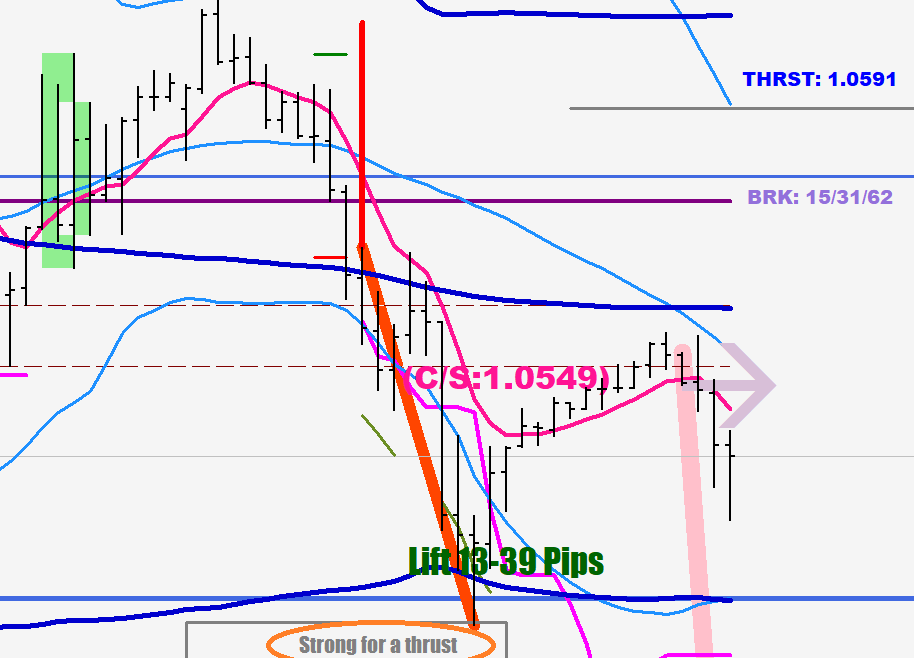
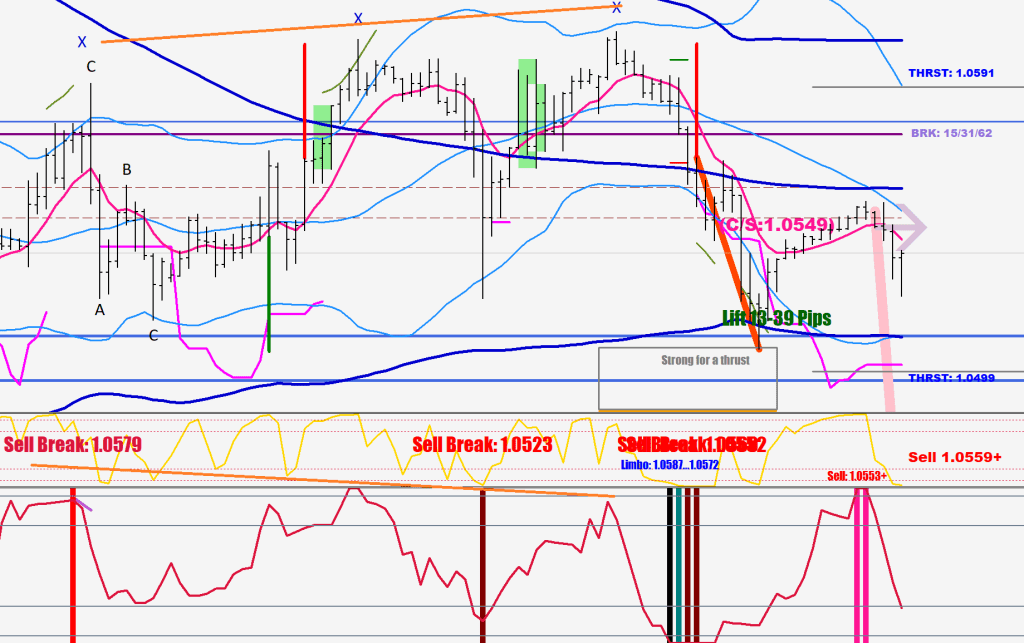
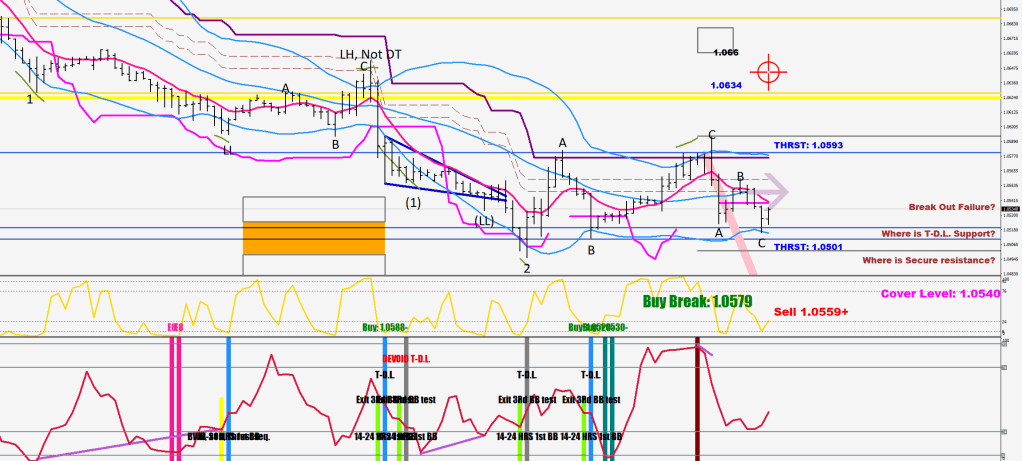
The first touch of the Daily E-9 (orange band) and the 80-pip line.
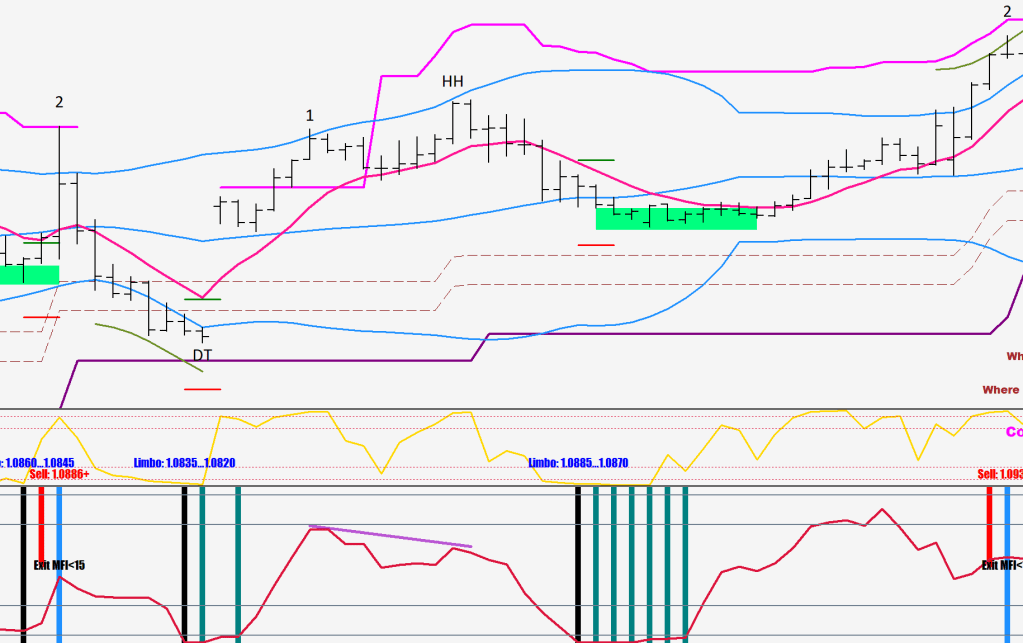
A triple resistance was built (green rectangles) and we saw a piercing move outside.
I believe this to be the end of an ABC correction.
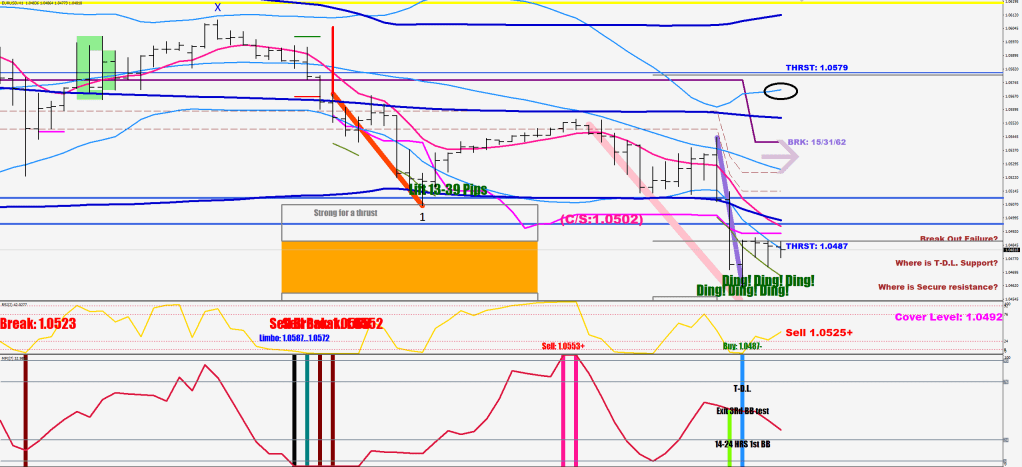
The arrows show how the 200-sample high got closer and closer. Whenever you have a displacement, picture the actual stronghold as another 9 pips out (i.e. for measuring risk) 1.0539 was exceeded but has not been closed above.
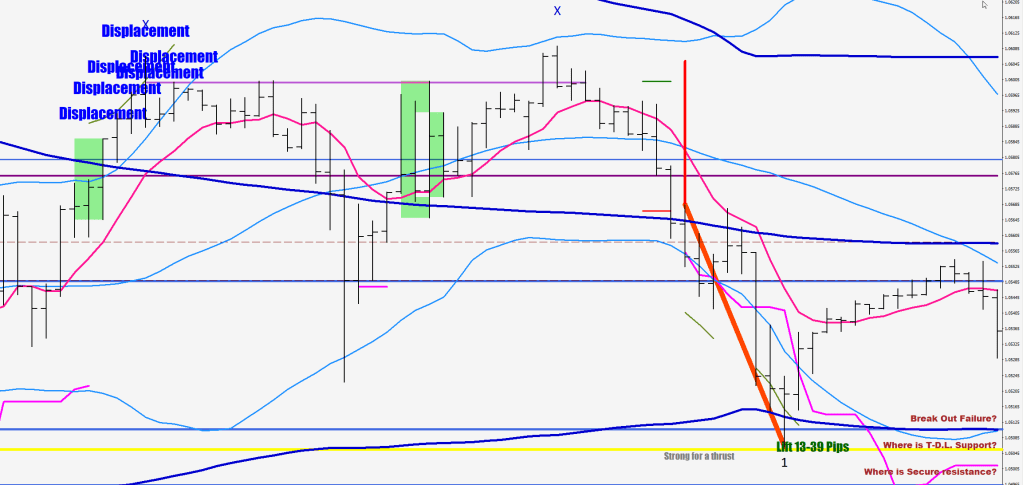
If the market was to consolidate between the 53 and 63 lines above that would mean having found support (& a complete regime change), but that would require a drop first, as this move is out of steam.
The resistance zone above is 51 pips wide. It is not going to give for a simple pass. Price would have to consolidate in that body to have any hope of clearing it.
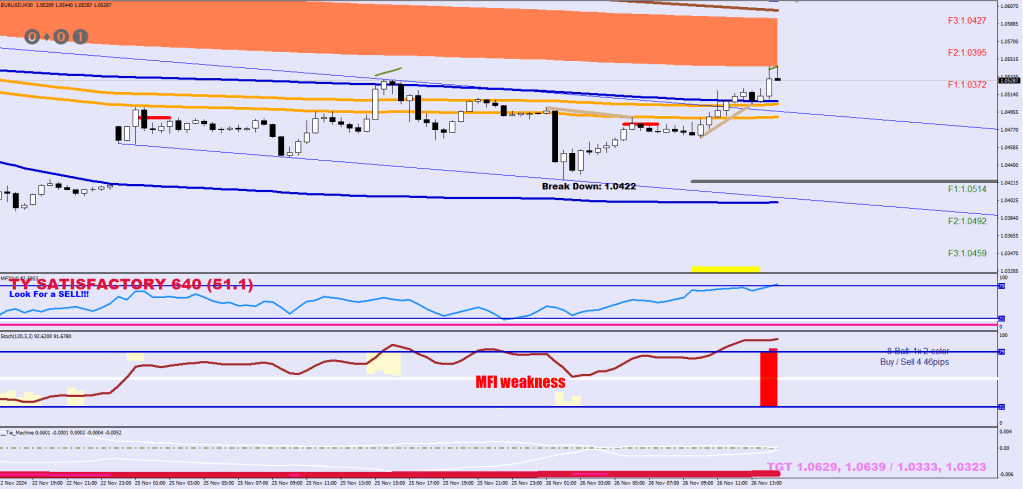
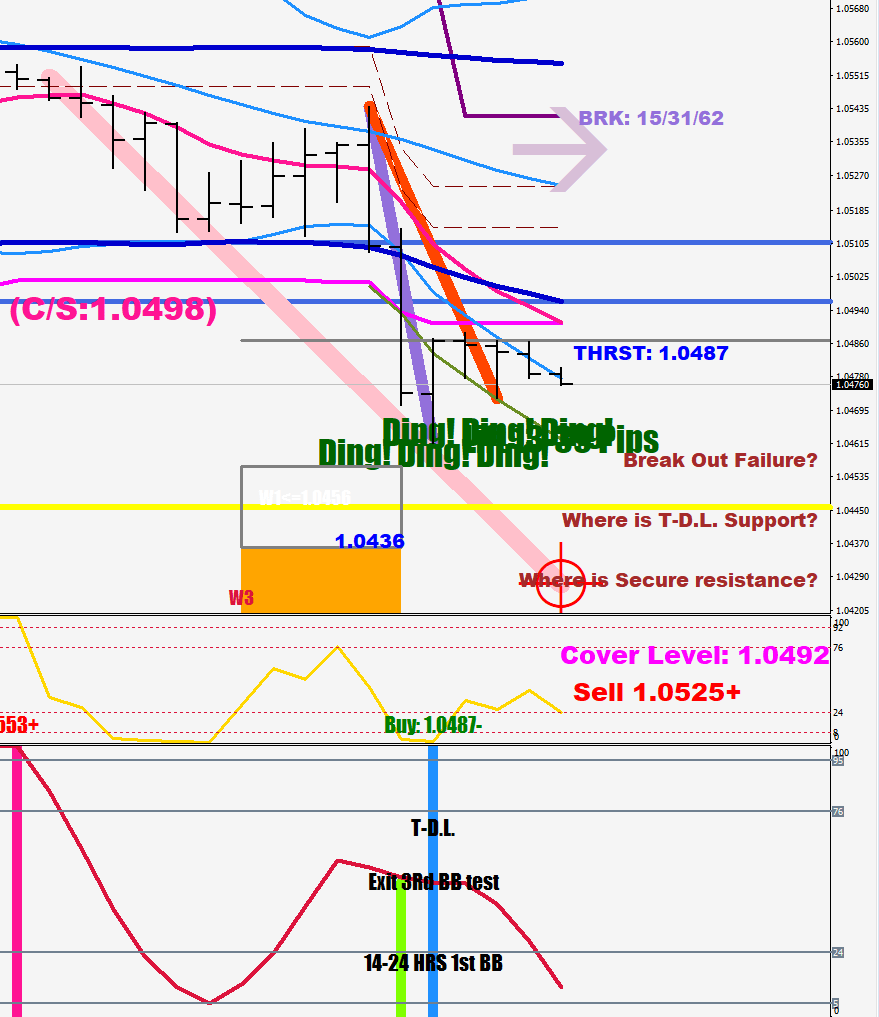
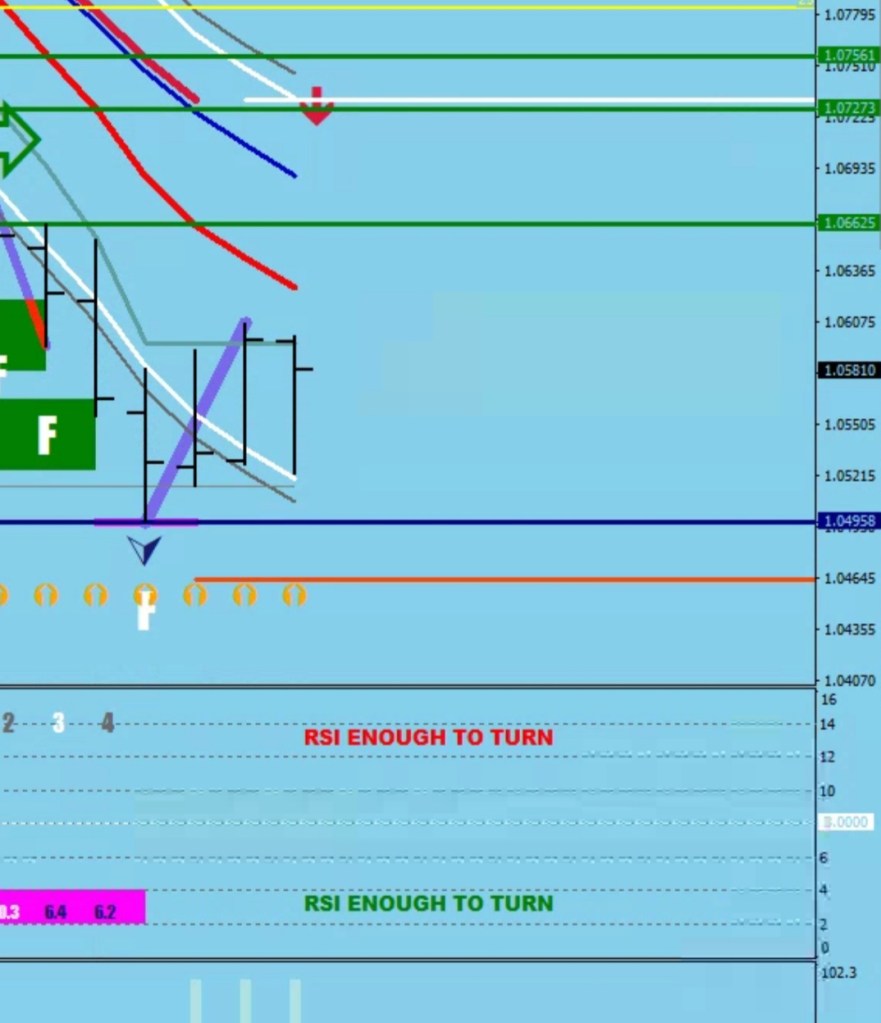
As for the downside, the gap hasn’t been fully filled. Keep an eye on retesting Friday’s close at 1.0418 for a possible buy. I think a 30-pip undercut would be another option.
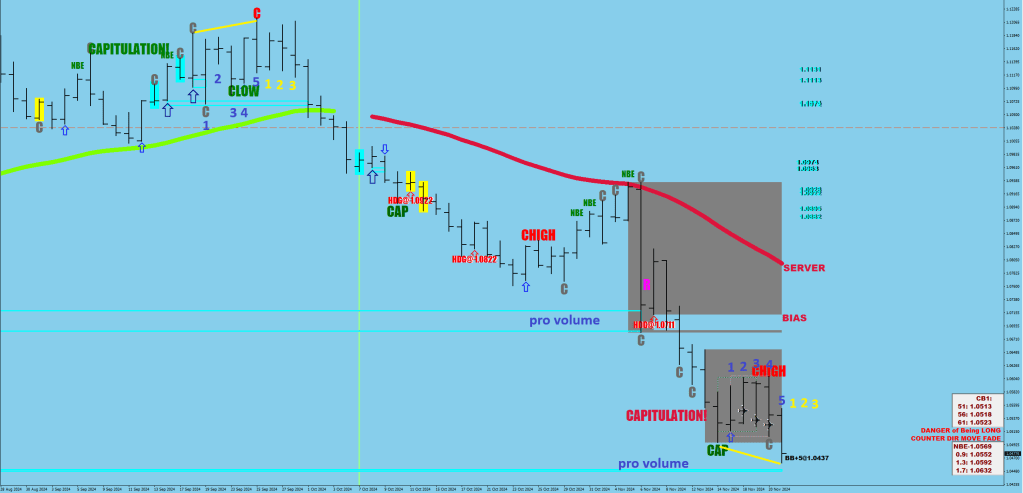
The market would have gone a bit too far if it exceeded the 30-sample BB and is beyond the 120 SMA, although it would a great fade for the most part, but it could be prone to trigger a regime change if it was doing it within 80 pips of the 200-sample hourly high.
To my surprise, the main filter was actually an MFI range.
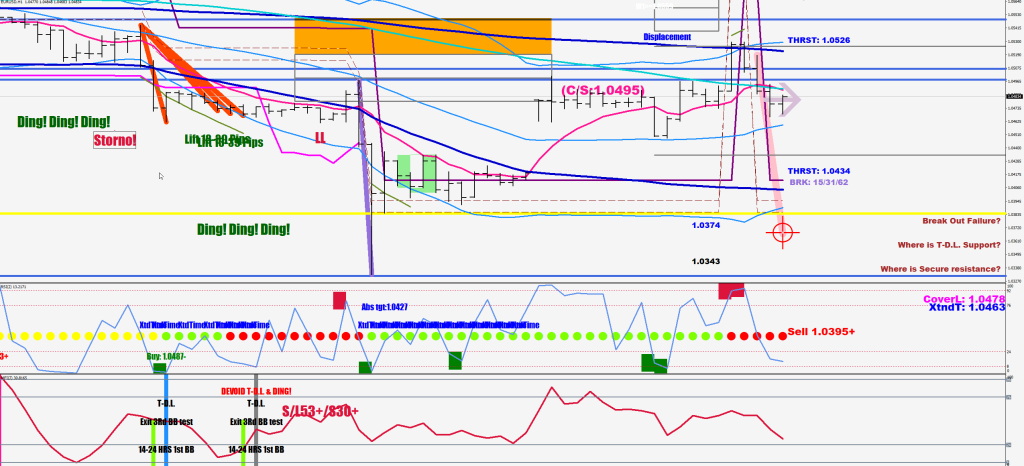
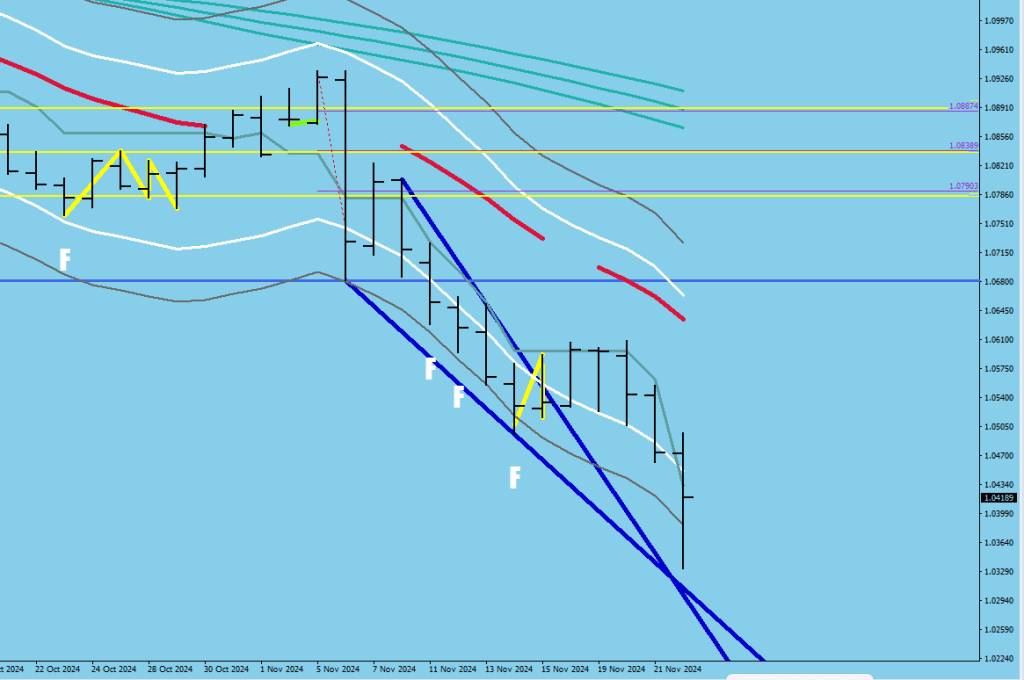
…The yellow trendline was undercut.
The upside configuration would start printing as soon as the 8.3-day high would be within 80 pips.
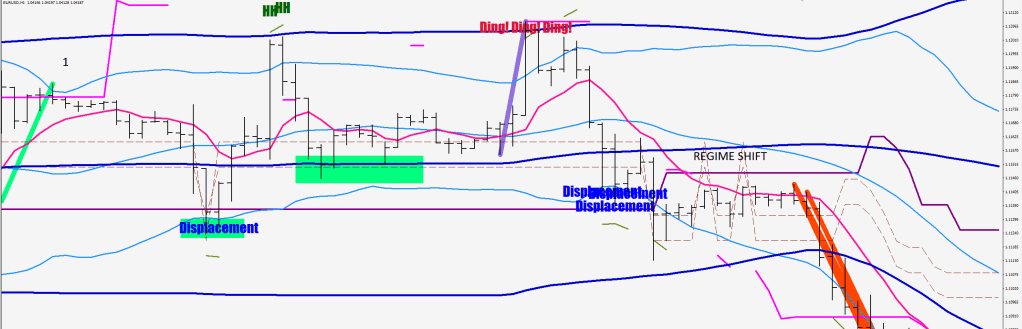
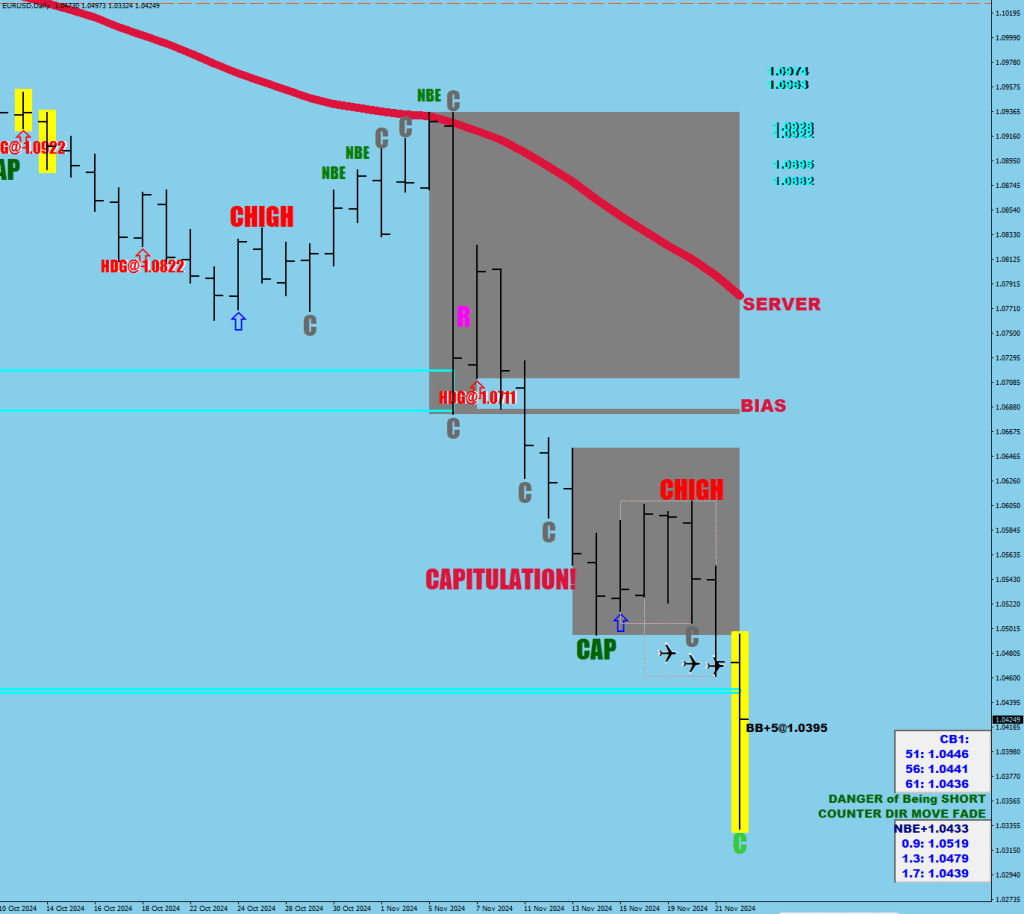
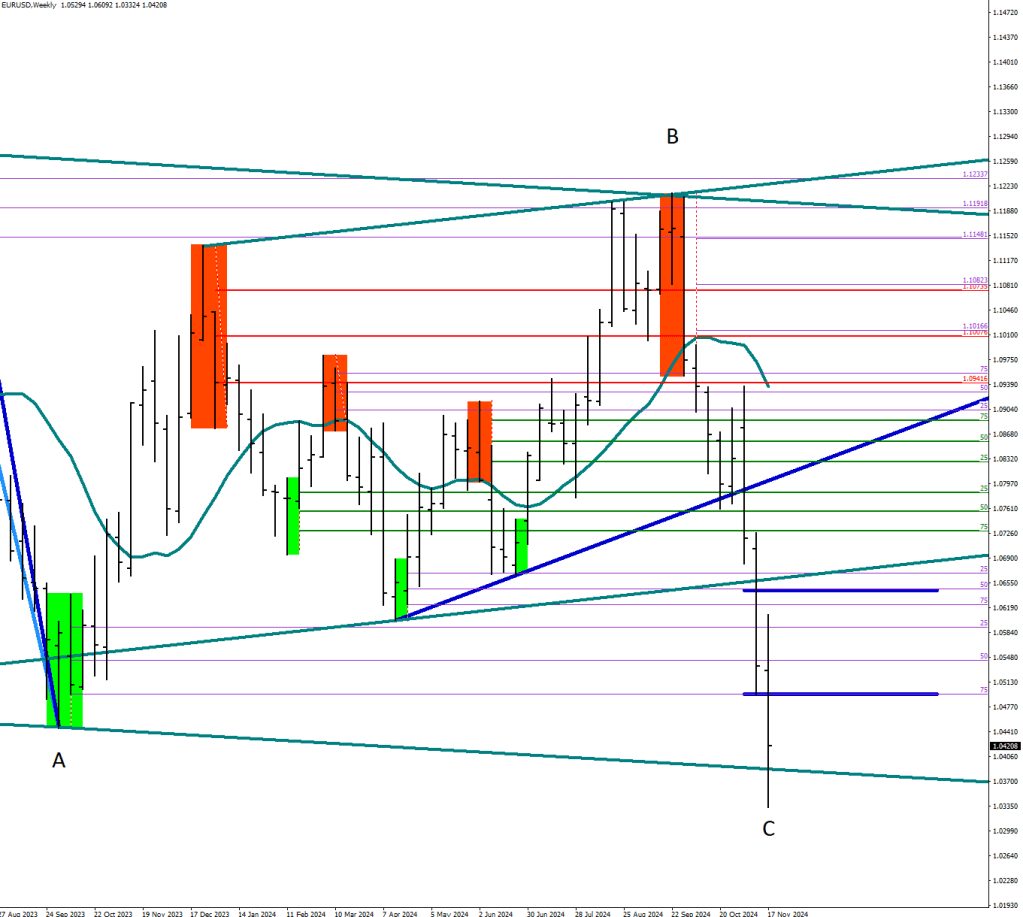
From 1.05278 to 1.0413 is no man’s land, and the price does not have a lot of profile to work with. A consolidation of 17+ pips above 1.05278 would be a complete regime change. One possibility is marking time and bringing the upper limit closer. 6 more days sideways would bring the upper line lower by 55 pips. The close was just below the required 91+ pips to call a swing low yet.
The first thing is a pro-volume print at 1.0447 just below.
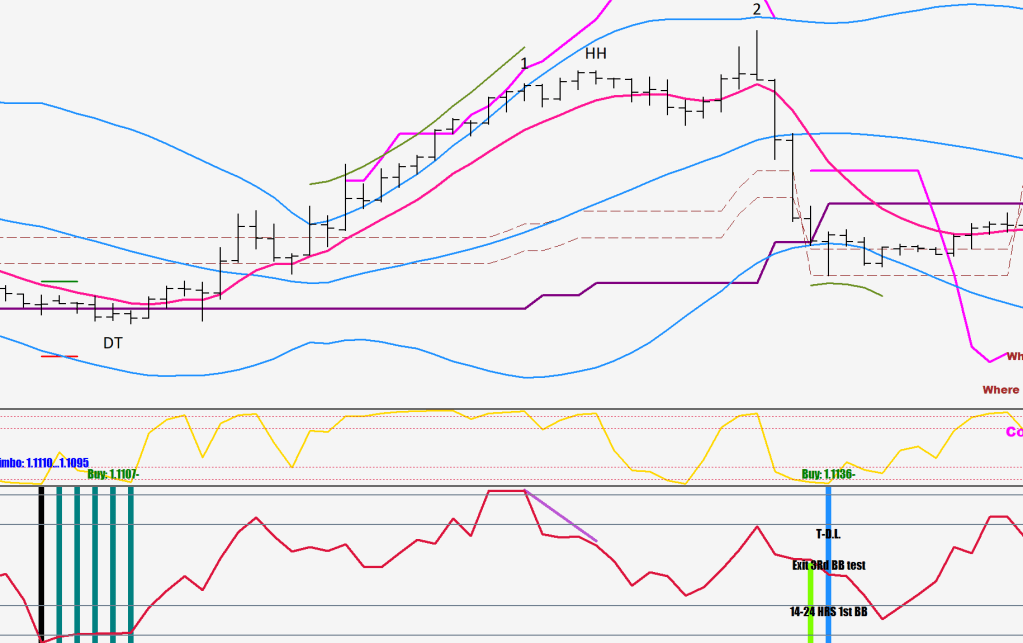
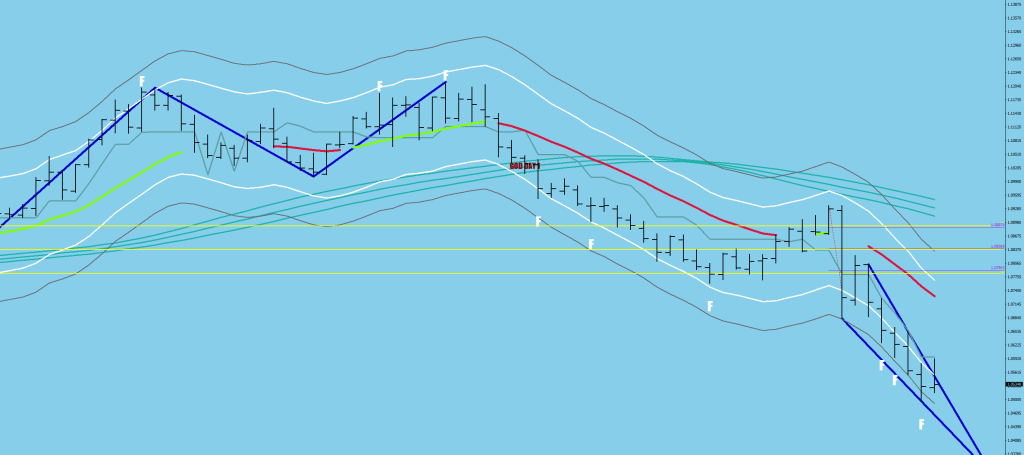
The second thing is a mirror analog at the top there was a 5-day bow back resulting in a higher high followed by a 3-day bow back (lower high) before the end sequence.
I know it is tempting to start dreaming about tagging the lower trendline.
Let’s see how the week finishes up. The overshoot is a common theme. I think it would be back above the blue line.
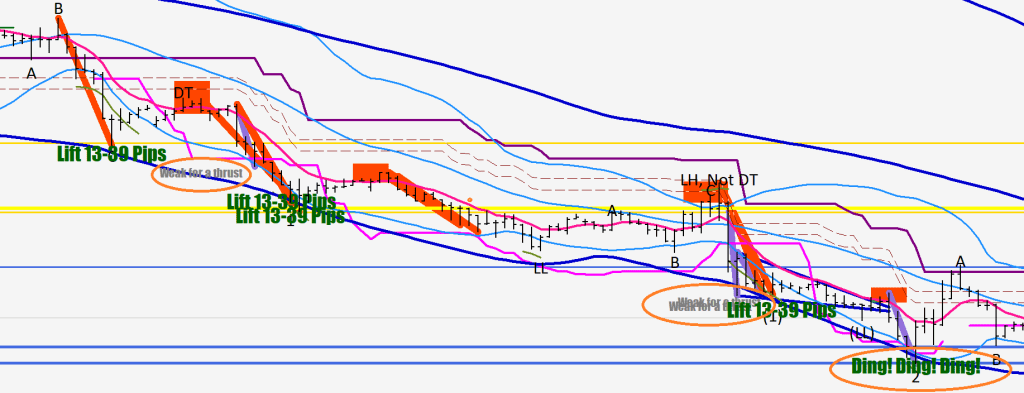
I do not have an example in the last 1200 hours when a thrust was undercut before the upper 30-sample BB was hit/pushed on at least 2 times.
For a C or Cap print, I am monitoring for a 27-pip close-up from the low – sort of out of time for that.
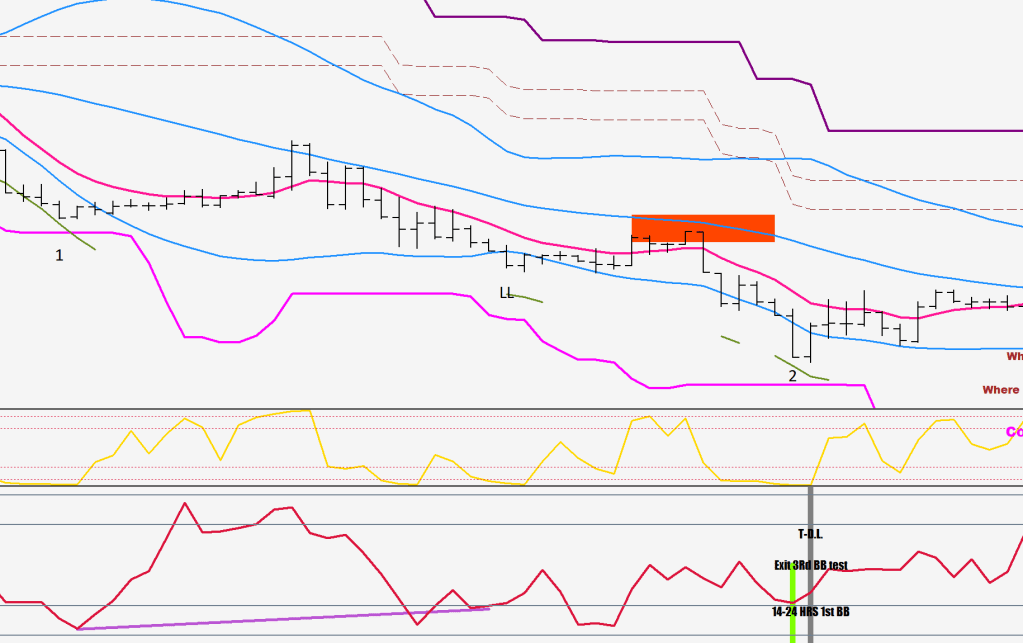
1.0461->1.0488 one way to fix this is making a marginally lower low come tomorrow.
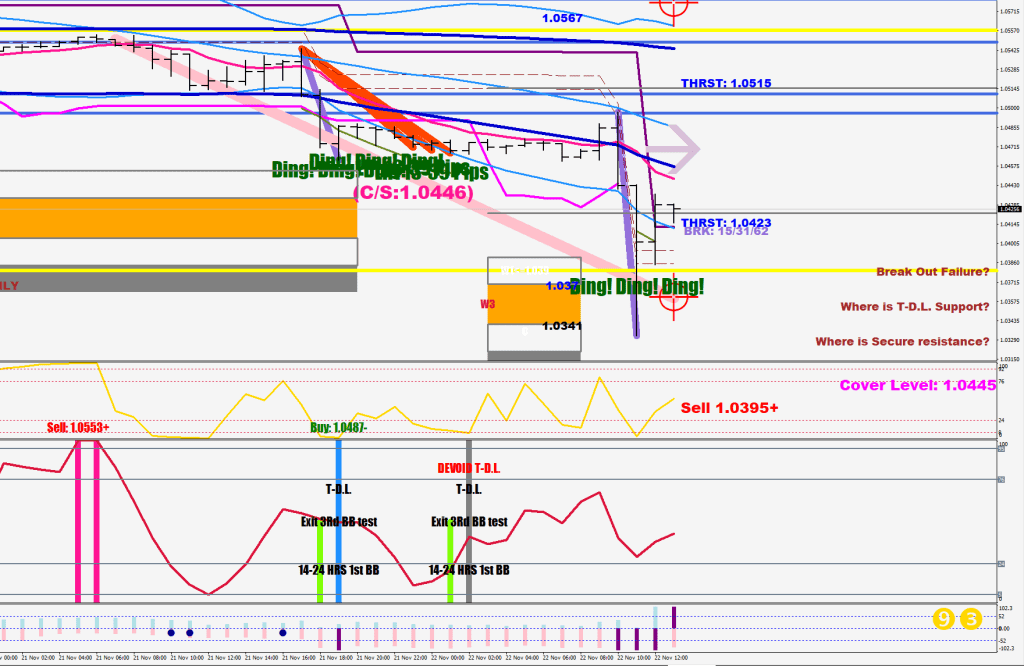
So it’s a face-off of the signals. Bing and T-D.L blue stipe has never been violated on the downside versus the ECHO print that has a small moratorium field of 10 pips or so.
This is a very tricky close with the money flow getting oversold again into the close. In fact, a new drive print (orange) has just been plotted.
Lots of news tomorrow. Yesterday’s high could hold for a couple of days as per the analog.
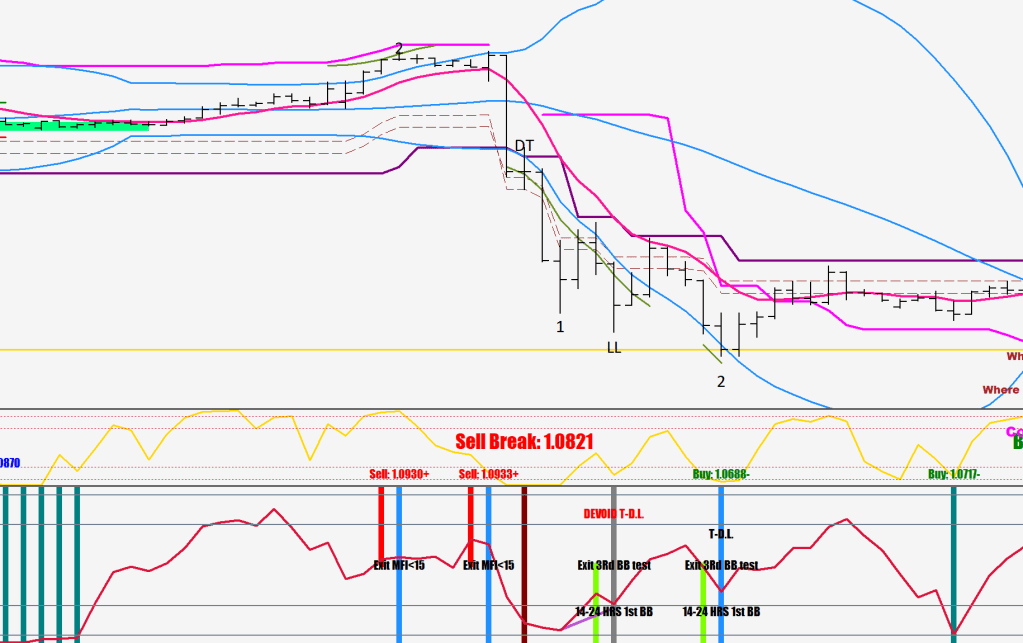
The upside has failed with a double divergence, and the market went Jackson 5 and said “I wanna be starting something”. The sequence of the events is always the same.
There are 3 elements. The drive section has an acceleration followed by a Lower Low. The last part is the Thrust – but it cannot be too strong or too weak.
What is required for a total regime change? Data. Data needs time. 200 hours is 8.3 days.The 200 sample high / low has to come close enough that you can make a sustainable break. You need the telative to what. Until then all bteaks would fail back beyond the 80-pip line into the configuration defining range
The toal regime shift requires the other configuration to print, eith the new 53 and 63 lines.
I’m noticing check points beyond thd 80-line. 15, 31, 62 pips – double or so would mean 123 in theory beyond.
62 pips would mean 1.0640-ish.
Try to appreciate the fact that the thrust was preceded by a quadruple drive sequence (orange lines).
I know I said about the 5.16x stretch, which is an acceleration and impulse waves don’t end in strength. A C wave however could.
Maybe all you needed was an absolute conviction for DXY 110, Euro parity etc.
I believe that 2 bow-backs is all that you ‘re gonna see for downside.
In the prior example there was a 5-day bow-back followed by a 3-day (a sequence ends with the following day printing a higher low. There was a 1-pip beat of the swing low on day 8.3
Today is day 3 of the first bow-back. When the second one ends, the down move gets timed out.
A fresh out makes a 33-pip push beyond a previous day’s extreme, achieves a stretch of 2.x, it closes back by a certain number of pips, and you are most curious about when this happens for the 3rd time, as that high/low should not get a beat, at all.
Well, alright, this one received a 1-pip beat 8 days later.
The two sides are not entirely symmetrical, I just went with the stats. Not a whole lot of conclusions, only a few, for instance, that the 10th day can make a successful break – until then you should be fading the attempts.